
Market
DOGS Token Faces Major Test as 99% of Holders Are Underwater

The hype around the Telegram-linked meme coin DOGS has taken a sharp turn, as nearly 99% of its holders are now in losses just about 60 days after its listing.
Once a token of high expectations, DOGS has been hit by relentless selling pressure, leaving early investors deep underwater. With mounting concerns over its future, the meme coin now faces a crucial test. Can it recover, or is it heading towards further decline?
Interest in Telegram’s Flagship Meme Coin Plunges
DOGS, which launched on August 26 with the distribution of approximately 40 billion tokens to around 17 million Telegram users, had an initial price of $0.0017. However, since then, the meme coin has plummeted by 56%.
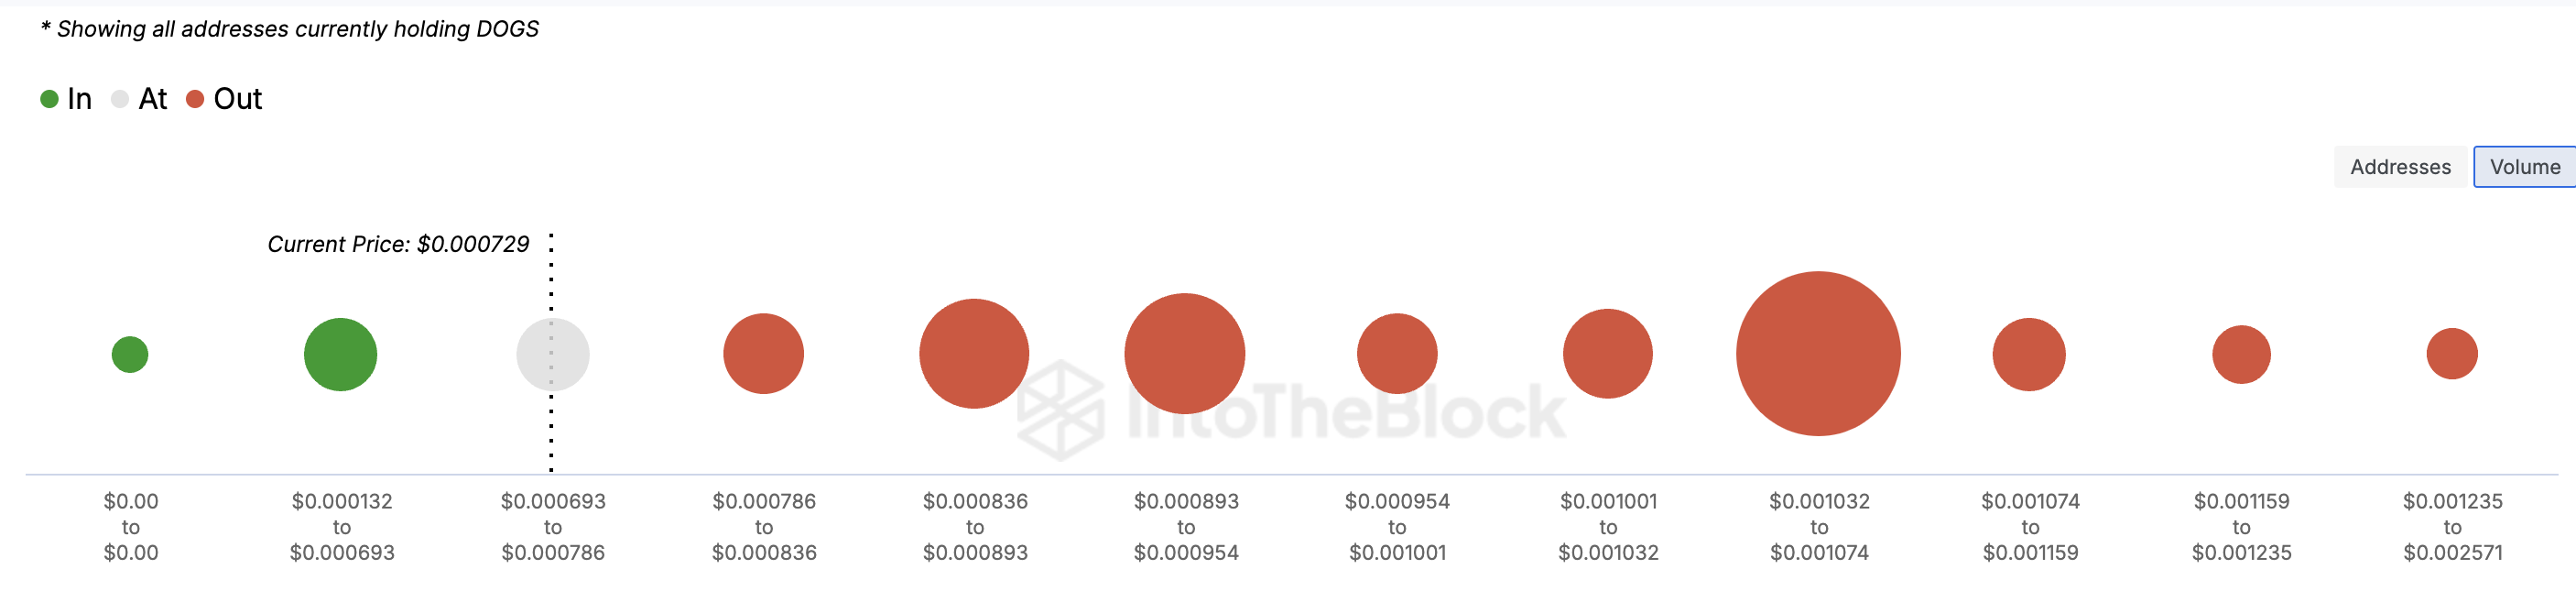
According to the Global In/Out of Money (GIOM) indicator, nearly 99% of DOGS holders are at a loss, with billions of addresses that purchased DOGS between $0.00079 and $0.0013 currently holding the token at a loss.
Apart from highlighting the on-chain cost basis, the GIOM also reveals whether a token is facing resistance or support. A large cluster of addresses or tokens within a price range signals significant support or resistance. Presently, the large number of DOGS holders out of the money indicates that the price may struggle to rise and could potentially fall again.
Read more: What Are Telegram Bot Coins?
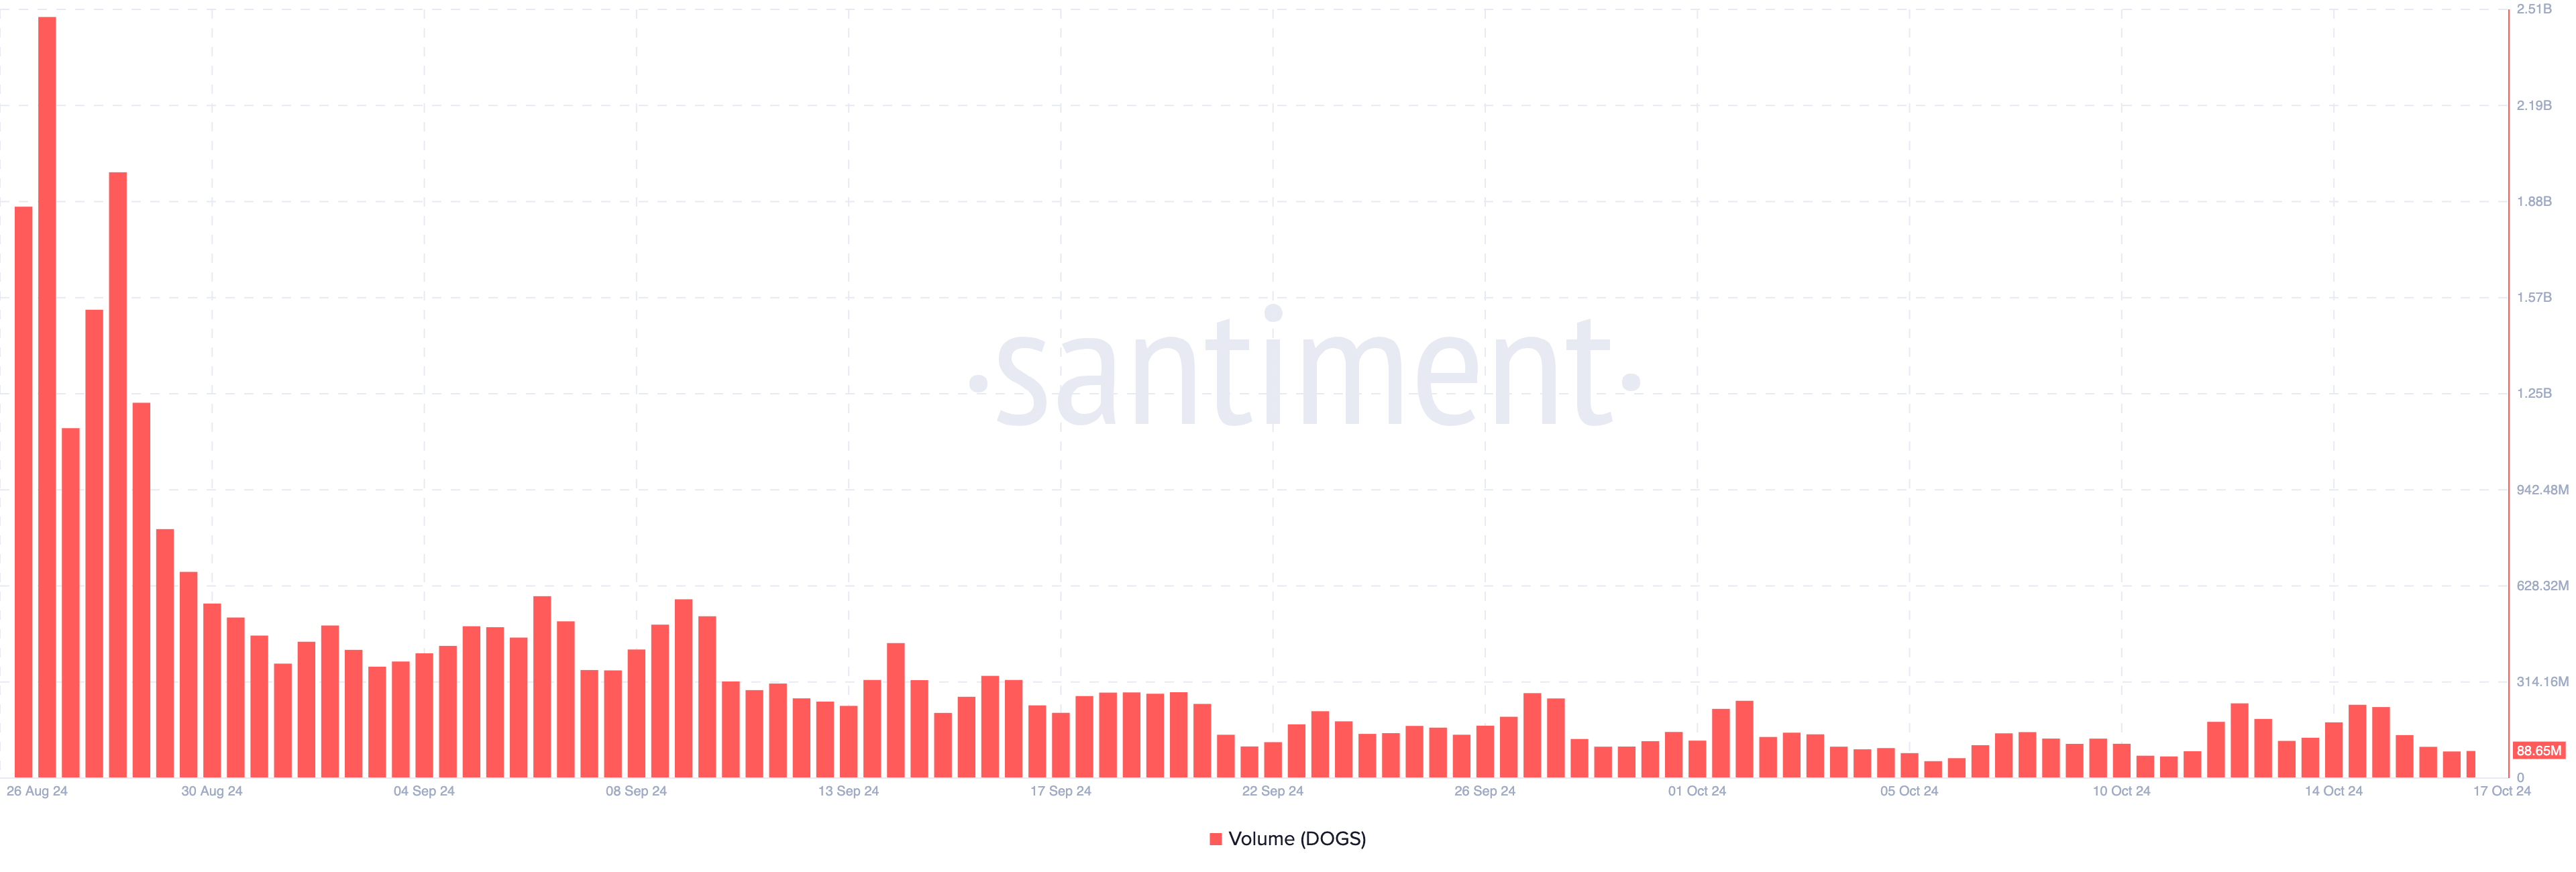
Another reason DOGS’ price could fall again is its volume. Around the time the meme coin launched, the volume was over $2 billion, indicating that the market was highly interested in it.
As of this writing, the token’s trading volume has dropped to $88.65 million, a significant decline from earlier levels. This drop in volume suggests reduced buying and selling activity, which may make it difficult for the meme coin to rebound from its current lows.
With lower market activity, price recovery could be a challenge as fewer traders are interacting with the token.
DOGS Price Prediction: Lower Lows
Based on the daily chart, the Bollinger Bands (BB) around DOGS have contracted. This suggests that volatility is currently low, and the price may remain range-bound without experiencing significant price swings.
When the bands expand, it typically indicates high volatility and the potential for more dramatic price movements. However, with the BB contracting, it seems the market is expecting stability or muted price action in the short term for DOGS.
Read more: Top 7 Telegram Tap-to-Earn Games to Play in 2024
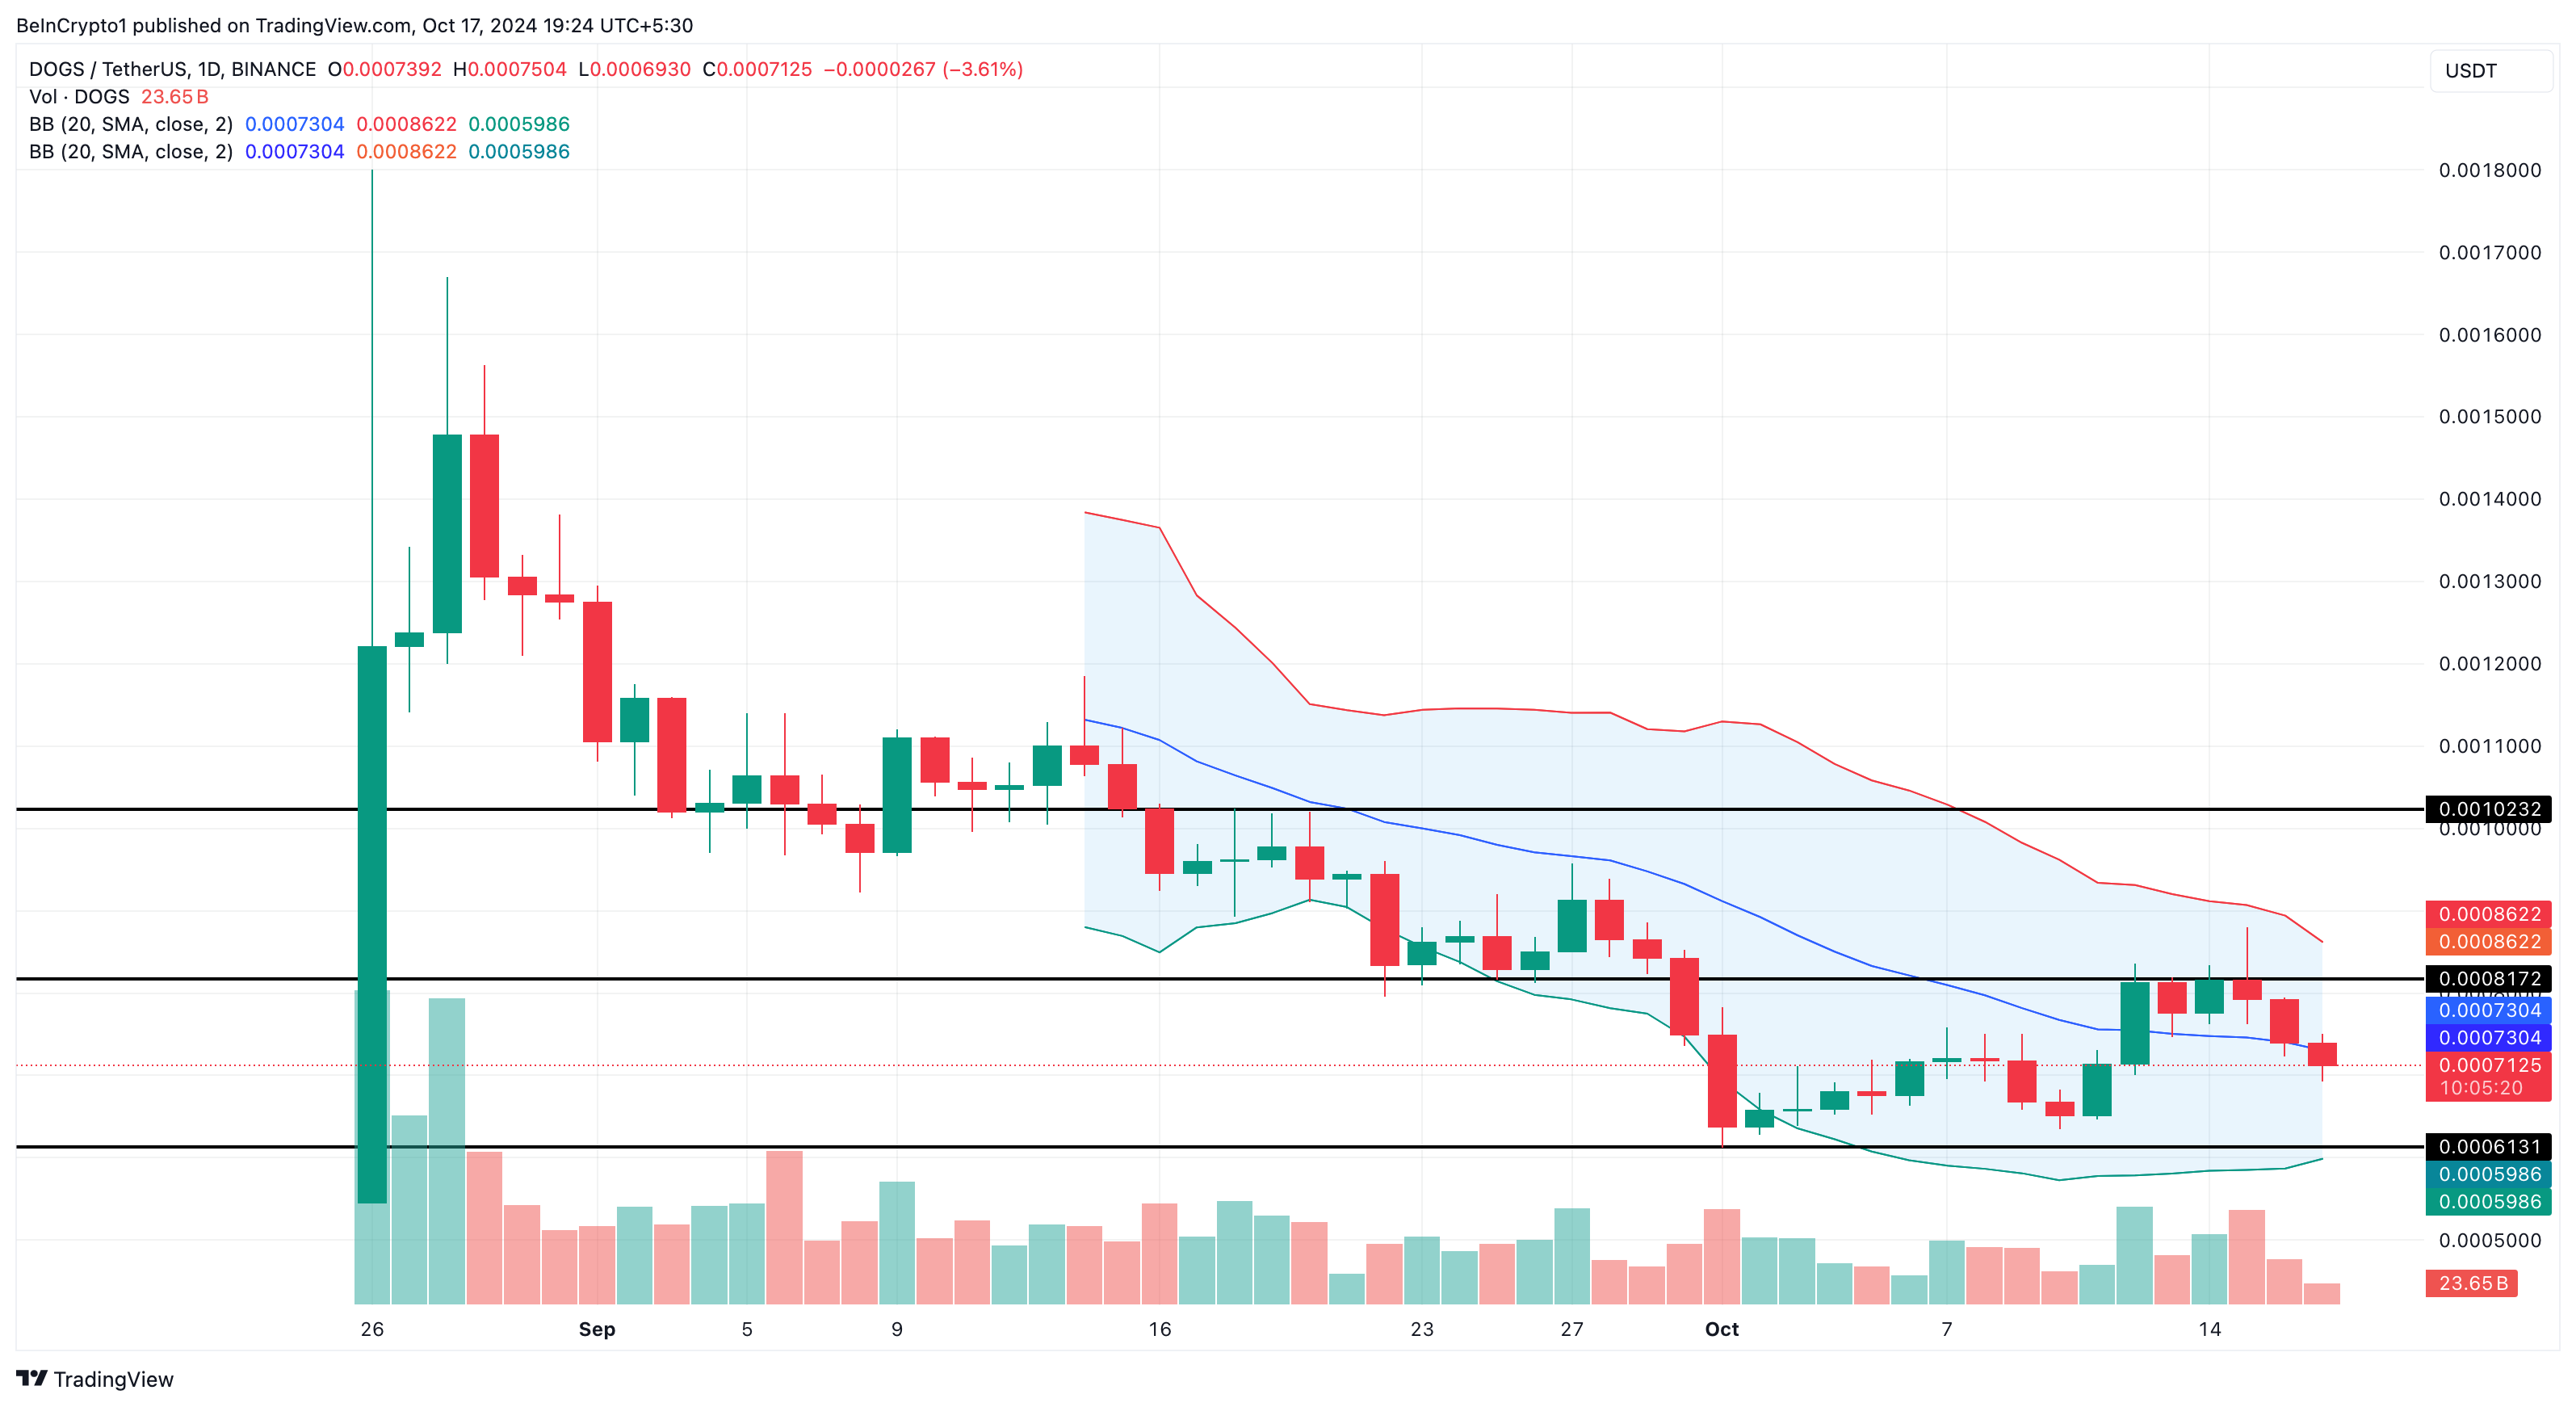
Considering DOGS’ current movement, the meme coin’s price is likely to drop below $0.00061. However, if investors step in and buy the dip in large volumes, the trend could reverse. In that scenario, the meme coin’s value might rise to $0.00081 or potentially even as high as $0.0010.
Disclaimer
In line with the Trust Project guidelines, this price analysis article is for informational purposes only and should not be considered financial or investment advice. BeInCrypto is committed to accurate, unbiased reporting, but market conditions are subject to change without notice. Always conduct your own research and consult with a professional before making any financial decisions. Please note that our Terms and Conditions, Privacy Policy, and Disclaimers have been updated.


As the crypto market enters Q2 2025, both investors and traders are anticipating a shift from bearish to bullish momentum. This change is essential for altcoins to recover, as many are currently facing challenges in bouncing back. However, growth potential remains for select tokens in the short term.
BeInCrypto has analyzed three altcoins to watch closely as April begins, highlighting the catalysts that could influence their price movements.
THORChain (RUNE)
RUNE’s price is currently at $1.117, hovering just above the $1.110 support level. For a potential rebound, the altcoin needs to reclaim $1.198 as support. Investor sentiment will play a crucial role in whether this upward movement materializes, leading to possible gains for THORChain (RUNE).
THORChain’s 3.4.0 upgrade is scheduled to take place this week, bringing significant improvements to the network. The upgrade could drive positive market sentiment, helping RUNE reclaim $1.198 as support. This momentum may push RUNE towards $1.396, aiding in recovering recent losses and supporting continued price growth.
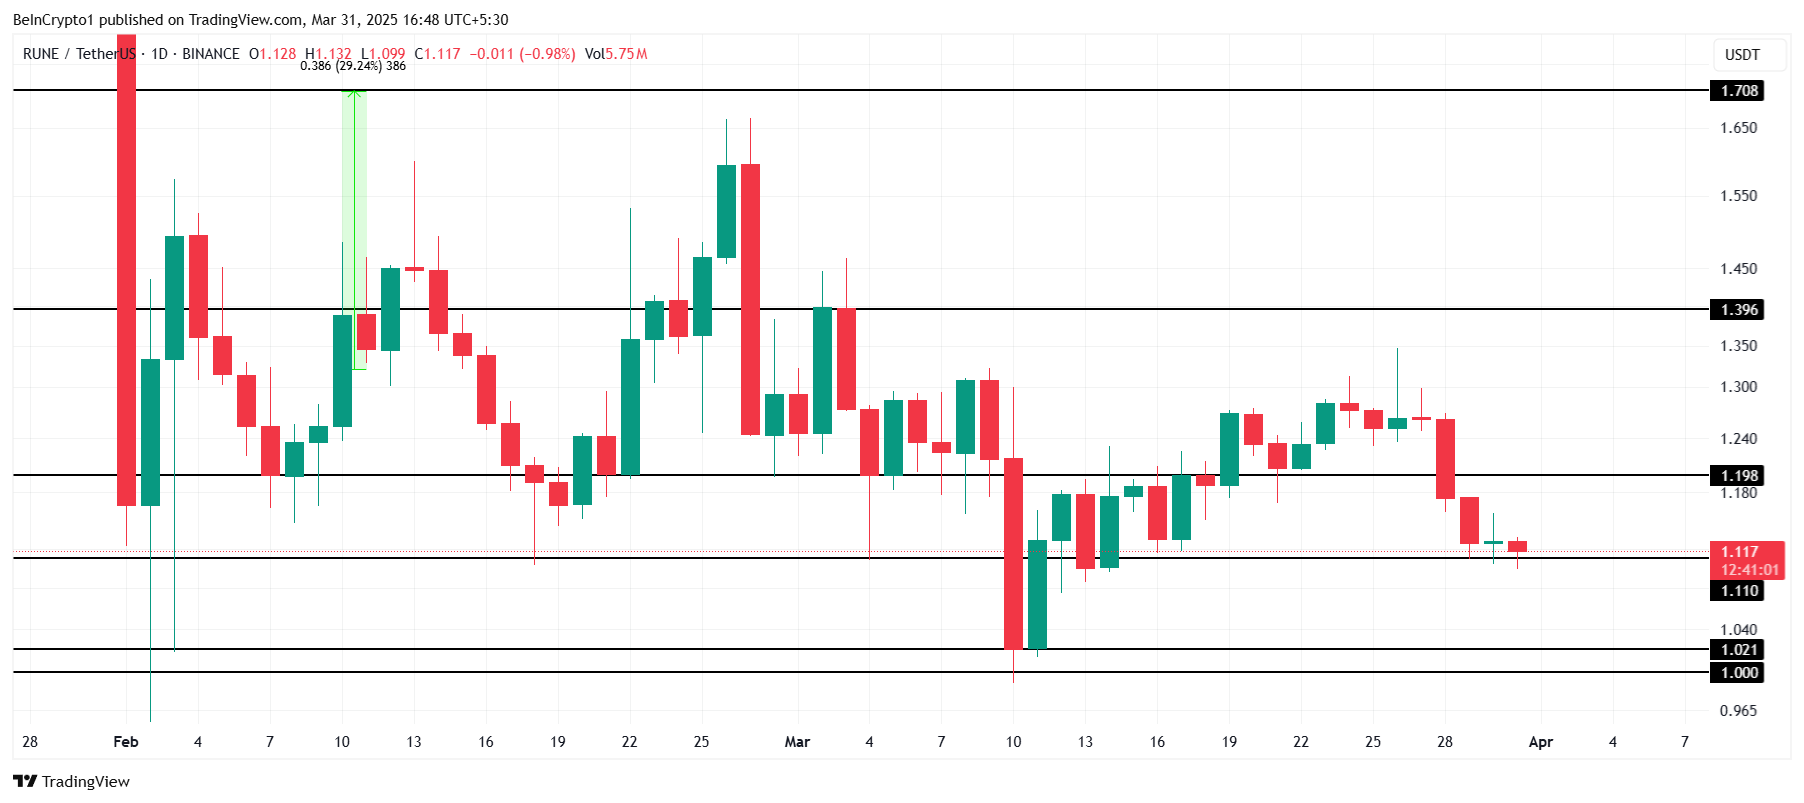
If the support at $1.110 is broken, RUNE may fall to $1.021, pushing it closer to losing the critical $1.000 level. A failure to maintain support could signal a bearish trend, invalidating the bullish outlook.
Artificial Superintelligence Alliance (FET)
FET price saw a 20% decline over the last five days, dropping to $0.452 after losing the support of $0.458. This decline puts the altcoin under pressure. However, the doors for potential recovery are open due to upcoming developments within the network.
The Artificial Superintelligence Alliance network is set for a mainnet upgrade this week, bringing new features to the ASI-1 Mini. This upgrade is expected to act as a catalyst for the price, pushing it toward the key resistance levels of $0.524 and $0.572 to recover recent losses.
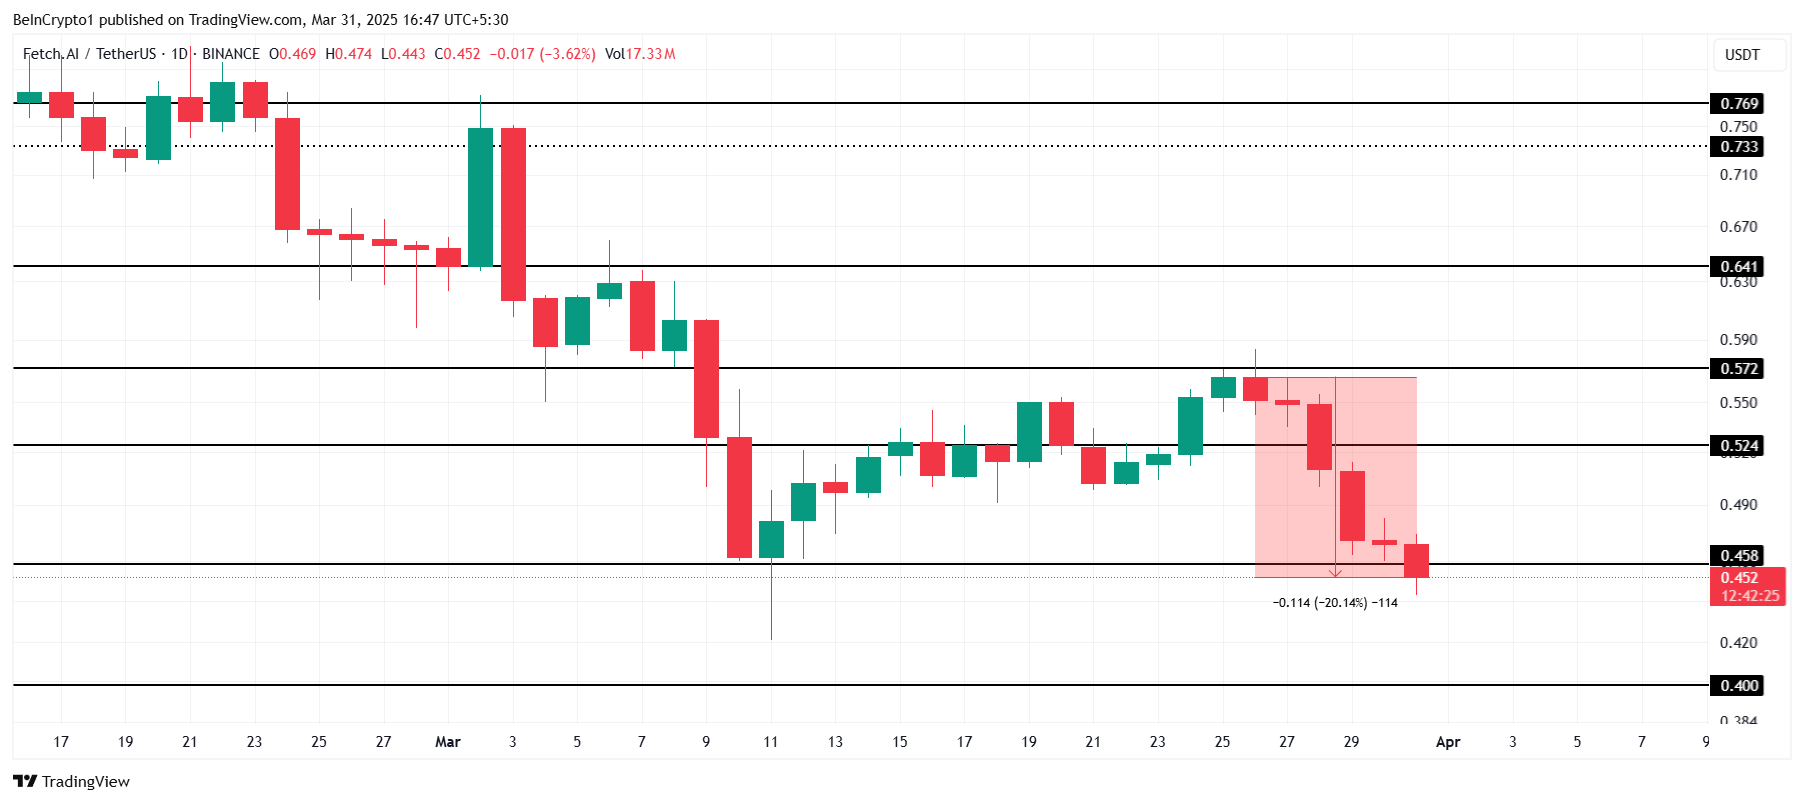
If the bearish trend continues, FET could fall further to $0.400, which would invalidate the bullish outlook and lead to extended losses. The price would need to hold above critical support levels to avoid deeper declines.
Ethereum (ETH)
Ethereum’s price is nearing a 17-month low of $1,745, following a 13.42% drop after failing to break through the $2,141 resistance. This recent price action suggests the altcoin king is struggling to regain momentum. The market conditions remain unfavorable for a quick recovery at this point.
Despite the current market downturn, Ethereum could see some recovery as investors look to capitalize on low prices. A short-term bounceback is possible if ETH successfully flips $1,862 into support, potentially pushing the price above $2,000. This would mark a significant recovery attempt from the recent drop.
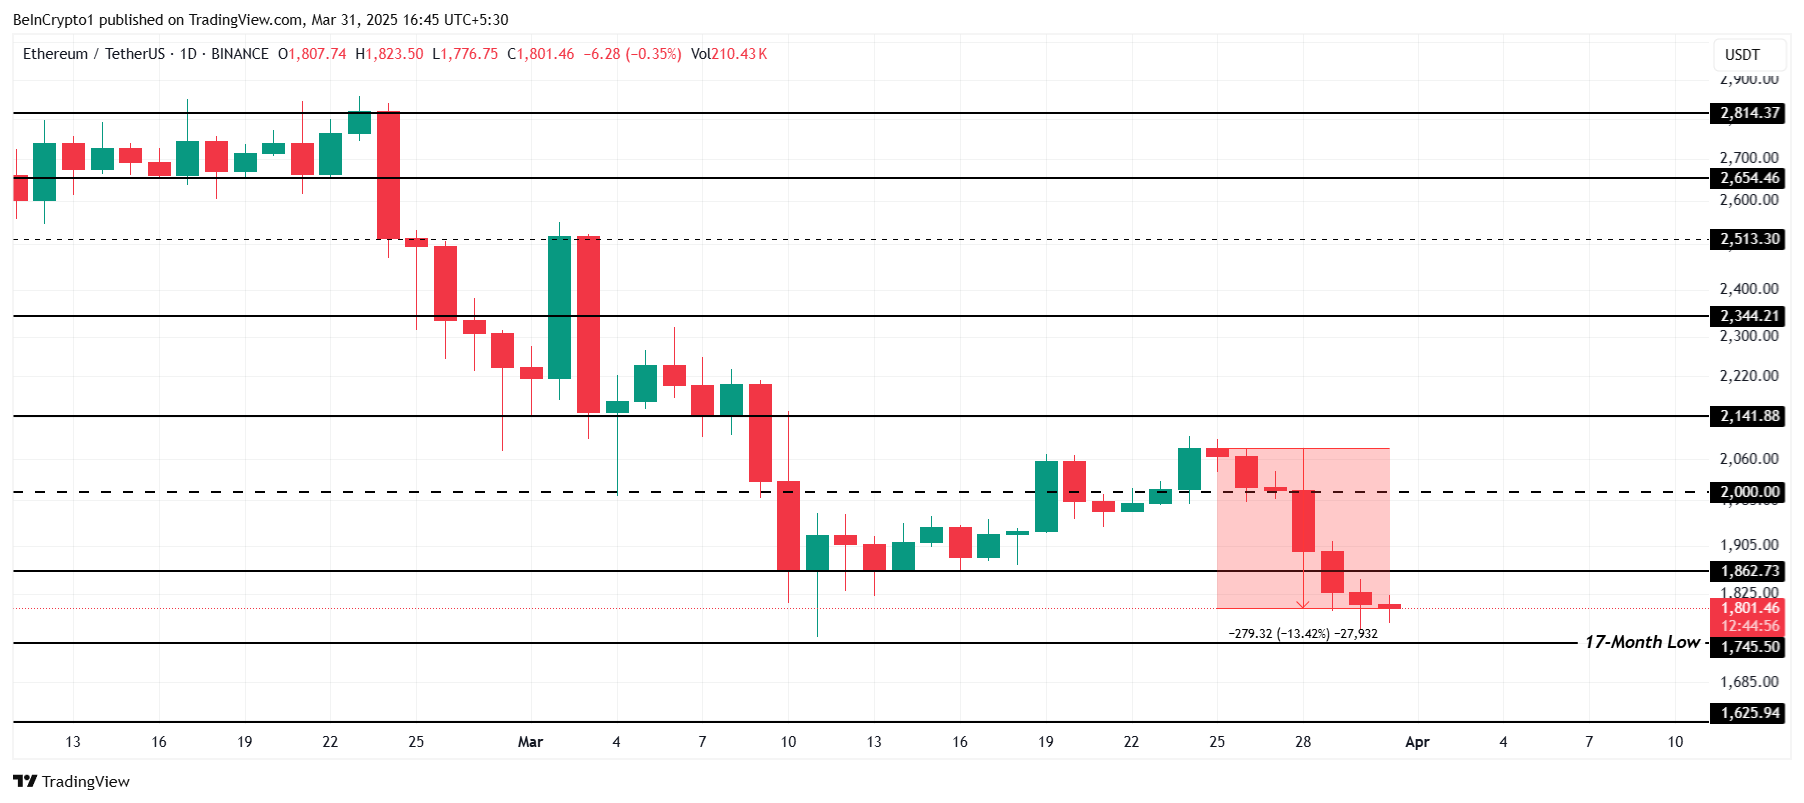
If bearish conditions continue, Ethereum’s price might fall below $1,745, testing the next support at $1,625. A failure to hold this level would invalidate the bullish outlook and open the door for further declines, extending the recent losses.
Disclaimer
In line with the Trust Project guidelines, this price analysis article is for informational purposes only and should not be considered financial or investment advice. BeInCrypto is committed to accurate, unbiased reporting, but market conditions are subject to change without notice. Always conduct your own research and consult with a professional before making any financial decisions. Please note that our Terms and Conditions, Privacy Policy, and Disclaimers have been updated.

As traders and investors anticipate the beginning of April and the onset of the second quarter (Q2) of 2025, crypto airdrops present an opportunity to join promising communities while they are still on the ground floor.
This week, three notable crypto airdrops stand out as worth watching.
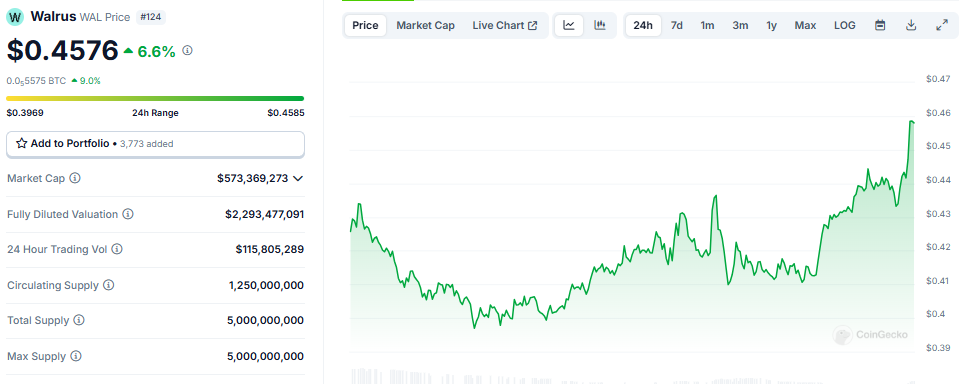
Walrus
Walrus (WAL), a decentralized storage protocol on the Sui blockchain, launched its mainnet and token generation event (TGE) on March 27. The event coincided with South Korea’s Upbit exchange listing WAL.
The TGE saw Walrus distribute 4% of its 5 billion token supply via an airdrop. Eligible participants, including early Sui ecosystem users and testnet contributors, received Soulbound NFTs redeemable for WAL tokens. As April commences, 6% of Walrus tokens are reserved for future community rewards.
“At the moment 4% of the 10% tokens allocated for the airdrop have been distributed, so Walrus still has tokens to reward users,” Cryptorank.io noted.
WAL powers storage payments, staking, and governance, with listings on exchanges like Crypto.com and MEXC offering prize pools. The project’s airdrop comes after raising $140 million from Andreessen Horowitz, Standard Crypto, Electric Capital, and Comma3 Ventures, among others.
Meanwhile, Walrus’s market cap exceeds $573 million, reflecting strong adoption potential. Data on CoinGecko shows it was trading for $0.45 as of this writing.
Staking opportunities with validators like Mysten Labs or Nansen enhance rewards, but high commissions (up to 60%) apply. One of Walrus and Sui’s founders recently announced that users could stake WAL tokens to get airdrops. As this could mean airdrops from Walrus and projects from the Sui ecosystem, engaging with Sui dApps and testnets remains key for future allocations.
Nansen
The project has raised up to $88.2 million from investors such as Andreessen Horowitz, Coinbase Ventures, Accel, and Mechanism Capital, among others. Coupled with the fundraiser, Nansen has a valuation of $750 million.
Nansen, a leading blockchain analytics platform, confirmed an airdrop, drawing excitement due to its prominence and past reward patterns. The project launched a staking program and announced a point system in 2025.
“We’re excited to announce that we have acquired Stakewithus (SWU)! SWU is a non-custodial staking service provider with $80m+ staked by 30k+ users & supports 20+ chains You can now analyze data, monitor your portfolio, and stake assets in one place with Nansen,” read the announcement.
Users can stake assets (STRK and TRX), and points are expected to be credited retrospectively. Nansen also mentions the NSG token, so participants will most likely receive an airdrop for points.
Market participants should monitor Nansen’s social channels and partnerships for updates, as airdrops typically reward active users or data contributors.
With no token launched yet, any potential airdrop might tie into a future native token, likely incentivizing early adopters or premium subscribers. Given Nansen’s influence in the crypto space, tracking wallet activity and on-chain data, its airdrop could attract significant attention.
Participants should engage with its tools and stake in supported ecosystems to position themselves for unannounced opportunities.
OG Labs
This modular AI chain combines Layer-1 blockchain with decentralized AI, focusing on scalable Data Availability for AI applications.
The status of OG Labs airdrop stands confirmed, bringing forth an emerging player in the crypto space. This makes it a speculative target for market participants. It boasts up to $325 million in funds raised from investors such as Delphi Ventures, Hack VC, Animoca Brands, and OKX Ventures, among others.
The airdrop is potentially tied to Web3 innovation or NFT ecosystems (given the “OG” moniker). It follows models like Walrus, rewarding early testers or community members.
“There are new activities on the OG test network – we can request test tokens and make swaps,” Cryptorank.io noted.
The OG Labs airdrop requires no investment. Users can engage through OG Labs’ Newton Testnet, which tests-core functionalities like decentralized storage, consensus, and data availability services. Participants must complete at least 20 transactions, stay active for three days, and interact with features like swaps, storage scans, and NFT minting.
“Interact with the OG Labs Testnet and Become Eligible for the Airdrop,” crypto researcher Guatamgg stated.
Additionally, users can boost eligibility by taking Discord roles such as OGurus or OG Role. These activities involve community contributions and verification steps. This airdrop targets active ecosystem participants, aligning with OG Labs’ emphasis on community-driven development.
Disclaimer
In adherence to the Trust Project guidelines, BeInCrypto is committed to unbiased, transparent reporting. This news article aims to provide accurate, timely information. However, readers are advised to verify facts independently and consult with a professional before making any decisions based on this content. Please note that our Terms and Conditions, Privacy Policy, and Disclaimers have been updated.

Energy infrastructure platform Hut 8 Corp has partnered with US President Donald Trump’s sons, Eric Trump and Donald Trump Jr., to launch American Bitcoin Corp.
The company is dedicated to industrial-scale Bitcoin mining and developing a strategic reserve.
All You Need to Know about American Bitcoin
American Bitcoin’s leadership team includes Mike Ho as executive chair, Matt Prusak as CEO, and Eric Trump as CSO. The Board of Directors comprises Mike Ho, Asher Genoot (also Hut 8 CEO), Justin Mateen, and Michael Broukhim.
According to the announcement, Hut 8 holds an 80% ownership stake in American Bitcoin. This follows the contribution of its ASIC miners to American Data Centers Inc., a company formed by investors including the Trump brothers.
Subsequently, they renamed and relaunched the entity as American Bitcoin. As a new subsidiary focused on industrial-scale Bitcoin mining, this move aims for an efficiency of 50+ EH/s (exahashes per second). Meanwhile, Hut 8 remains the key infrastructure partner, consolidating financials under its brand.
Eric Trump, co-founder and chief strategy officer of American Bitcoin, expressed enthusiasm about the collaboration. He also emphasized the synergy between Hut 8’s operational excellence and shared passion for decentralized finance (DeFi) as a foundation for significant future growth.
“…By combining Hut 8’s proven operational excellence in data centers with our shared passion for Bitcoin and decentralized finance, we are poised to strengthen our foundation and drive significant future growth,” an excerpt in the announcement read, citing Eric Trump.
Donald Trump Jr. highlighted their longstanding commitment to Bitcoin, noting their conviction in Bitcoin personally and through their businesses. He reiterated the opportunity presented by mining Bitcoin under favorable economics and the potential for investors to participate in Bitcoin’s growth through this new platform.
Similarly, Genoot described the launch of American Bitcoin as a pivotal evolution in their platform strategy. By establishing a standalone entity for mining operations, Hut 8 aims to align each business segment with its respective cost of capital. Specifically, they would create two focused yet complementary companies.
Meanwhile, this venture is part of the Trump family’s broader engagement in the crypto industry. World Liberty Financial, the crypto venture linked to the Trump family, recently launched USD1. US treasuries, dollars, and cash equivalents back the stablecoin. The venture aims to facilitate secure cross-border transactions for investors and institutions.
Furthermore, reports indicate that the Trump family is discussing acquiring a stake in Binance.US. This is the American arm of the world’s largest cryptocurrency exchange, Binance. Given the family’s growing involvement in the sector, such an investment could significantly influence the crypto market.
These initiatives reflect the Trump family’s commitment to positioning the US at the forefront of the crypto industry. It also aligns with President Donald Trump’s ambition to establish the US as a global leader in digital assets.
“While people are worrying about the daily price action, President Trump and Eric Trump are building the infrastructure to take crypto to the next level,” crypto investor Gordon noted.
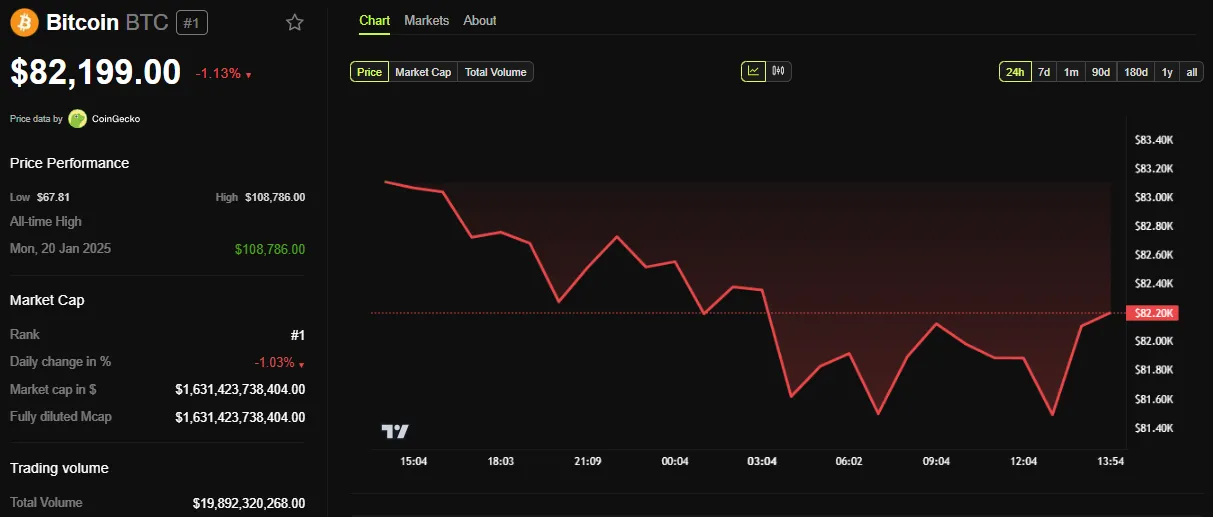
BeInCrypto data shows BTC was trading for $82,199 as of this writing. It is down by over 1.13% in the last 24 hours, unmoved by news of American Bitcoin. However, this could change once US markets open.
Disclaimer
In adherence to the Trust Project guidelines, BeInCrypto is committed to unbiased, transparent reporting. This news article aims to provide accurate, timely information. However, readers are advised to verify facts independently and consult with a professional before making any decisions based on this content. Please note that our Terms and Conditions, Privacy Policy, and Disclaimers have been updated.

3 Altcoins to Watch in the First Week of April 2025

BTC Price Rebound Likely as Long-Term Holders Reenter Market

Ethereum To $20K? Investor Says Real-World Adoption Is The Key
$33 Million Inflows Signal Market Bounce

Top Crypto Airdrops to Watch in the First Week of April
Strategic Move for Trump Family in Crypto

2.52 Million Altcoins Are Ruining Crypto’s Future

Animoca Brands Valuation Tanks 75% In Two Years, Here’s Why

Crypto exchange BingX hacked for $43 million

Are The Big Players Losing Interest?

Hong Kong’s Securities Association Tips Authorities On Crypto Self-Regulation

Coinbase cbBTC Set to go Live on Solana
2.52 Million Altcoins Are Ruining Crypto’s Future
Animoca Brands Valuation Tanks 75% In Two Years, Here’s Why
Crypto exchange BingX hacked for $43 million
Are The Big Players Losing Interest?
Hong Kong’s Securities Association Tips Authorities On Crypto Self-Regulation
Coinbase cbBTC Set to go Live on Solana
-
 Regulation21 hours ago
Japan Set To Classify Cryptocurrencies As Financial Products, Here’s All
-
 Market24 hours ago
3 Token Unlocks for April: Parcl, deBridge, Scroll
-

 Market21 hours ago
Top 3 Made in USA Coins to Watch This Week
-

 Market20 hours ago
Solana (SOL) Price Risks Dip Below $110 as Bears Gain Control