
Market
DOGE Spot Outflows Exceed $120 Million in April
Dogecoin holders have been withdrawing their funds from spot markets in April, with the leading meme coin facing mounting selling pressure.
The lack of new capital flowing into DOGE reflects a decline in investor confidence and adds downward pressure on the altcoin.
Sell-Off Worsens for DOGE as Outflows Outpace Inflows
Since the beginning of April, DOGE has seen a consistent stream of net outflows from its spot market, totaling over $120 million. Net inflows during the same period have been negligible, amounting to less than $5 million per Coinglass.

When an asset records spot outflows, more of its coins or tokens are being sold or withdrawn from the spot market than are being bought or deposited.
This indicates that DOGE investors are losing confidence and opting to liquidate their holdings due to increasingly bearish market conditions.
The persistent outflows from the meme coin over the past two weeks reflect the lack of new demand for the altcoin. If this trend continues, DOGE’s price could remain range-bound or face another decline cycle.
On the technical front, DOGE’s Relative Strength Index (RSI) has continued to trend downward on the daily chart, further confirming the bearish outlook.
At press time, this key momentum indicator, which measures an asset’s oversold and overbought market conditions, is below the 50-neutral line at 47.61.

When an asset’s RSI falls below the center line, bearish momentum strengthens. This suggests that DOGE selling pressure is beginning to outweigh buying interest, signaling a potential dip in the asset’s price.
DOGE Risks Retesting Yearly Lows
With the crypto market’s volatility heightened by Donald Trump’s ongoing trade wars and DOGE’s current struggles to attract fresh investment, the meme coin may test new lows in the near term. If selling pressure strengthens, DOGE could revisit its year-to-date low of $0.12.
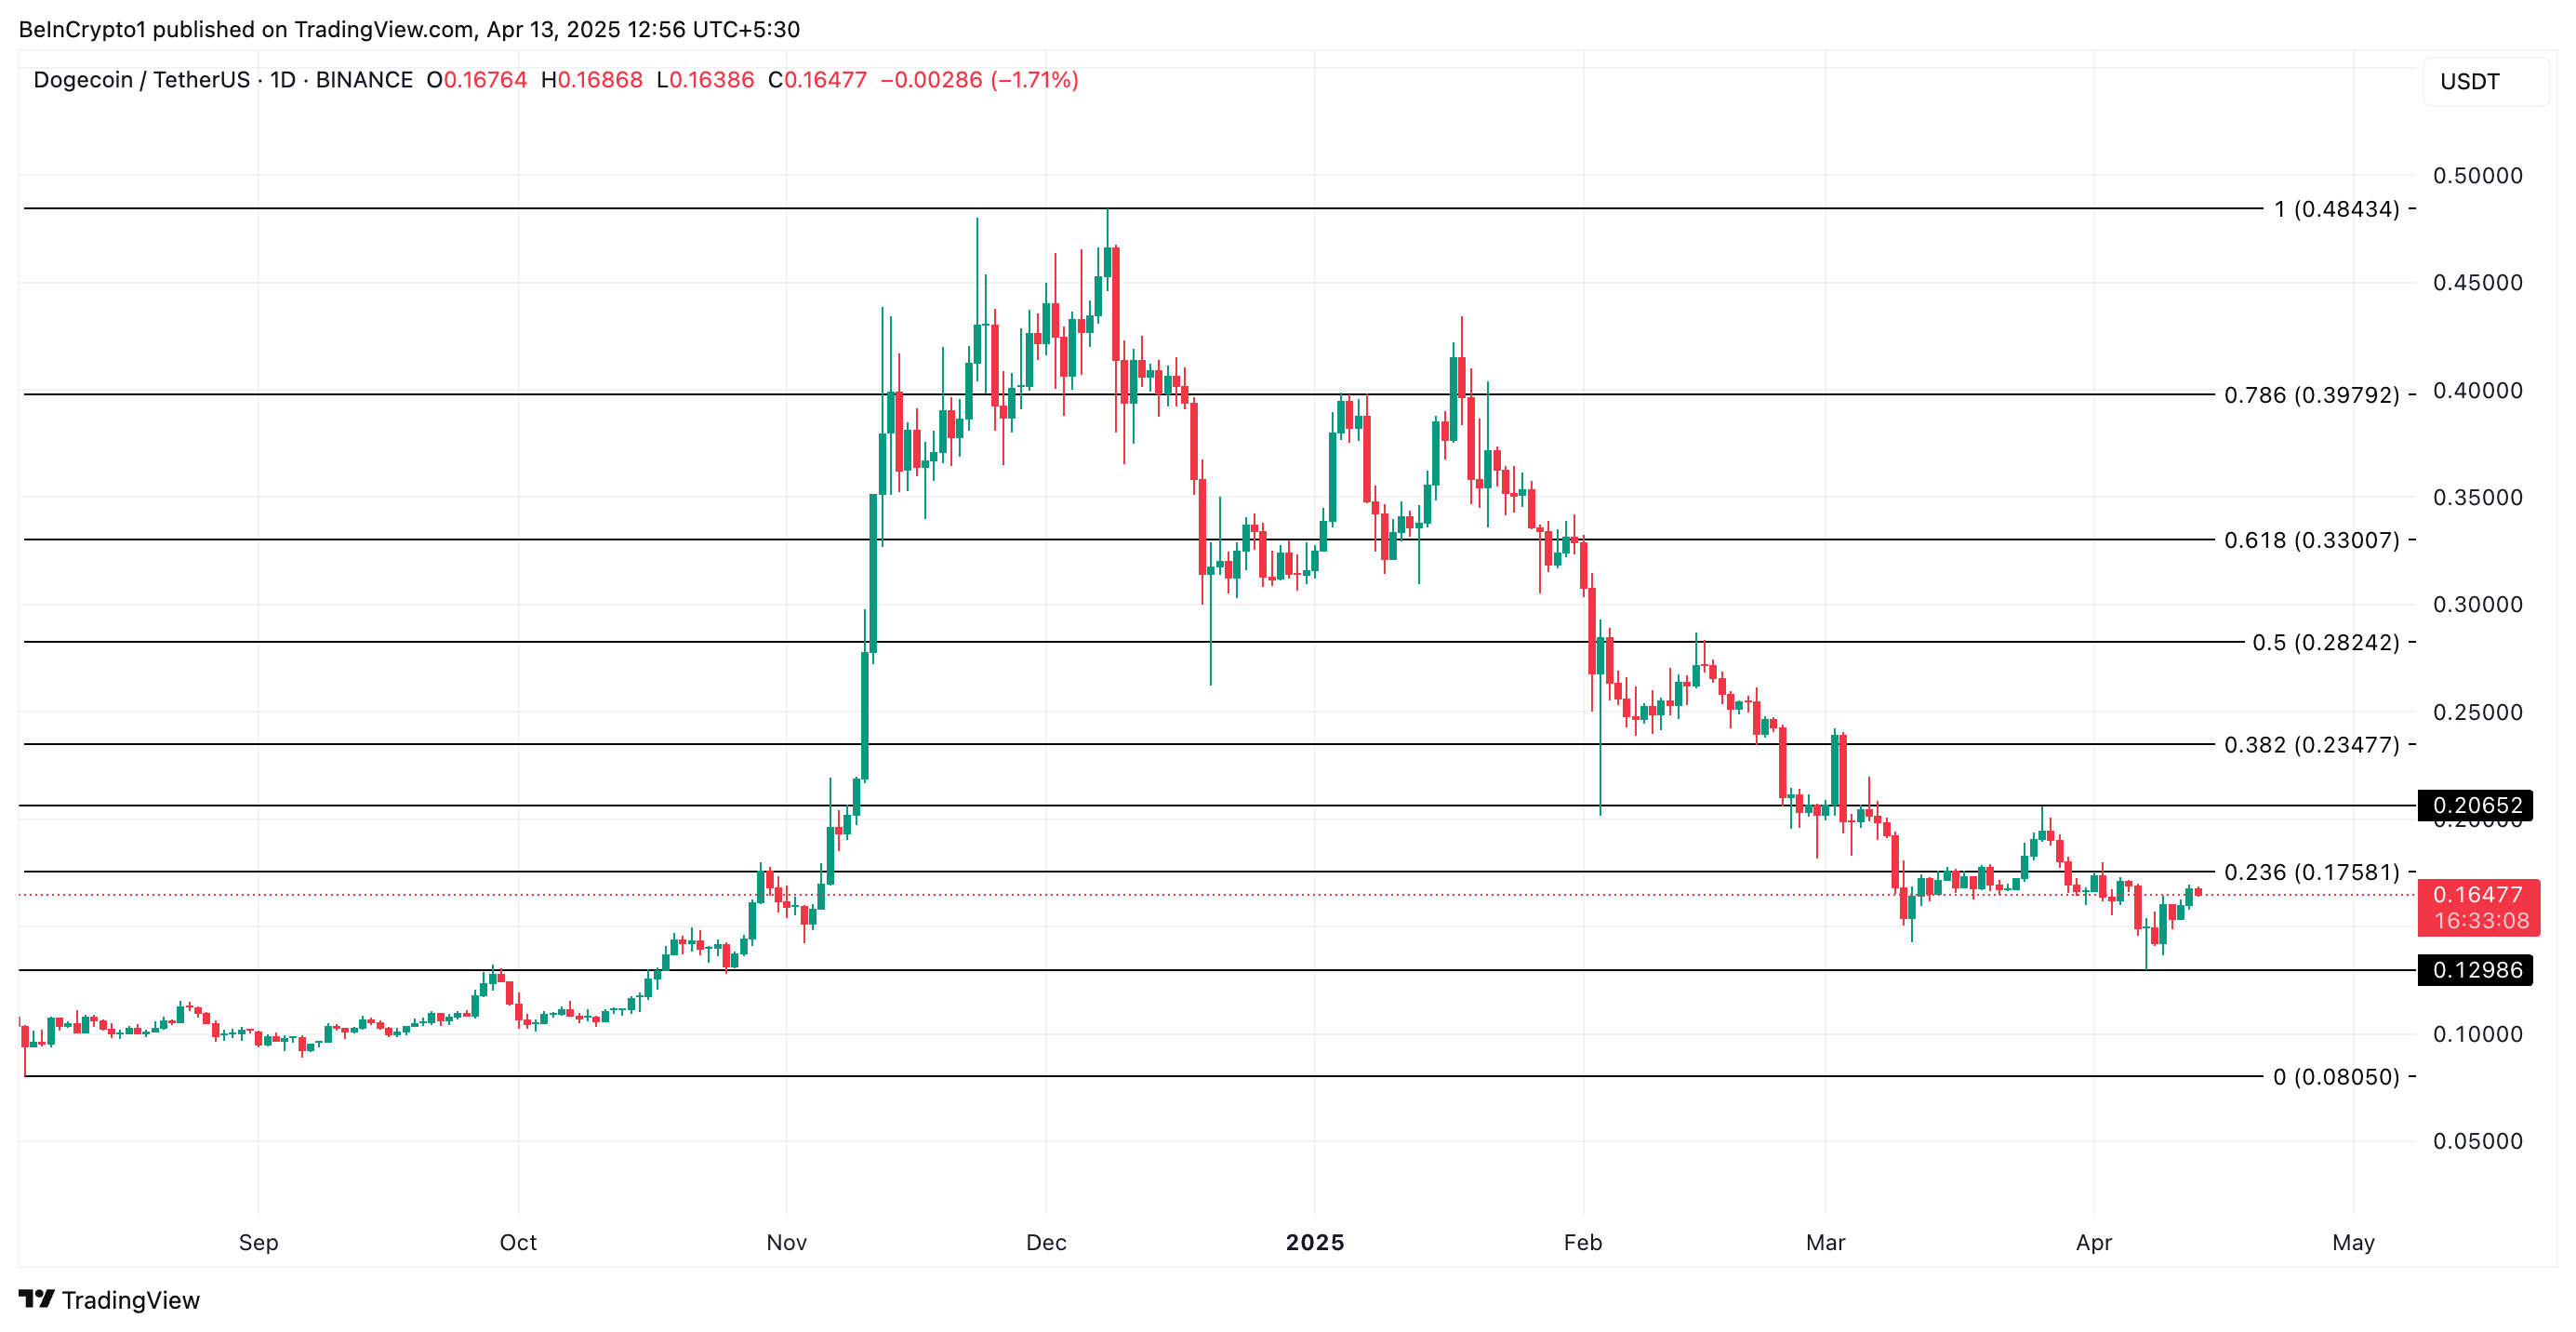
Conversely, a resurgence in new demand for the meme coin will invalidate this bearish outlook. In that scenario, DOGE’s price could break above $0.17 and climb to $0.20.
Disclaimer
In line with the Trust Project guidelines, this price analysis article is for informational purposes only and should not be considered financial or investment advice. BeInCrypto is committed to accurate, unbiased reporting, but market conditions are subject to change without notice. Always conduct your own research and consult with a professional before making any financial decisions. Please note that our Terms and Conditions, Privacy Policy, and Disclaimers have been updated.


KiloEx, a newly launched perpetual trading platform backed by YZi Labs (formerly Binance Labs), has suffered a cross-chain exploit resulting in the theft of approximately $7 million.
The attack, which began on April 14, is ongoing and has impacted operations across BNB Smart Chain, Base, and Taiko networks.
Hackers Drain $7 Million from KiloEx Using Tornado Cash
Cyvers analysts report that the attacker used a Tornado Cash-funded address to execute a series of coordinated transactions. It exploited potential access control flaws in KiloEx’s price oracle system.
On-chain evidence shows rapid fund movements between multiple chains. This raises concerns over systemic vulnerabilities in multi-chain DeFi architecture.
KiloEx launched its Token Generation Event (TGE) on March 27 in partnership with Binance Wallet and PancakeSwap. It’s currently listed on Binance Alpha.
“Root cause was a potential price oracle access control vulnerability. The attacker is still actively exploiting the system, and USDC may be subject to blacklisting,” wrote Cyvers.
The project was incubated by YZi Labs, an investment and innovation division previously branded as Binance Labs.
The launch attracted significant attention due to its backing and integration with BNB Smart Chain.
Following the attack, KiloEx has suspended its platform and is collaborating with security partners to investigate the breach and track stolen funds.
The team has announced plans to launch a bounty program to encourage white hat assistance and recover user assets.
The incident has triggered sharp market reactions. The KILO token plummeted by 30%, with its market capitalization dropping from $11 million to $7.5 million within hours of the attack.
Security teams are actively monitoring the attacker’s wallet addresses. The situation remains fluid as remediation efforts continue and the vulnerability is further assessed.
Disclaimer
In adherence to the Trust Project guidelines, BeInCrypto is committed to unbiased, transparent reporting. This news article aims to provide accurate, timely information. However, readers are advised to verify facts independently and consult with a professional before making any decisions based on this content. Please note that our Terms and Conditions, Privacy Policy, and Disclaimers have been updated.

Yesterday, MANTRA (OM) suffered a staggering 90% crash, and it’s still spiraling down today. Most notably, OM charts and indicators seem as bad as the 2022 Terra LUNA collapse, if not worse.
OM’s RSI is hovering near extreme oversold levels, and indicators reflect there’s barely any buying activity. When LUNA collapsed, a large number of traders bought the crash for a short-term pump. But, even this seems unlikely for MANTRA, based on current charts.
OM RSI Reached Levels Below 10
After crashing more than 90% in a matter of hours, some traders may be eyeing MANTRA’s OM token as a potential “buy the crash” opportunity.
However, the Relative Strength Index (RSI) tells a different story—OM’s RSI plummeted from 45 to 4 during the collapse and has only slightly recovered to 10.85.
The RSI is a momentum indicator that measures the speed and magnitude of price changes on a scale from 0 to 100. Typically, values below 30 indicate oversold conditions, while levels above 70 suggest the asset is overbought.
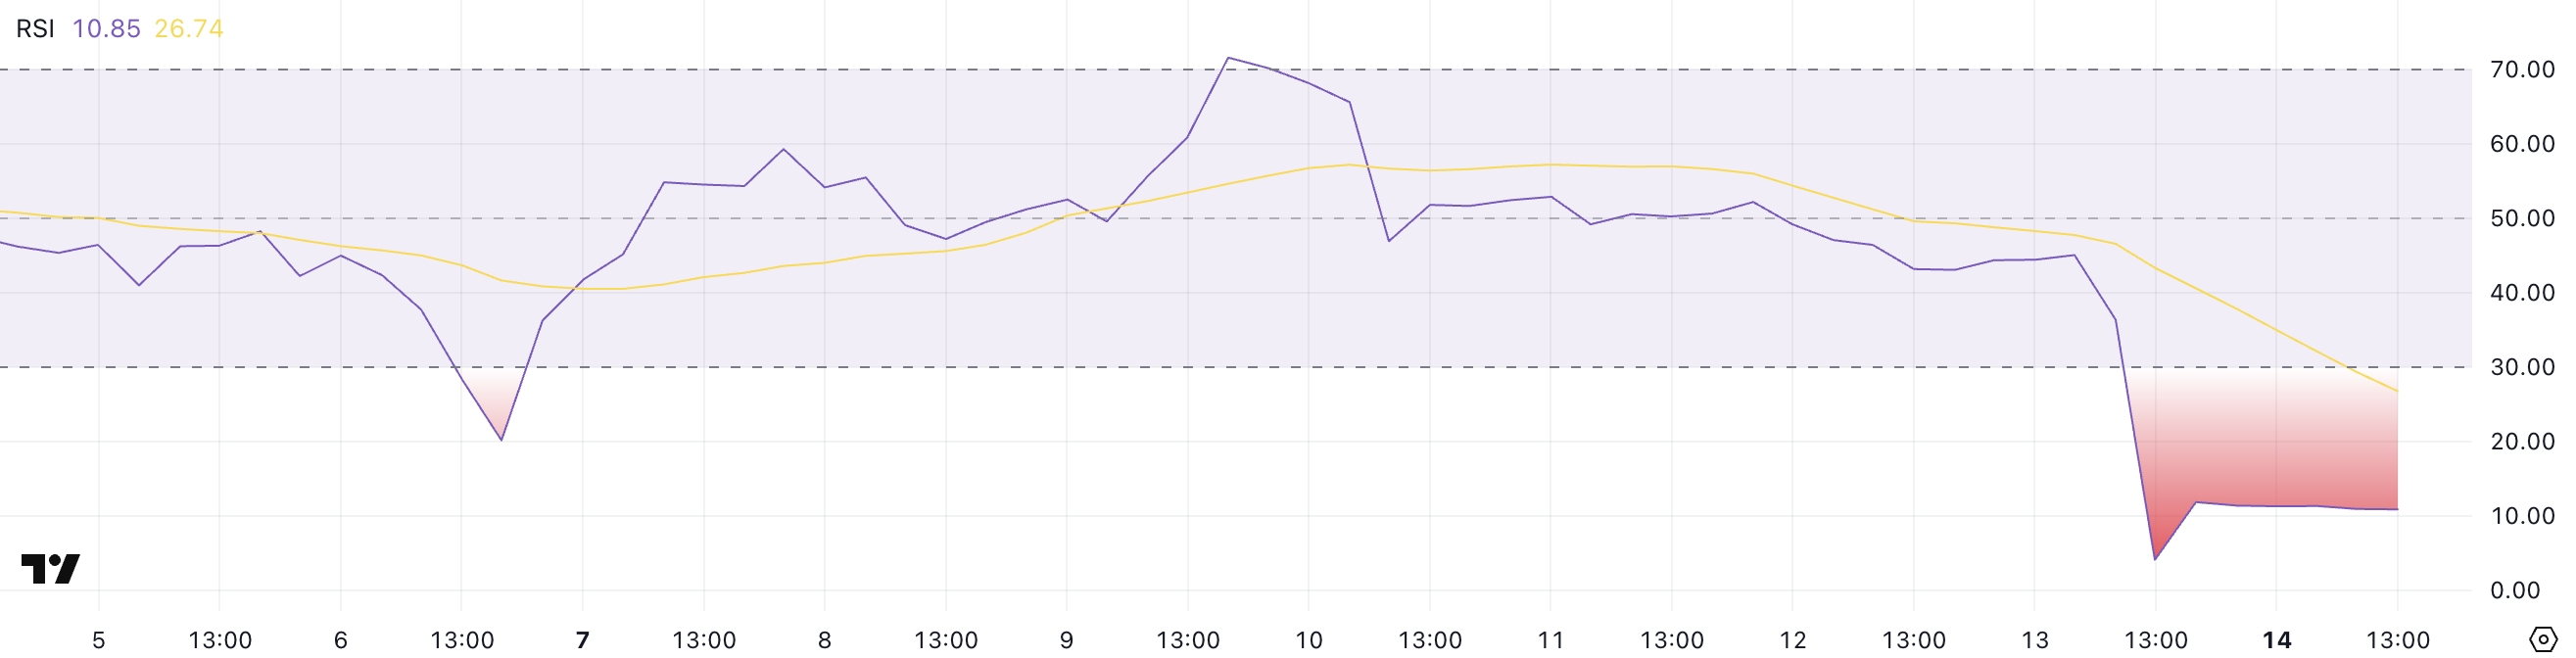
Despite bouncing from extreme lows, OM’s RSI has hovered around 10.85 for several hours, signaling that very few buyers are stepping in to support the price.
This lack of follow-through buying pressure shows that sentiment remains heavily bearish, and traders are not yet confident enough to accumulate the token—even at these steeply discounted levels.
Recently, talking to BeInCrypto, analysts warned about Mantra’s potential lack of true on-chain value.
OM is potentially setting up for further downside or a prolonged period of stagnation as the market waits for a catalyst or clearer recovery signals.
Mantra DMI Shows Buying Activity Is Almost Non-existent
Mantra’s DMI (Directional Movement Index) chart clearly shows intense bearish momentum. The ADX, which measures the strength of a trend regardless of direction, is currently at 47.23—well above the 25 threshold and showing no signs of weakening.
The -DI, which tracks selling pressure, has decreased from its peak of 85.29 to 69.69, indicating that while the panic sell-off may be slowing, it remains dominant.
Meanwhile, the +DI, which measures buying pressure, has dropped from 3.12 to just 2.42, highlighting a complete lack of bullish response to the collapse.

This imbalance reveals that although the worst of the immediate selling may be over, virtually no meaningful buying activity is stepping in to support OM’s price.
The fact that +DI remains extremely low suggests traders are still avoiding the token, hesitant to buy even after a massive discount.
As long as this dynamic continues—strong trend strength, high selling pressure, and near-zero buying pressure—OM is likely to stay under severe bearish pressure, with any recovery attempt extremely unlikely unless sentiment shifts dramatically.
Disclaimer
In line with the Trust Project guidelines, this price analysis article is for informational purposes only and should not be considered financial or investment advice. BeInCrypto is committed to accurate, unbiased reporting, but market conditions are subject to change without notice. Always conduct your own research and consult with a professional before making any financial decisions. Please note that our Terms and Conditions, Privacy Policy, and Disclaimers have been updated.
Reason to trust
![]()
Strict editorial policy that focuses on accuracy, relevance, and impartiality
Created by industry experts and meticulously reviewed
The highest standards in reporting and publishing
Strict editorial policy that focuses on accuracy, relevance, and impartiality
Morbi pretium leo et nisl aliquam mollis. Quisque arcu lorem, ultricies quis pellentesque nec, ullamcorper eu odio.
A crypto analyst has presented a compelling case, suggesting that the XRP price may be closely mirroring Bitcoin’s historical macro action. By comparing its multi-year chart patterns and market behaviour, the analyst argues that XRP may be gearing up for a significant price rally to $71 and beyond.
XRP Price Traces Bitcoin Path To Reach $71
TradingView crypto analyst RizeSenpai has forecasted that XRP could surge explosively to $71. At its current market price, this would represent a staggering 3,281% increase.
Related Reading
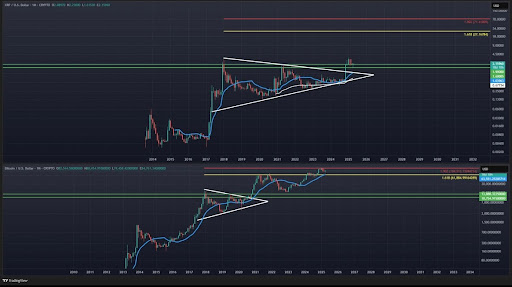
The TradingView expert conducted a detailed comparative analysis, drawing striking similarities between Bitcoin’s breakout from its multi-year accumulation range in 2015-2017 and XRP’s current price structure. He points out that XRP’s movements since it was listed on Poloniex in 2014 have closely mirrored Bitcoin’s macro price action but at a slower rate, estimated at 65%.
For emphasis, the price chart shows that Bitcoin experienced a sharp surge of 5,424% after consolidating between 2013 and 2016 and finally breaking out in 2017. Similarly, XRP had a big rise in 2017 but has since been stuck trading within a large multi-year range for nearly six years as of the end of 2022.
Recently, XRP broke out of its long-term price range and has been consolidating above its old all-time high resistance for several months. Considering its current price action, the analyst assumes that the asset may be attempting to move toward new breakout levels.
The TradingView analyst has highlighted the potential for XRP to surge toward a more realistic target of $27 – $30, near the 1.618 Fibonacci Extension level. For reference, he shared a chart comparing Bitcoin’s past bull market breakout and performance with XRP’s current breakout and future price action.
The chart reveals that when BTC broke out, it surged toward the 1.618 Fibonacci level at $61,800 before initiating a secondary run that topped at the 1.902 HOP level. As a result, RizeSenpai predicts that if XRP can completely mirror Bitcoin’s performance, it could skyrocket to $27, potentially reaching as high as $71, where the 1.902 HOP level lies.
The Token To Surge Above $71 To $120
As mentioned earlier, XRP is still trading within a multi-year range breakout similar to Bitcoin’s in its past cycle. As of writing, XRP’s price sits at $2.13, having declined by more than 11% over the last month.
Related Reading
Notably, if the altcoin replicates the breakout momentum previously seen in Bitcoin, RizeSenpai predicts an explosive 5,400% increase, pushing its price to a very ambitious target of $120.94. This suggests that the TradingView analyst believes that XRP could exceed its previously projected target of $71 and climb past $120.
Adding to the weight of this bullish forecast is the presence of a monthly Moving Average Convergence Divergence (MACD) Hidden Bullish Divergence. This technical indicator is often associated with an uptrend continuation and potential upside momentum.
Featured image from Adobe Stock, chart from Tradingview.com

$7 Million Hack Hits Binance-Backed Project

MANTRA (OM) Charts Look Worse than LUNA – No Buying Activity

Is The XRP Price Mirroring Bitcoin’s Macro Action? Analyst Maps Out How It Could Get To $71
Ondo Finance (ONDO) Rises 3.5% Following MANTRA Crash

Binance Futures Causes a Brief Crash For Story (IP) and ACT

XRP Jumps 22% in 7 Days as Bullish Momentum Builds

2.52 Million Altcoins Are Ruining Crypto’s Future

Animoca Brands Valuation Tanks 75% In Two Years, Here’s Why

Crypto exchange BingX hacked for $43 million

Are The Big Players Losing Interest?

Hong Kong’s Securities Association Tips Authorities On Crypto Self-Regulation

Coinbase cbBTC Set to go Live on Solana
2.52 Million Altcoins Are Ruining Crypto’s Future
Animoca Brands Valuation Tanks 75% In Two Years, Here’s Why
Crypto exchange BingX hacked for $43 million
Are The Big Players Losing Interest?
Hong Kong’s Securities Association Tips Authorities On Crypto Self-Regulation
Coinbase cbBTC Set to go Live on Solana
-

 Altcoin18 hours ago
Binance Breaks Silence Amid Mantra (OM) 90% Price Crash
-
 Altcoin15 hours ago
XRP Price Climbs Again, Will XRP Still Face a Death Cross?
-

 Market20 hours ago
Bitcoin’s Price Under $85,000 Brings HODlers Profit To 2-Year Low
-
 Altcoin14 hours ago
Analyst Predicts Dogecoin Price Rally To $0.29 If This Level Holds
-

 Market17 hours ago
XRP Outflows Cross $300 Million In April, Why The Price Could Crash Further
-

 Market16 hours ago
FLR Token Hits Weekly High, Outperforms Major Coins
-

 Bitcoin15 hours ago
Crypto Outflows Hit $795 Million On Trump’s Tariffs & Market Fear
-

 Market15 hours ago
Auto.fun Launchpad Set to Debut Amid Fierce Market Rivalry