
Market
Cryptos Dip Further on China’s Retaliatory Tariffs


- Cryptos fell further early Tuesday after China announced retaliatory tariffs on select US imports.
- Meanwhile, US Bitcoin spot ETFs recorded $234.40Mn outflows yesterday.
Cryptocurrency prices have taken another hit as retaliatory tariffs, announced by China, further dampen sentiments.
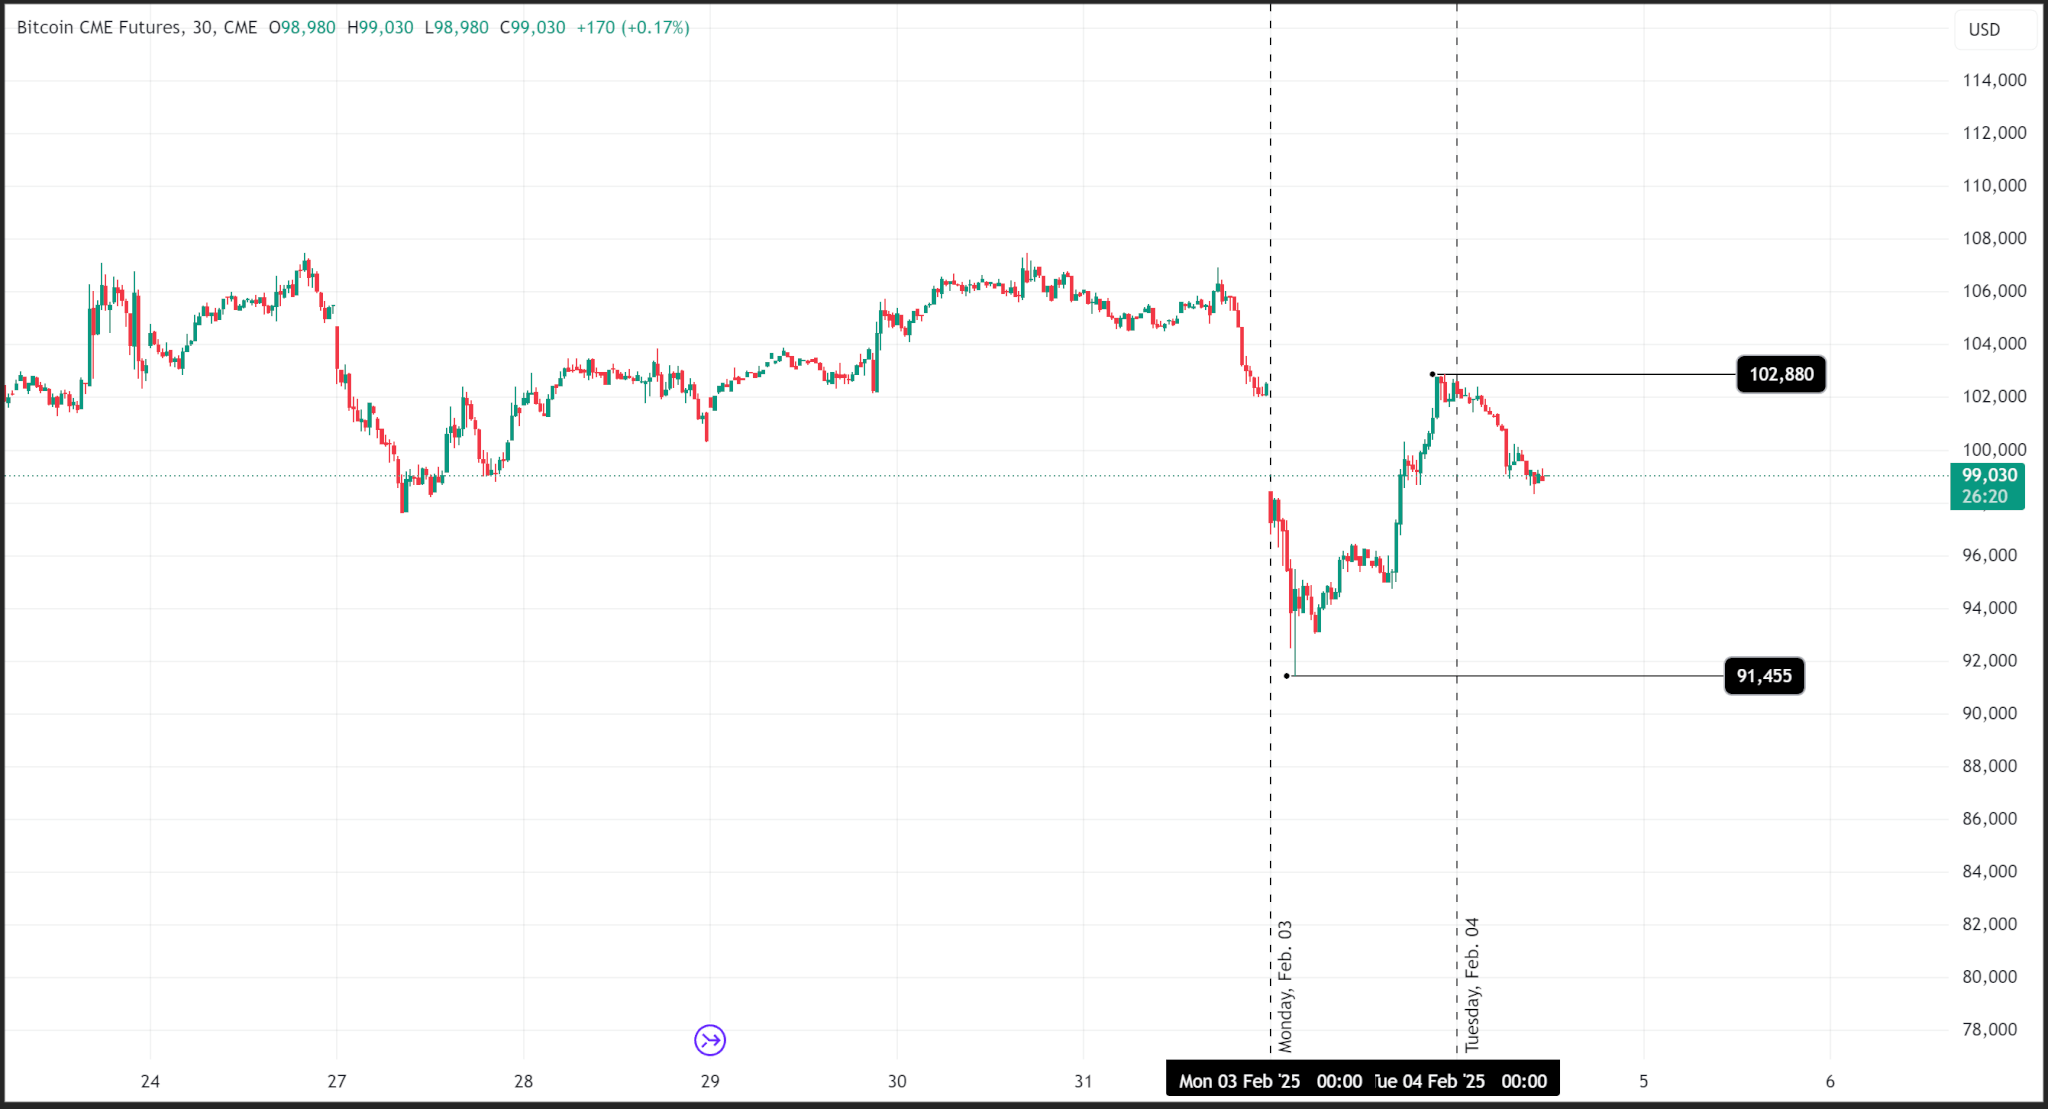
Bitcoin’s price, which showed some resilience in Monday’s trading session, opened the week at $98,465 at the CME and fell to a daily low of $91,455 during the Asian trading session.
Liquidations worth roughly $2.2 billion rocked the market as major alts logged double-digit losses.
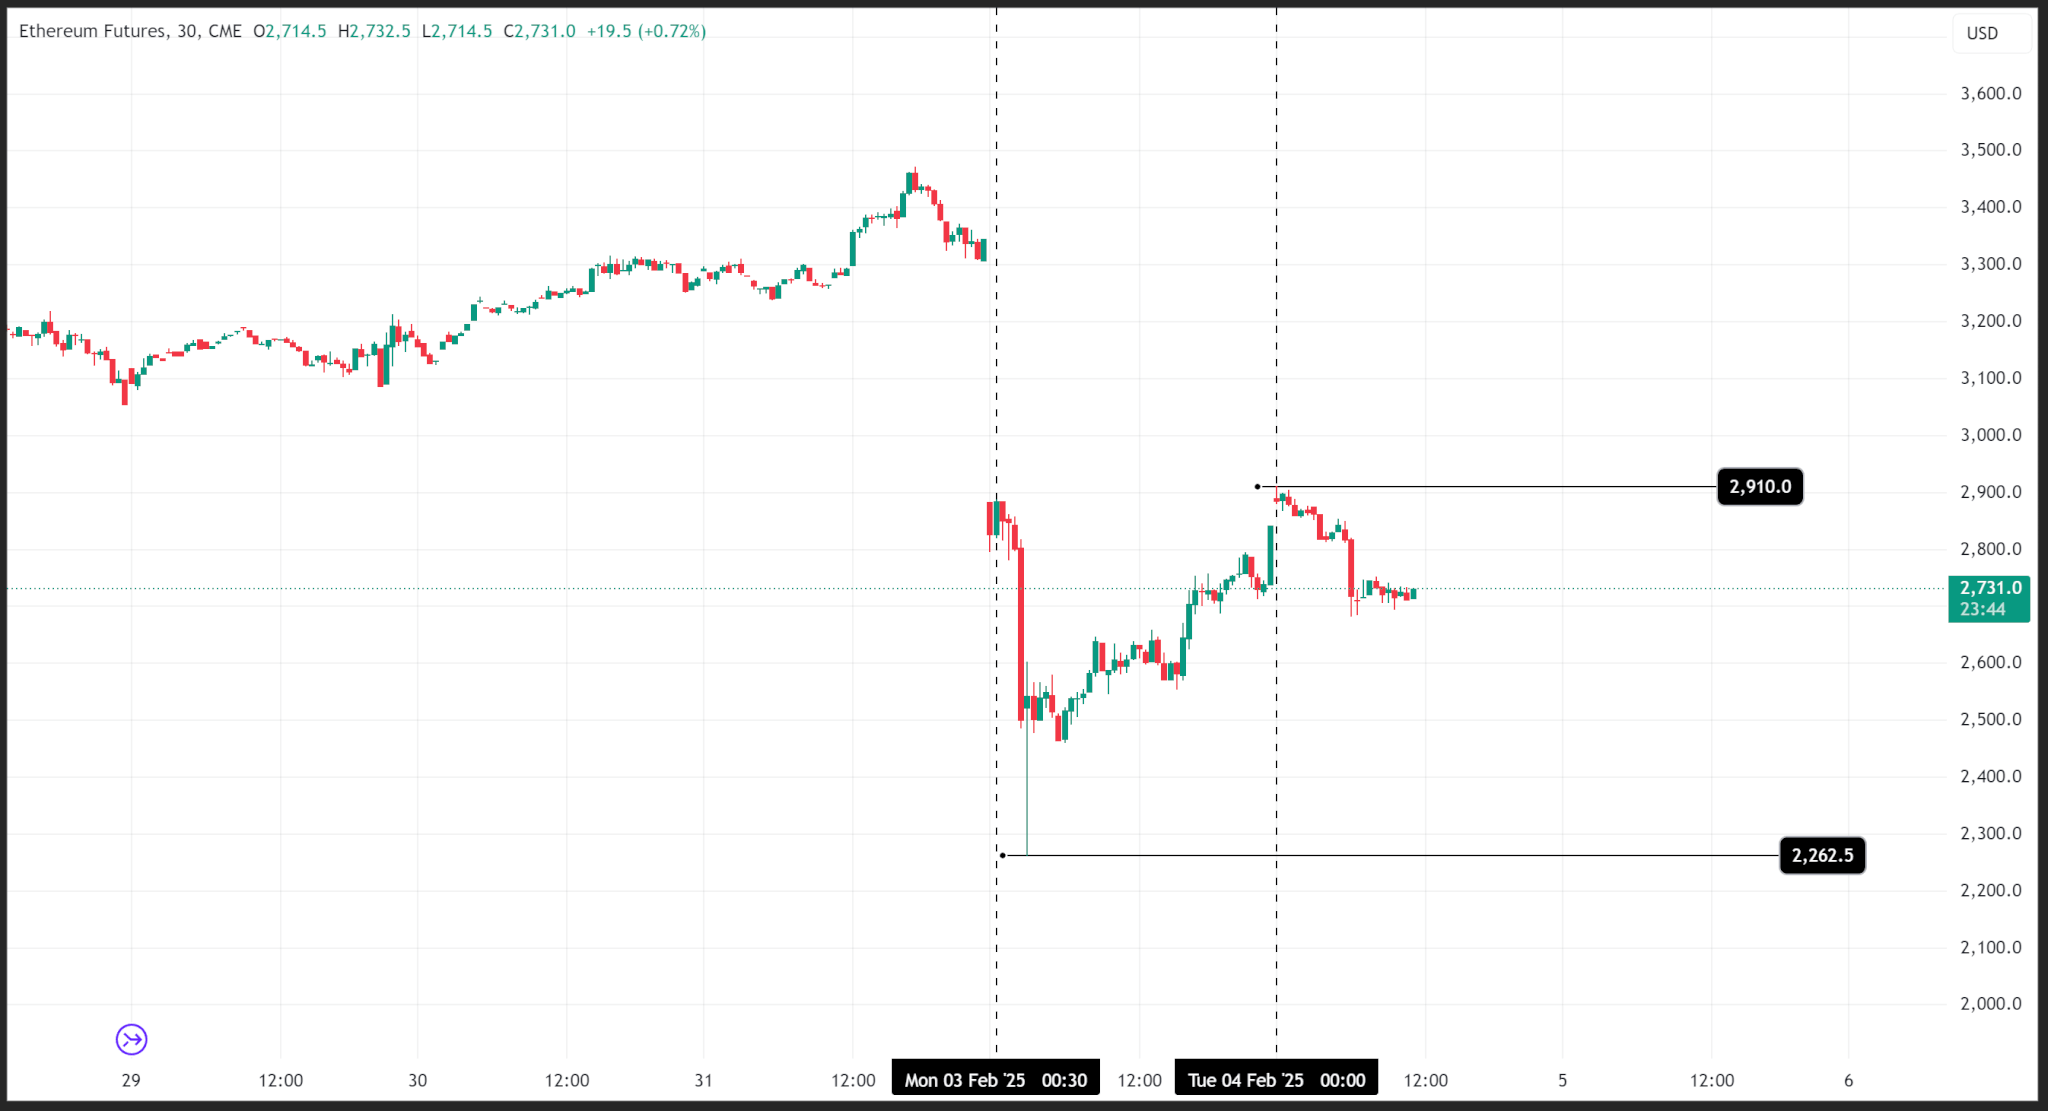
Bitcoin’s price began to recover over the London and NY sessions, breaking above $100,000 to a daily high of $102,880. Major alts like Ethereum also parred losses as it rose to $2,910 from a daily low of $2,262.
However, during the early hours of Tuesday, Beijing announced a 15% tariff on coal and other energy imports from the US and a 10% tariff on oil and agricultural equipment, further dousing sentiments.
Bitcoin is down 3.65% at $99,125 while Ethereum is 5.86% lower at $2,730 as of publishing.


On the opening day of the 2025 edition of the Paris Blockchain Week, BeInCrypto had the opportunity to interview Omri Ross, Chief Blockchain Officer for eToro. He revealed that despite the current market condition, the firm’s upcoming IPO is still in the pipeline.
We discussed how the company positions itself in the crypto exchange market and how it tackles the security question for its users.
Omri Ross Sheds Light on the Positioning of eToro
eToro has been, for many years, a very innovative player in this market. All areas around are following and creating a social network for trading.
There is the idea that people would like to copy-trade each other and be happy to share information about their portfolios. I think the way, for example, that our popular investors are working together with the community is absolutely fascinating.
I remember, for example, my discussion at some of our client events; we see a lot of the investors are actually being in contact with people who follow them. There is much less distance. There is much more discussion about why they follow specific portfolios.
And eToro also helps with this element. eToro actually creates events where popular investors and customers meet each other. As a platform, we also have an educational element with the eToro Academy. We also do some podcasts together with them. I think this is really innovative and awesome.
In terms of products, you know, our CEO has always been very pro-crypto. We have had Bitcoin trading available at eToro since 2013, so it is fairly early. And for me, it’s always been a pleasure to be in a place where you want to kind of push the funds; you want to bring to, in a regulated way, as many products as possible.
You know, customer protection and personal protection, but we are also trying to see how we can expose our customers to new products and innovations. And I think that that’s pretty unique, and we’re very proud of that.
How many Cryptos are Trading on eToro Right now?
We have more than 100 at the moment, with most of the big ones. However, we still don’t have so many stablecoins, but this is because we sort of see ourselves as a financial institution. We are looking into extending it and looking for ways to sort of allow our customers to reach more elements.
We also have an experimental area where you can experiment with more assets that may not necessarily be mature enough to be without the disclaimers. A big element for us is really how to communicate. On the one hand, we offer a lot of opportunities, but we are also trying to have people explore and understand what they investigate and work closely with regulators.
Is Copy Trading the Key Element of eToro?
100%. Also, many customers come to the discussions that appear on eToro to learn and discuss crypto with other people.
We also have smart portfolios where you follow specific trends and make it easier for people to invest. For example, we have a DeFi portfolio and a MetaMask portfolio. It’s also a very simple way for people to get exposed to a bigger sort of industry, which is also very transparent.
Yeah, so I think there is a lot of innovation around that, but it’s really helping retail [investors] get information and be able to easily, even in fiat, sort of invest in all of that.
Which Asset Category Seems to Have the Most Potential for eToro to Expand?
I would touch upon two subjects in this regard. The first element is we are a multi-asset platform.
One of, I think, the biggest advantages of using eToro is your ability to get exposed to many, many different sorts of asset classes in one place. You can also have the eToro money credit card in some countries that we support. We’re also seeing that when our customers use a larger amount of our products, they really benefit from that. So I think that’s a big part of the element.
I would also mention, in that regard, that a lot of our investors are somehow maybe Gen Z. We really see the potential of people to really follow what happens in the market, where they’re really interested in what happens in the market. Social networks are a big part of that.
You can follow others that you are interested in, you can comment on yourself and engage, as well as the fact that the world is a very interesting place, and things are changing daily. And to know that you can do crypto at eToro if that’s interesting, but also they are like, if they’re interested in oil and gas prices, or any other things, you have that as well. I think this is what is really special, that you can get exposed to a lot of stuff, learn about it, and all in one place.
Is Education the main Drive of how eToro Recruits new Customers?
Not necessarily. We mostly see that part of our goal as a company is to open financial markets for everybody and invest in a simple and transparent place. And for us, education is part of that.
We want to help our customers educate themselves, and with the hope that they choose to stay with us for many, many years to come. So this is a way for us to create a lot of opportunities.
We want to build a longer-term relationship and help customers prosper. Yeah, how we recruit different people really depends. Part of it is related to marketing, brand awareness, and many other aspects.
How eToro Focuses on the Security of the Platform
First, we work with top-net security experts, including ex-secret service people. Some of them are employed by eToro to deal with that element.
Secondly, especially around crypto, I can’t expose too much information because some of it is really classified. However, we work on different layers of security within a customer infrastructure. We try to keep a lot of client assets in what we describe as a “deep vault” with very secure elements. And it’s a big part of our infrastructure. It’s a big part of our discussion.
For any project, we take the fact that customers trust us extremely seriously with the funds. And we feel extremely fortunate for it.
Luckily for us, until today, we never had any issue with that. But there are a lot of elements around it. When you ask about innovation, it’s also one of the reasons why it may take a little bit longer for us to issue new projects; it is also because we take security extremely seriously with every element. That is a major part of the design.
Does eToro Use B2B Solutions For Security?
We think there are good B2B solutions. Again, when we work with vendors, also based on our size, they usually adapt to our requirements.
We work with some vendors who are from a security background, working in secret services, and building really insane secure elements. I learned a lot working with them and with their background. I wish I could tell you more about it, but for me, as an individual and not as a potential sort of employee, I think that it’s very interesting.
Because there are also discussions about the “not your keys, not your money” element. But also, having your own money has its risks. Holding a really large amount of money in some place at home can get ruined or stolen. There are so many risks; you can also have the risk of someone putting a gun to your head.
There are many social elements. And when I see the work that is done in the program, I’m very proud and impressed by the seriousness we take about that element. I think that’s part of the value we bring in. You know, being regulated and also really taking the customers’ funds and interests seriously.
What eToro Expects to Achieve During the Paris Blockchain Week?
I’ve been here some years back. And it’s grown so much I’m shocked!
I’ve been here for less than an hour today, and I’m like: “Wow!”. And you can really see the adoption here. Also, the French regulation is getting more into that, which is absolutely amazing.
And being at the Louvre, what else can you ask for? But I would also love to talk to a lot of companies to learn about innovation. Part of my role is building new products at eToro within crypto. But it’s also about talking to a lot of founders and crypto providers and seeing what else we can collaborate on and integrate with eToro. And always learn.
I’m very passionate about this specific market and blockchain. So I’m really looking forward to it. I may also catch up with some old friends that I haven’t seen for a while.
How can one Launch Their Crypto on eToro?
You don’t necessarily have to reach out to anyone. We are obviously following the market very closely.
As I mentioned before, being regulated, we’ve taken our clients’ interests very seriously. Often, our processes may be a bit longer than those of some unregulated blockchain platforms.
First, you’d be invited to talk to me or some of our listing or trading committee members. We’re always excited to hear and learn about your new crypto.
Disclaimer
In compliance with the Trust Project guidelines, this opinion article presents the author’s perspective and may not necessarily reflect the views of BeInCrypto. BeInCrypto remains committed to transparent reporting and upholding the highest standards of journalism. Readers are advised to verify information independently and consult with a professional before making decisions based on this content. Please note that our Terms and Conditions, Privacy Policy, and Disclaimers have been updated.

Pi Network’s price has shown signs of recovery in recent days, reaching a two-week high after a notable uptrend.
However, despite this progress, the cryptocurrency’s growth appears heavily dependent on external factors, particularly Bitcoin’s price movements. As a result, its future direction remains closely tied to the crypto king’s performance.
Pi Network Could Keep The Uptrend Going
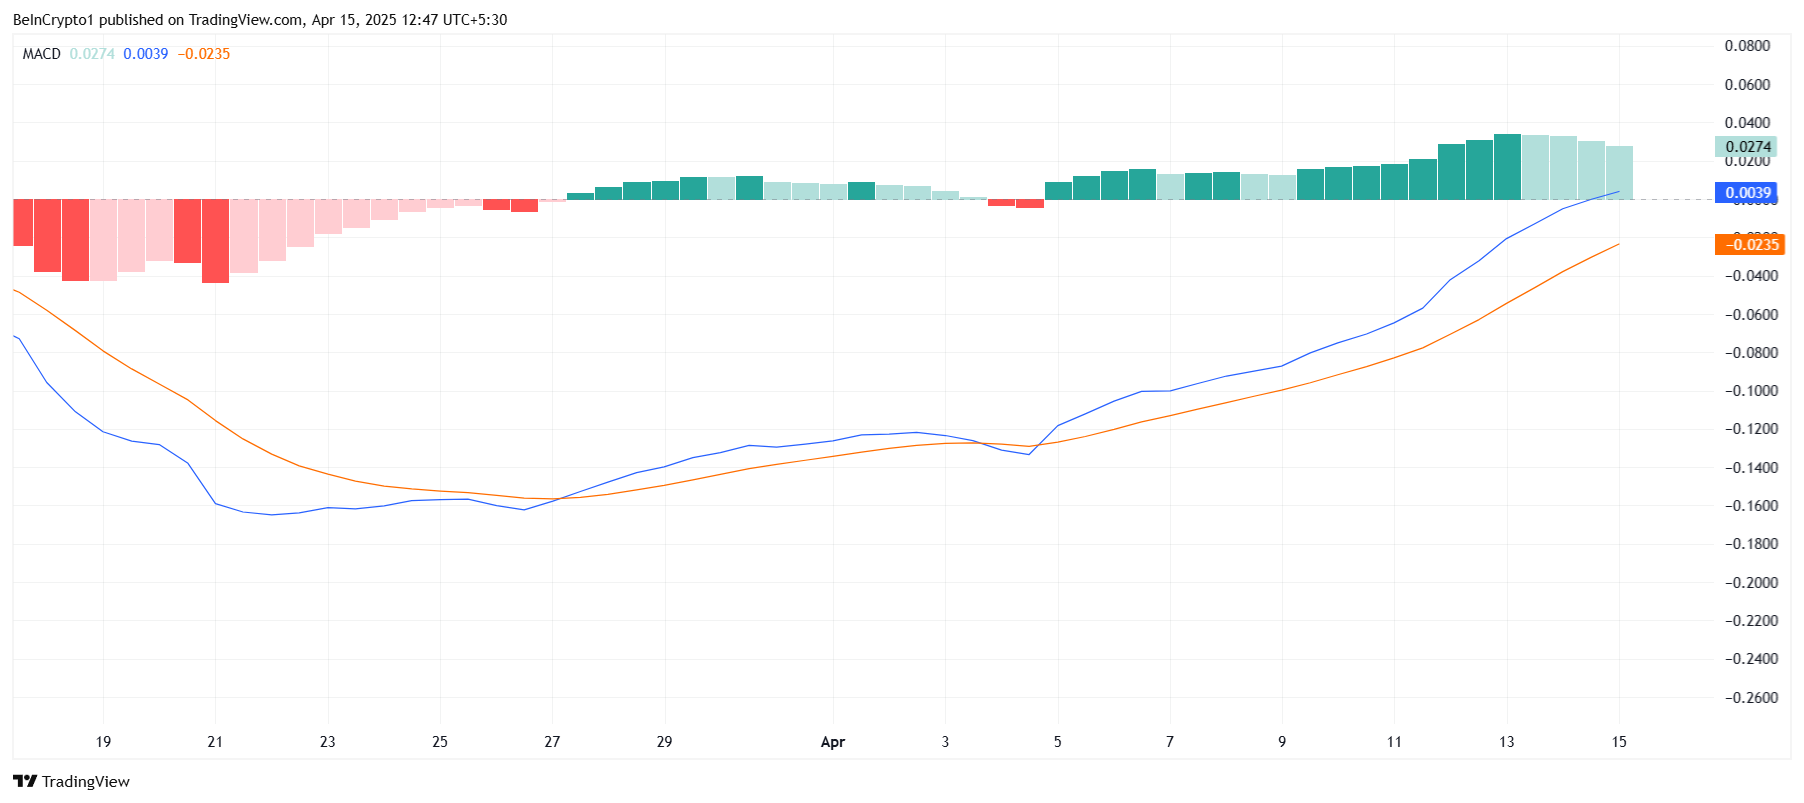
The Moving Average Convergence Divergence (MACD) indicator suggests that while Pi Network’s bullish momentum is beginning to fade, it has not yet reversed course. The indicator remains in positive territory, signaling that there is still potential for continued upward movement. The MACD is far from a bearish crossover, which could suggest that Pi still has room to rise in the short term.
Despite a slight weakening in bullish momentum, the overall outlook for Pi Network remains positive. The current trend still shows that there is enough strength for the altcoin to maintain its uptrend and push higher, particularly if market conditions support its growth.
Pi Network has shown a strong correlation with Bitcoin, standing at 0.84. This suggests that Pi closely follows the movements of Bitcoin, with its price trajectory highly influenced by the performance of the crypto market leader. As Bitcoin holds steady above $85,000, it could act as a strong catalyst for Pi’s price growth.
Given Bitcoin’s ongoing strength, Pi Network has the potential to experience a similar upward movement, especially if BTC continues to see positive price action. Pi’s dependence on Bitcoin’s market performance is evident, and any sustained rise in Bitcoin could trigger a corresponding rise in Pi Network’s value.

PI Price is Aiming At $1
Pi Network is currently trading at $0.74, up by 26% over the past five days. To maintain this positive momentum, Pi must hold above the $0.70 support level. A bounce off this level would allow the altcoin to continue its rise and potentially test the next resistance level at $0.87.
If Pi successfully breaches $0.87, it could open the door for further gains, with a potential move toward $1.00. The market sentiment and Bitcoin’s continued strength could fuel this upward momentum, bringing Pi closer to its key target. A break above this resistance would signify the start of a more substantial rally.

However, should Bitcoin experience a decline, Pi Network may follow suit. A drop through the $0.70 support level could lead Pi to test the $0.60 mark, and a further fall through this point would likely bring the price down to $0.51. This would invalidate the bullish outlook and signal a potential reversal in Pi’s price trend.
Disclaimer
In line with the Trust Project guidelines, this price analysis article is for informational purposes only and should not be considered financial or investment advice. BeInCrypto is committed to accurate, unbiased reporting, but market conditions are subject to change without notice. Always conduct your own research and consult with a professional before making any financial decisions. Please note that our Terms and Conditions, Privacy Policy, and Disclaimers have been updated.

Reason to trust
![]()
Strict editorial policy that focuses on accuracy, relevance, and impartiality
Created by industry experts and meticulously reviewed
The highest standards in reporting and publishing
Strict editorial policy that focuses on accuracy, relevance, and impartiality
Morbi pretium leo et nisl aliquam mollis. Quisque arcu lorem, ultricies quis pellentesque nec, ullamcorper eu odio.
Ethereum price started a fresh increase above the $1,620 zone. ETH is now consolidating gains and might aim for more gains above $1,680.
- Ethereum started a decent increase above the $1,600 and $1,620 levels.
- The price is trading above $1,625 and the 100-hourly Simple Moving Average.
- There is a new connecting bullish trend line forming with support at $1,625 on the hourly chart of ETH/USD (data feed via Kraken).
- The pair could start a fresh increase if it clears the $1,680 resistance zone.
Ethereum Price Eyes More Gains
Ethereum price formed a base above $1,520 and started a fresh increase, like Bitcoin. ETH gained pace for a move above the $1,580 and $1,600 resistance levels.
The bulls even pumped the price above the $1,650 zone. A high was formed at $1,690 and the price recently started a downside correction. There was a move below the $1,640 support zone. The price dipped below the 50% Fib retracement level of the upward move from the $1,562 swing low to the $1,690 high.
However, the bulls were active near the $1,620 zone. Ethereum price is now trading above $1,625 and the 100-hourly Simple Moving Average. There is also a new connecting bullish trend line forming with support at $1,625 on the hourly chart of ETH/USD.
On the upside, the price seems to be facing hurdles near the $1,660 level. The next key resistance is near the $1,680 level. The first major resistance is near the $1,690 level. A clear move above the $1,690 resistance might send the price toward the $1,750 resistance.

An upside break above the $1,750 resistance might call for more gains in the coming sessions. In the stated case, Ether could rise toward the $1,800 resistance zone or even $1,880 in the near term.
Another Decline In ETH?
If Ethereum fails to clear the $1,660 resistance, it could start a downside correction. Initial support on the downside is near the $1,620 level. The first major support sits near the $1,610 zone and the 61.8% Fib retracement level of the upward move from the $1,562 swing low to the $1,690 high.
A clear move below the $1,610 support might push the price toward the $1,575 support. Any more losses might send the price toward the $1,550 support level in the near term. The next key support sits at $1,500.
Technical Indicators
Hourly MACD – The MACD for ETH/USD is losing momentum in the bullish zone.
Hourly RSI – The RSI for ETH/USD is now above the 50 zone.
Major Support Level – $1,610
Major Resistance Level – $1,660

Omri Ross on How eToro Stands Out in the Crypto Exchange Arena
Has XRP Price Already Bottomed? Analyst On How Ripple Coin Can Hit $15

Pi Network Price Rise To $1 is Now In The Hands Of Bitcoin

Ethereum Price Consolidation Hints at Strength—Is a Move Higher Coming?

Bolivia Reverses Crypto-for-Fuel Plan Amid Energy Crisis

Binance Delists This Crypto Causing 40% Price Crash, Here’s All

2.52 Million Altcoins Are Ruining Crypto’s Future

Animoca Brands Valuation Tanks 75% In Two Years, Here’s Why

Crypto exchange BingX hacked for $43 million

Are The Big Players Losing Interest?

Hong Kong’s Securities Association Tips Authorities On Crypto Self-Regulation

Coinbase cbBTC Set to go Live on Solana
2.52 Million Altcoins Are Ruining Crypto’s Future
Animoca Brands Valuation Tanks 75% In Two Years, Here’s Why
Crypto exchange BingX hacked for $43 million
Are The Big Players Losing Interest?
Hong Kong’s Securities Association Tips Authorities On Crypto Self-Regulation
Coinbase cbBTC Set to go Live on Solana
-

 Market21 hours ago
MENAKI Leads Cat Themed Tokens
-
 Market20 hours ago
Tether Deploys Hashrate in OCEAN Bitcoin Mining Pool
-

 Market19 hours ago
3 Altcoins to Watch in the Third Week of April 2025
-

 Ethereum18 hours ago
Ethereum Price Threatened With Sharp Drop To $1,400, Here’s Why
-

 Market16 hours ago
Binance Futures Causes a Brief Crash For Story (IP) and ACT
-
 Market23 hours ago
SEC Delays Decision on Grayscale Ethereum ETF Staking
-

 Market14 hours ago
Is The XRP Price Mirroring Bitcoin’s Macro Action? Analyst Maps Out How It Could Get To $71
-

 Market22 hours ago
Strategy and Metaplanet Buy Bitcoin Despite Recession Fears
