
Market
Crypto AI Agents Market Cap Drops 65% in a Month

Crypto AI Agents’ total market cap has sharply declined, now sitting around $7 billion after dropping from $20 billion just a month ago. While some leading tokens continue to struggle, others have shown resilience, with AI16Z and ARC posting significant gains in the last seven days.
Whale engagement and smart account activity have been declining but at a slower pace, suggesting potential stabilization. If interest in AI-driven narratives returns, the top-performing Crypto AI Agents could be primed for another breakout, with projects like VIRTUAL, AI16Z, and ARC positioned to benefit the most.
Some Crypto AI Agents Leaders Are Struggling, But Others Are Rising
The top 10 biggest Crypto AI Agents coins show a mixed performance, with one recently launched, three declining over the last seven days, and six posting gains. AI16Z and ARC have led the recent upside, highlighting strong momentum within certain coins.
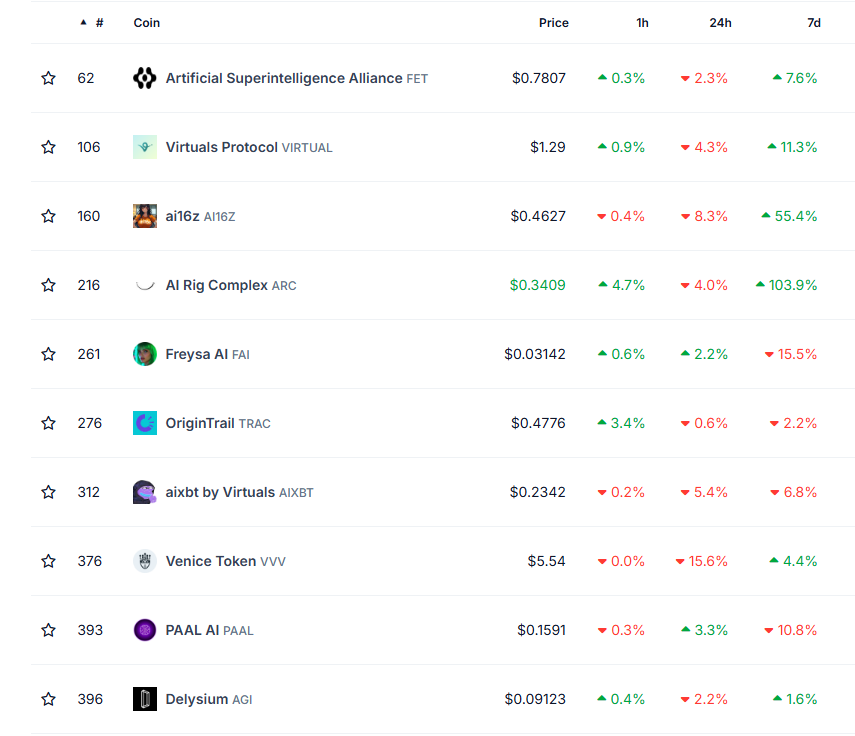
VIRTUAL, the largest Crypto AI Agent coin, is up around 10% this week but is still struggling to regain the momentum that once made it the biggest artificial intelligence token in the market. Its dominance in the sector is reflected in the top 10, as three of the biggest AI Agent coins are directly linked to its ecosystem.
Blockchain distribution also plays a key role. Four of these tokens launched on Base and another four on Solana, with only one on Ethereum and one on BNB. With Virtuals Protocol now live on Solana, the network’s presence in the crypto AI agents ecosystem space could become even stronger.
ARC and AI16Z
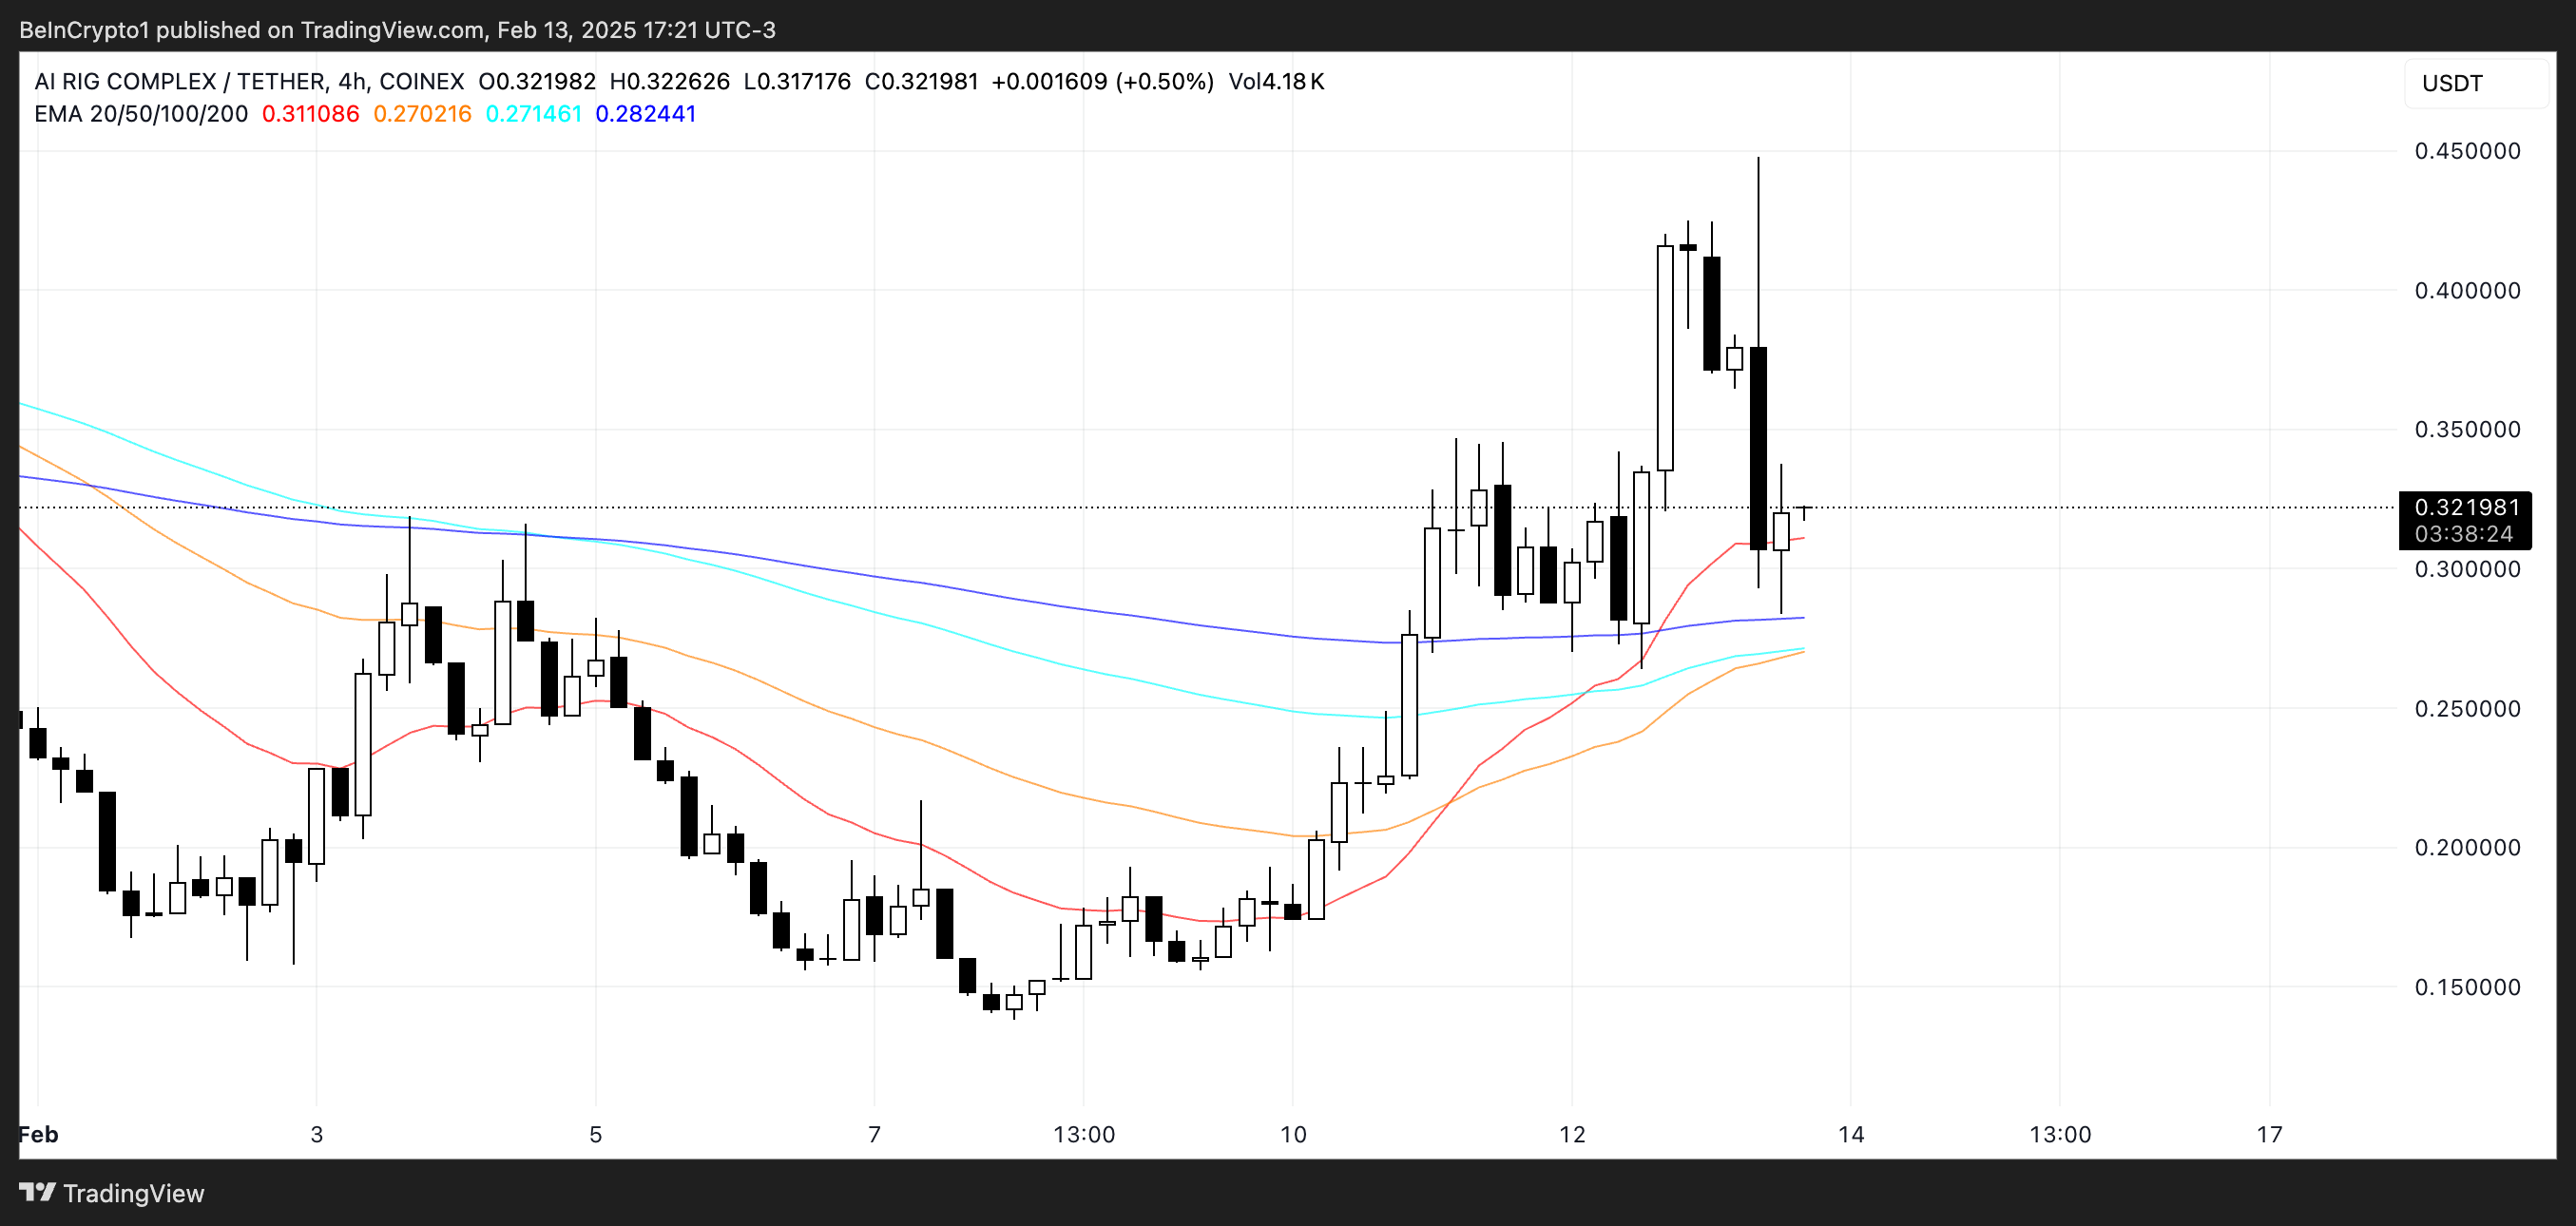
ARC has been the biggest winner among the top 10 Crypto AI Agents coins in the past seven days, surging nearly 96%. This impressive rally has pushed ARC to the fifth spot in the rankings, with a market cap of approximately $320 million.
Despite a slight pullback in the last few hours, ARC is still trading at its highest levels since late January.
AI16Z follows as the second-best performer, climbing over 50% in the past week as AI-powered market analysis bots regain momentum.
With this surge, AI16Z has now become the second-largest Crypto AI Agent coin and the biggest one built on Solana, reaching a $513 million market cap.
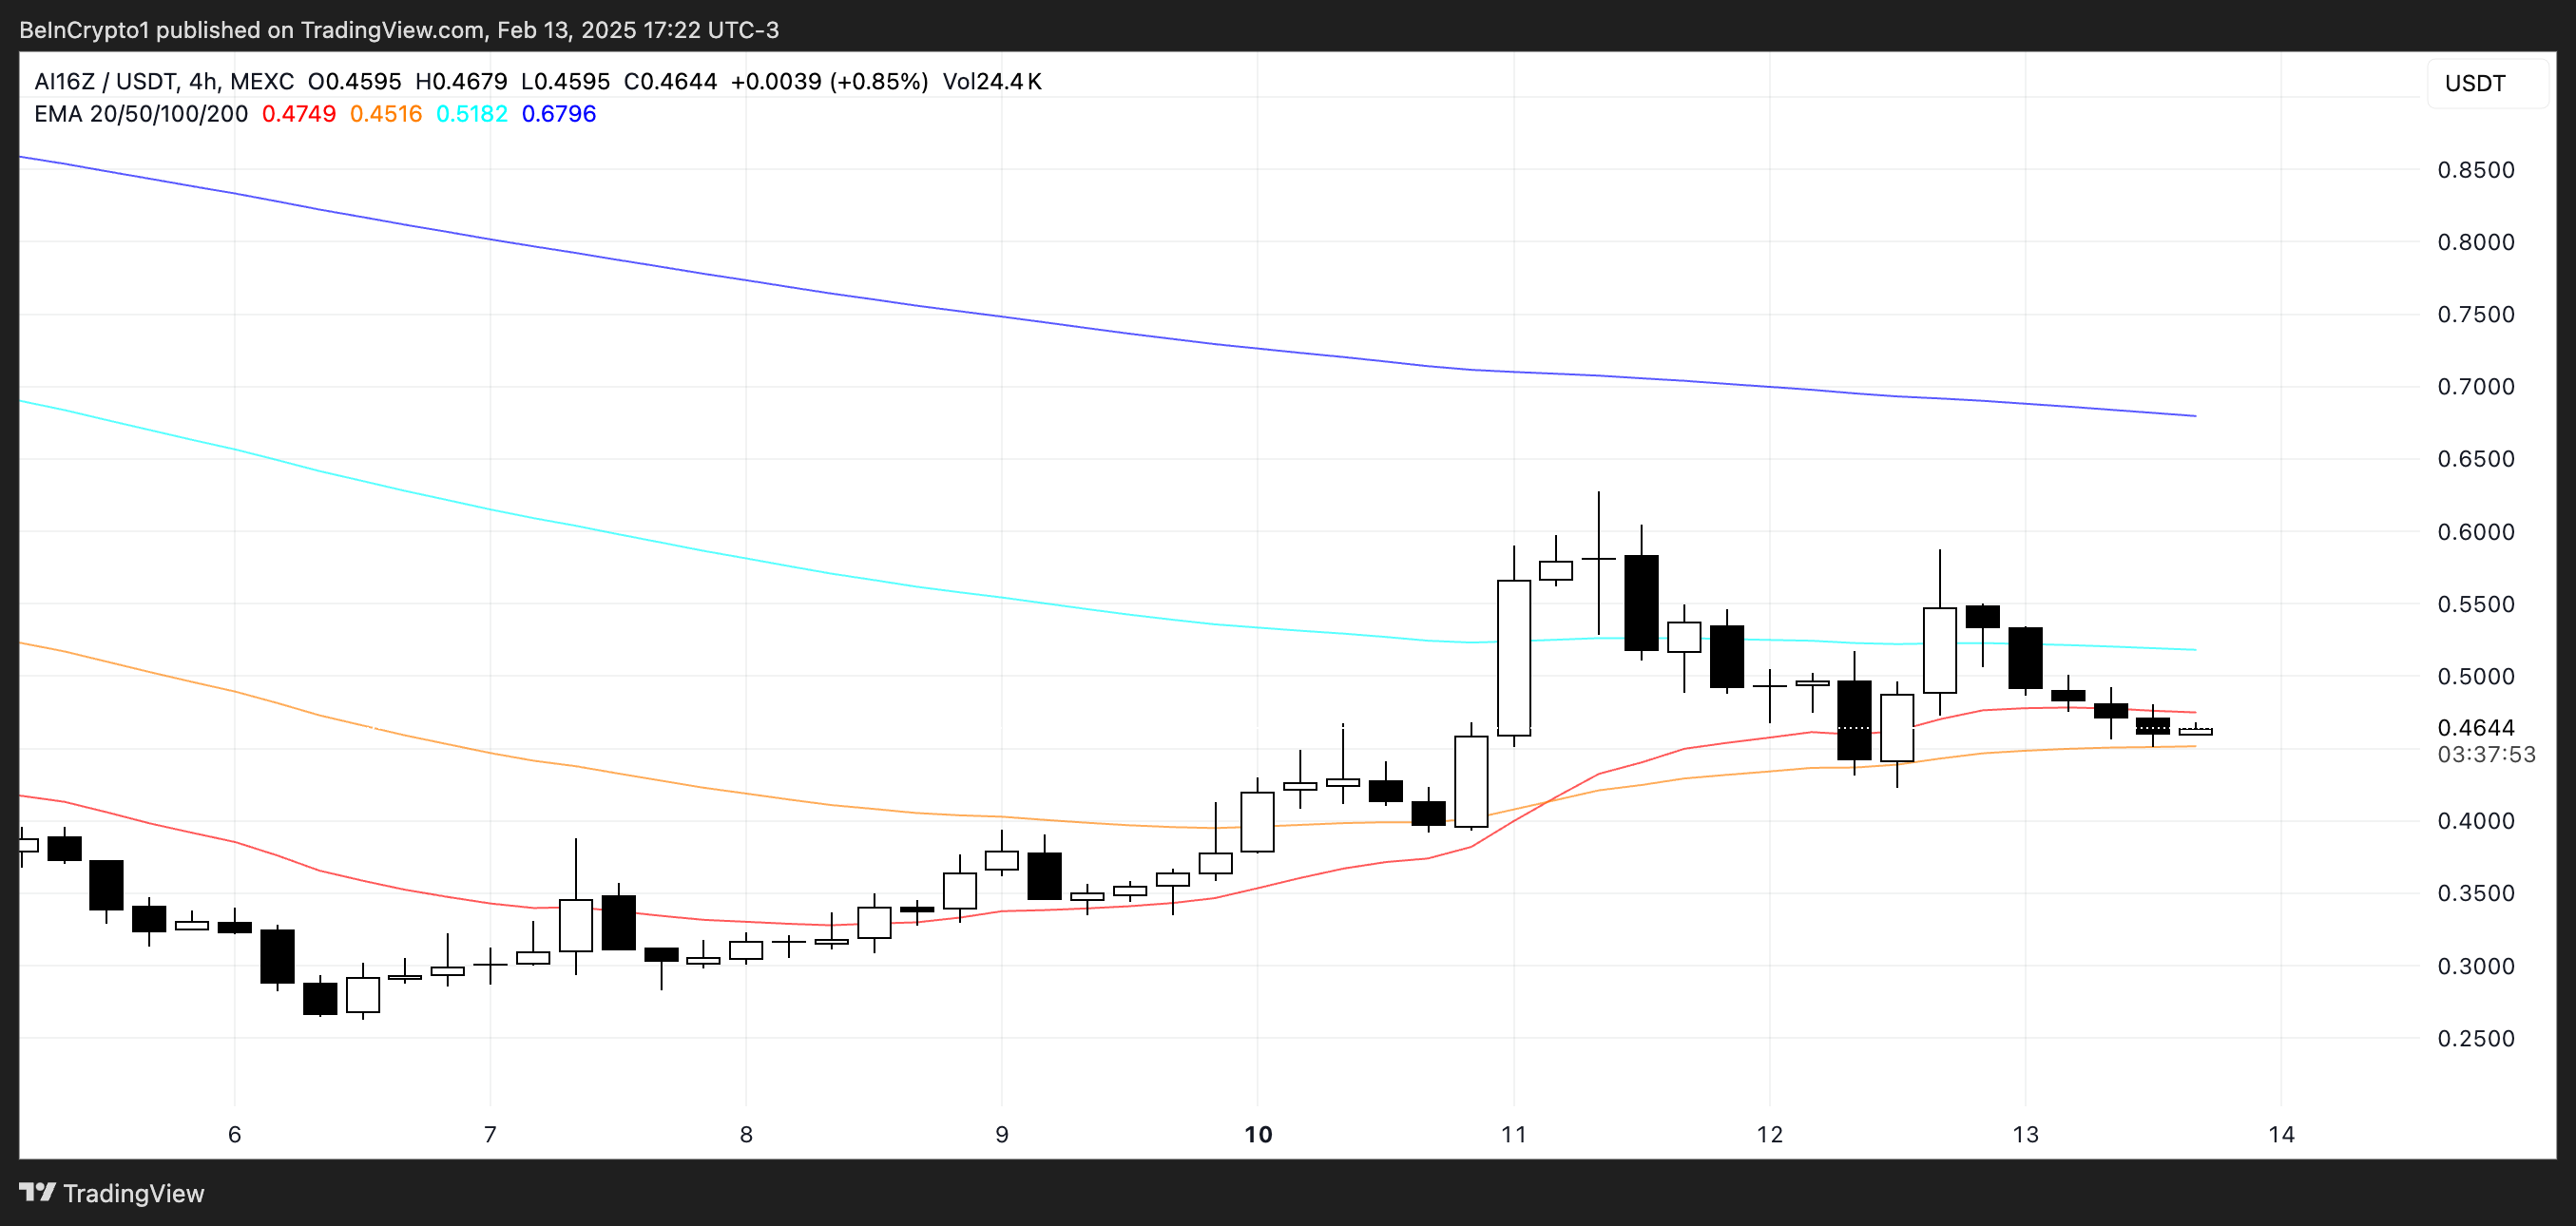
However, it still trails VIRTUAL by 61%, showing that while AI16Z is gaining traction, VIRTUAL remains the dominant force in this sector.
Are Crypto AI Agents Ready for a Rebound?
The engagement of smart accounts on Crypto AI Agents – wallets linked to KOLs or smart traders – has been steadily declining since January 27. These accounts play a crucial role in the market, as they often indicate where experienced investors are focusing their attention.
A sustained drop in engagement suggests that interest in AI-driven crypto narratives has cooled off, leading to reduced activity in key tokens. However, while engagement is still trending downward, the rate of decline has begun to slow.
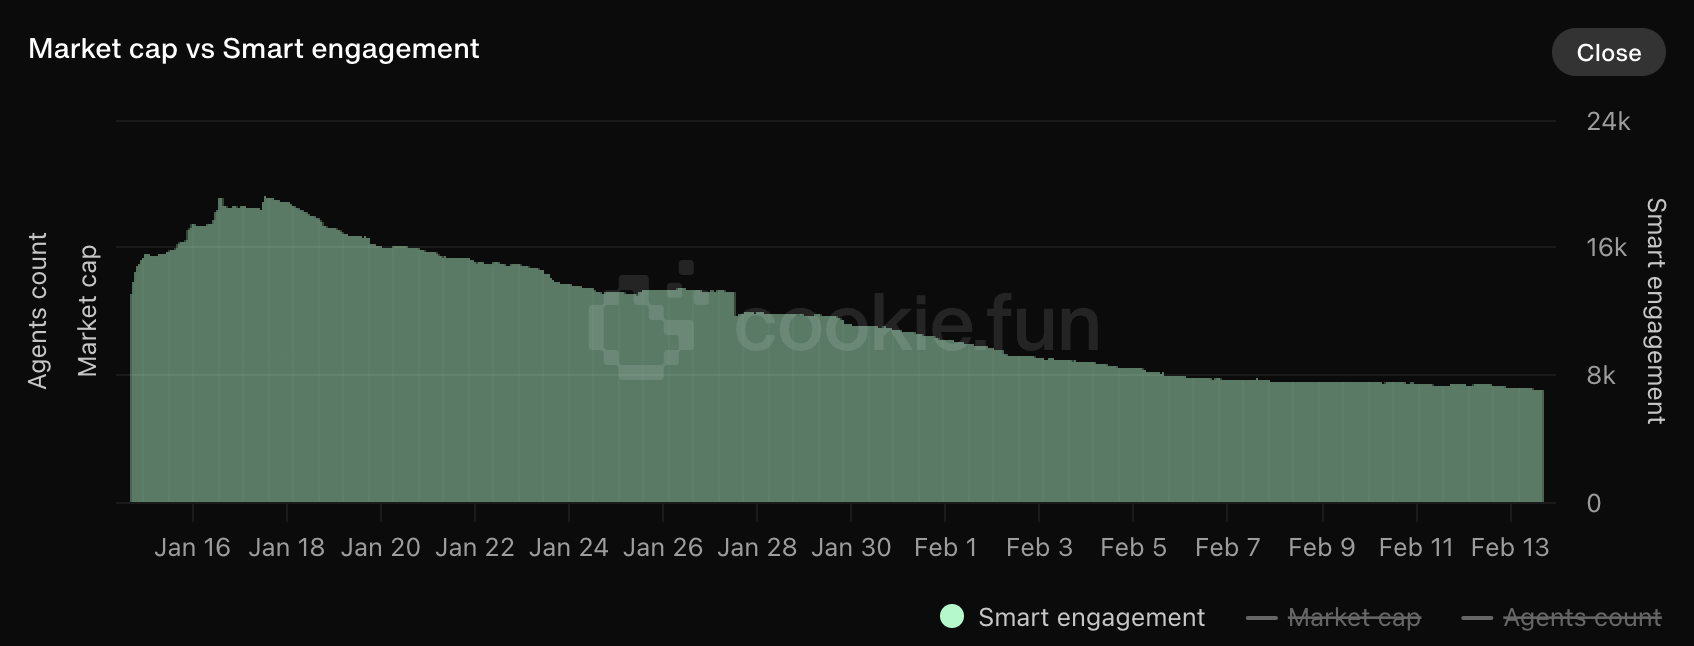
If smart account activity stabilizes and eventually starts to rise again, it could signal renewed confidence in the sector.
A resurgence in AI-related hype, similar to the levels seen in previous months, would likely benefit major crypto AI Agent tokens like VIRTUAL, AI16Z, and ARC.
Disclaimer
In line with the Trust Project guidelines, this price analysis article is for informational purposes only and should not be considered financial or investment advice. BeInCrypto is committed to accurate, unbiased reporting, but market conditions are subject to change without notice. Always conduct your own research and consult with a professional before making any financial decisions. Please note that our Terms and Conditions, Privacy Policy, and Disclaimers have been updated.


Solana (SOL) has climbed 13% over the past seven days, showcasing strong short-term performance. While momentum indicators like the RSI and EMA lines remain supportive, recent price action suggests that bullish strength may be stalling just below a key breakout point.
At the same time, the sharp drop in BBTrend indicates weakening trend strength and fading volatility, often a sign of incoming consolidation or market indecision. With technicals at a crossroads, SOL’s next move will likely depend on whether buyers can regain control or if a broader pullback begins to unfold.
SOL RSI Rises Sharply, but Pause in Momentum Signals Caution
Solana’s Relative Strength Index (RSI) is currently at 60.35, marking a noticeable rise from 45 just two days ago.
This jump signals growing bullish momentum, although the RSI has remained stable since yesterday, suggesting that upward pressure may be easing for now.
The increase reflects renewed buying interest in recent sessions, pushing SOL closer to overbought territory but not quite there yet. This leveling off could indicate that the market is taking a breather before deciding its next move.
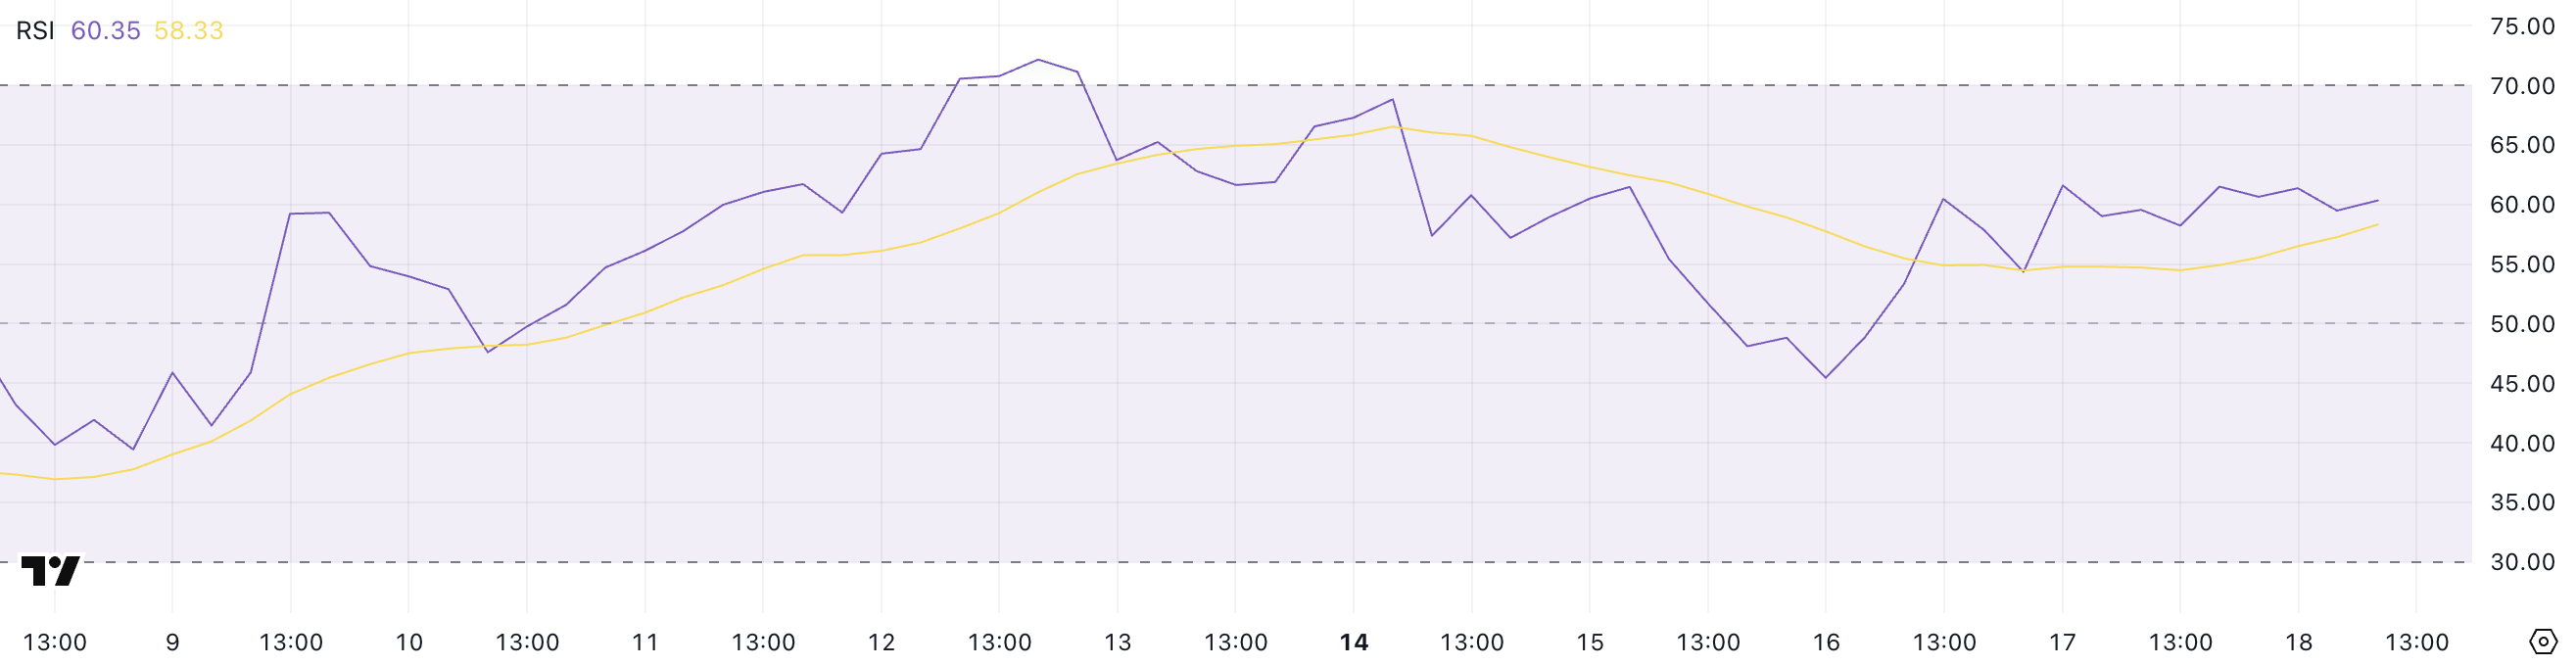
The RSI is a momentum oscillator that measures the speed and magnitude of price movements, ranging from 0 to 100. Values above 70 typically indicate that an asset is overbought and may be due for a pullback, while readings below 30 suggest oversold conditions, potentially signaling a buying opportunity.
With Solana’s RSI at 60.35, the asset is approaching bullish territory but hasn’t yet entered an extreme zone.
This positioning suggests that while recent momentum is positive, SOL could face some short-term consolidation or resistance before continuing higher—unless strong buying interest resumes and pushes the RSI closer to overbought levels.
SOL Trend Strength Weakens as BBTrend Falls Below 6
Solana’s BBTrend indicator is currently at 5.69, a significant drop from the 17.5 reading observed just four days ago.
This sharp decline suggests that volatility around SOL’s price has cooled notably, and the strength of the prior trend is weakening.
While BBTrend doesn’t signal direction on its own, the drop indicates that the strong movement, likely bullish, has lost momentum, and SOL may be entering a phase of consolidation or uncertainty.

BBTrend, short for Bollinger Band Trend, measures the strength of a price trend based on the expansion or contraction of Bollinger Bands.
Higher values suggest a strong, directional move (either up or down), while lower values point to weaker trends and reduced volatility. With BBTrend now at 5.69, Solana is in a much less volatile environment, which often precedes a breakout or a reversal.
For now, this reading signals that the recent momentum is fading. Unless volatility picks up again, SOL’s price may remain range-bound in the short term.
Golden Cross Looms for SOL, But $136 Barrier Still Holding Strong
Solana’s EMA lines continue to reflect a bullish structure, with the short-term average trending above the long-term one—suggesting that positive momentum remains intact.
A potential golden cross is also forming, which, if confirmed, would further reinforce the bullish outlook.
However, despite this favorable setup, Solana price has struggled to break through the $136 resistance level over the past few days, indicating that buyers may be losing steam at this key threshold.
Tracy Jin, COO of MEXC told BeInCrypto:
“Amid widespread volatility, Solana has stood out with notable strength. A combination of favorable technical setups and institutional tailwinds — such as the launch of the first spot Solana ETFs in North America — has helped drive a short-term rally. The token’s reclaim of leadership in decentralized exchange activity and rising total value locked further support the bullish case.”

If SOL manages to push above $136 with strong volume, it could open the path toward the next targets at $147 and potentially higher. But if the current momentum fades and the price reverses, a test of support at $124 becomes likely.
About Solana next moves, Jin told BeInCrypto:
“Despite recent gains, SOL’s near-term outlook remains sensitive to broader liquidity conditions. Any deterioration in market confidence — whether from macro shocks or renewed volatility in Bitcoin — could cap upside potential.”
A breakdown below that could accelerate losses toward $112, and in the event of a deeper correction, SOL could even revisit the $95 region.
Disclaimer
In line with the Trust Project guidelines, this price analysis article is for informational purposes only and should not be considered financial or investment advice. BeInCrypto is committed to accurate, unbiased reporting, but market conditions are subject to change without notice. Always conduct your own research and consult with a professional before making any financial decisions. Please note that our Terms and Conditions, Privacy Policy, and Disclaimers have been updated.

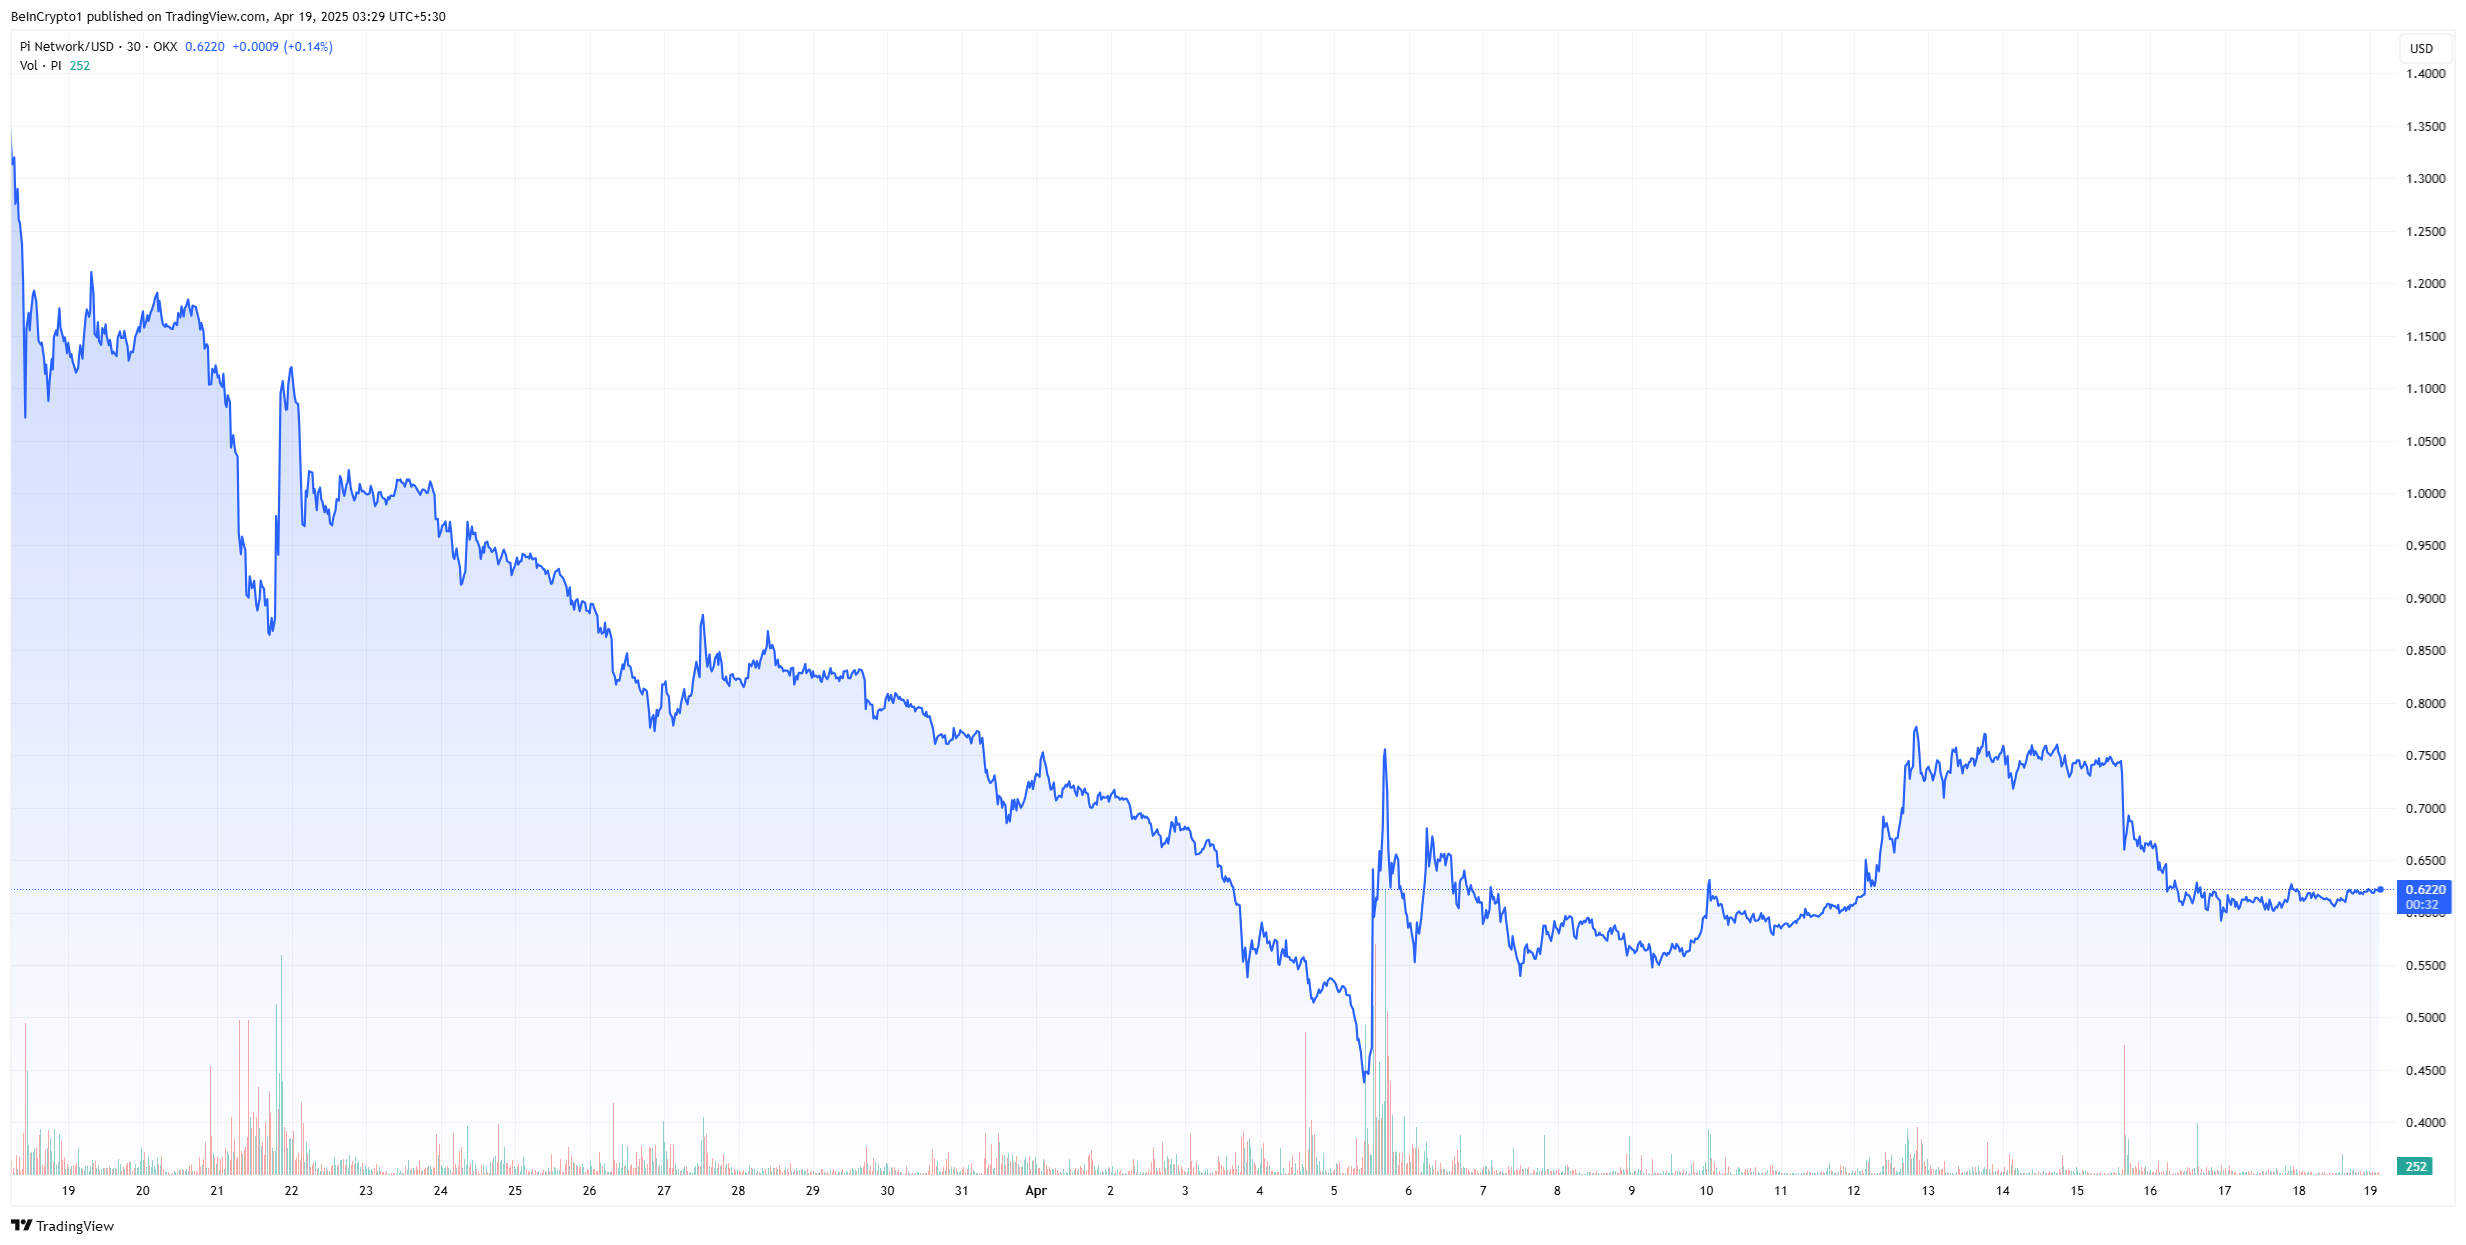
Pi Network released its Mainnet Migration Roadmap today. The roadmap lays out a three‑phase plan to move tens of millions of Pioneers who are still waiting to be moved to the open network. It also introduces new rewards, such as referral bonuses.
However, unlike most project roadmaps, Pi network didn’t provide any estimated date or timeline. This lack of clarification has frustrated early adopters who still await key rewards and clarity on rollout pacing.
Pi Network’s Three‑Phase Migration Plan
According to the roadmap, Pi Network will first complete initial migrations for Pioneers already in the queue. This batch covers verified base mining rewards, Security Circle contributions, lockup commitments, utility‑app usage rewards, and confirmed Node rewards for some operators.
After clearing the first wave, the team will tackle second migrations, adding all referral mining bonuses linked to KYC‑verified team members. Pi says these referral rewards will follow once the current queue finishes.
Finally, the network will move into ongoing periodic migrations—potentially monthly or quarterly—to process any remaining bonuses and rewards.
The cadence “is to be determined,” the roadmap notes.
Community Concerns and Critical Gaps
A thorough observation reveals several gaps and potential concerns in the roadmap.
For one, the plan never discloses how many Pioneers remain in the queue or the network’s daily migration capacity. Without those figures, users can’t predict when their own migration will occur.
Node operators report that some “confirmed Node rewards” have landed, but criteria for qualification remain opaque. Early node runners worry they may miss out without clear benchmarks.
Many Pioneers say they have tapped their claim buttons daily since migration opened yet still lack basic mining rewards. They question whether those base rewards and deferred referral bonuses will ever arrive in phase two.
Also, the roadmap admits the UI’s “Transferable Balance” underestimates actual migrated amounts to save resources. Users fear this pessimistic display could erode trust if their true balances remain hidden.
“I thought we were mining all of these PI coins this whole time? I thought the security circles were the Consensus Mechanism. It kinda seems to me like there isn’t a blockchain, and never was one. What kind of “Blockchain protocol” would “Require” all tokens to be minted at genesis?” one community member wrote.
Crucially, Pi offers no audit or error‑resolution process for users who spot mismatches in their historical mining data.
Given six years of complex records, occasional disputes seem inevitable, but the roadmap remains silent on redress.
All migrations hinge on KYC completion, yet the team omits any scaling targets or timelines for identity verification. A bottleneck here could stall every subsequent phase.
The schedule also ignores how major token unlock events—such as the roughly 108.9 million PI tokens due to release this month—will align with migration waves.
Finally, some Pioneers challenge the project’s foundational narrative. They note that Pi’s statement “all tokens were minted at genesis” contradicts six years of “mining.”
This raises doubts about whether Pi ever operated on a true blockchain protocol.
In the past month, PI price has dipped by over 45%. To sustain momentum and community trust, the team must now supply concrete timelines, transparent criteria, and clear audit paths for its Mainnet migration.
Disclaimer
In adherence to the Trust Project guidelines, BeInCrypto is committed to unbiased, transparent reporting. This news article aims to provide accurate, timely information. However, readers are advised to verify facts independently and consult with a professional before making any decisions based on this content. Please note that our Terms and Conditions, Privacy Policy, and Disclaimers have been updated.

The meme coin market is experiencing a surge in investor interest, helping certain tokens recover from their all-time lows (ATLs). Memecoin (MEME) is one such token that has avoided a new ATL and also posted a significant 73% rise.
BeInCrypto has analyzed two other meme coins that have performed well over the past day, making them important tokens to watch.
Memecoin (MEME)
- Launch Date – November 2023
- Total Circulating Supply – 43.11 Billion MEME
- Maximum Supply – 69 Billion MEME
- Fully Diluted Valuation (FDV) – $135.37 Million
MEME had a rough week, hitting a new all-time low at $0.00137. However, the altcoin rebounded sharply, rising by 38% in the last 24 hours to trade at $0.00196. This surge marks a significant recovery, driven by renewed interest in meme coins.
The recent surge in MEME’s price was fueled by a sudden spike in interest for joke tokens, driving a 73% intraday high. To maintain its gains, MEME must successfully breach and flip the $0.00228 resistance into support, a critical level for sustaining its upward momentum.
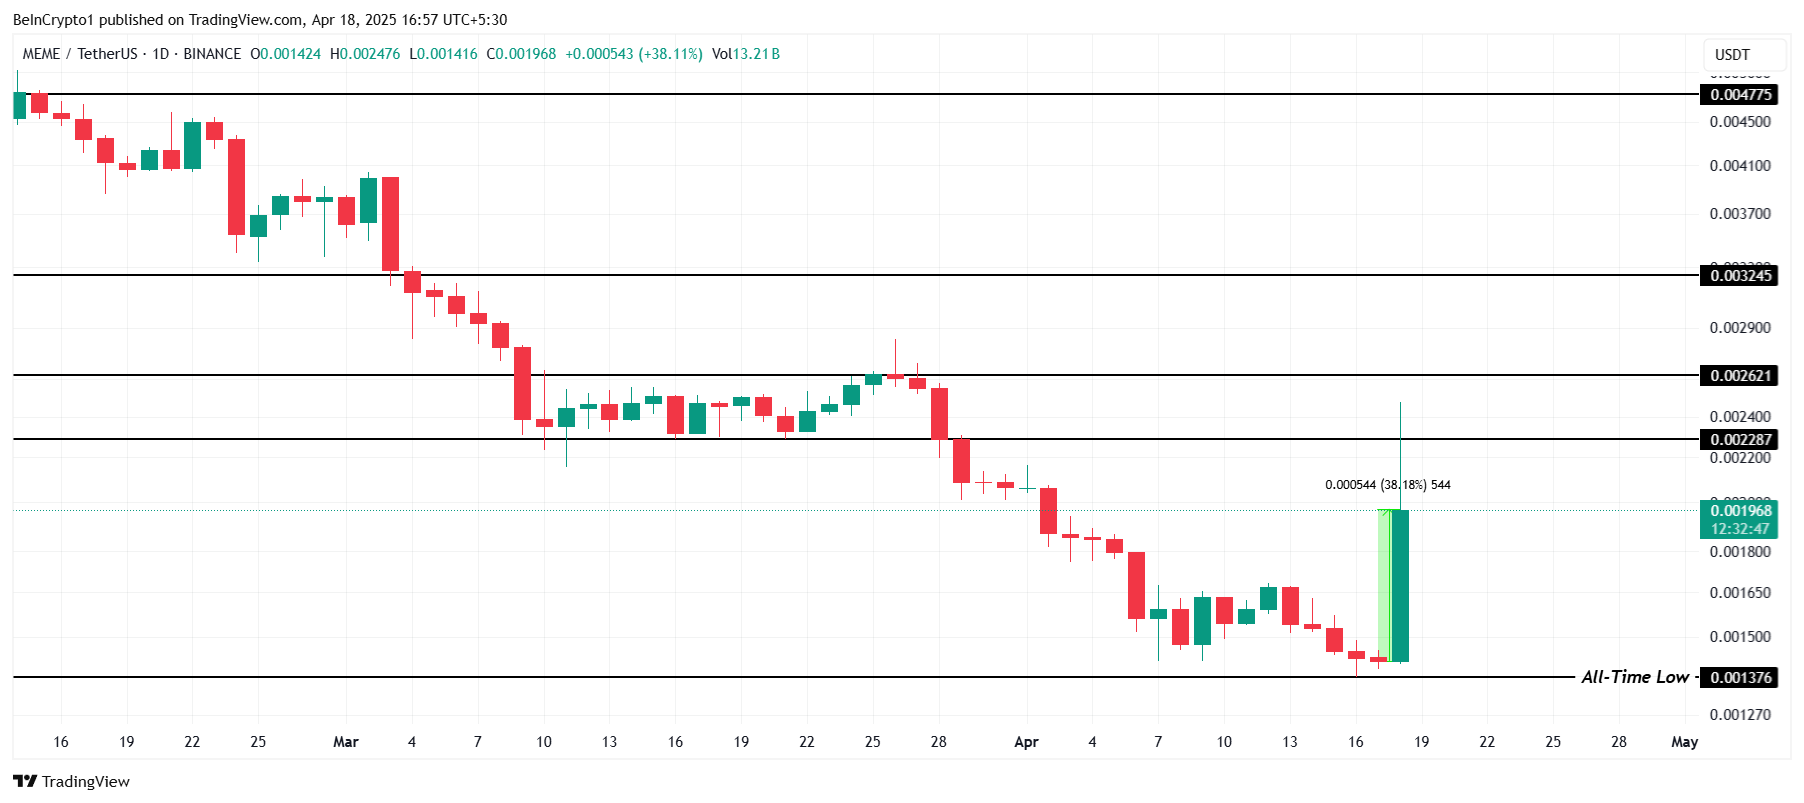
If MEME experiences profit-taking from investors, it could reverse course and drop back down to the all-time low of $0.00137. A decline through this level would invalidate the bullish outlook and signal further challenges for the meme coin.
Bone ShibaSwap (BONE)
- Launch Date – July 2021
- Total Circulating Supply – 249.89 Million BONE
- Maximum Supply – 250 Million BONE
- Fully Diluted Valuation (FDV) – $71.67 Million
BONE posted an impressive 18.5% rise over the last 24 hours, trading at $0.285. The altcoin is currently under the key resistance of $0.295. Given the recent momentum, it seems poised to breach this level, signaling a potential upward trajectory for the token in the near future.
Flipping the $0.295 resistance into support would open the door for BONE to target its next major resistance at $0.348. A sustained push above this level could drive further bullish sentiment, propelling the token toward even higher price levels.

However, if BONE fails to breach $0.295, the bullish momentum could fade. A decline from this point could send the meme coin back towards $0.232, invalidating the optimistic outlook. Such a reversal would likely create caution among investors, delaying potential upward movement.
- Launch Date – April 2024
- Total Circulating Supply – 999.96 Million BAN
- Maximum Supply – 1 Billion BAN
- Fully Diluted Valuation (FDV) – $40.54 Million
BAN, a small-cap token, has caught the attention of investors, rising nearly 25% in the last 24 hours to trade at $0.040. This surge highlights the growing interest in the meme coin market, with BAN standing out despite its smaller market capitalization.
Inspired by the infamous banana taped to a wall, BAN gained significant fame after being purchased by Tron’s founder, Justin Sun, for $6.2 million last year. If the token continues its upward momentum, it could breach the $0.045 barrier and potentially flip it into support, securing its gains.

However, failing to break through the $0.045 resistance could lead to a drop back to $0.032. If this occurs, it would invalidate the bullish outlook and erase the recent gains, putting investors on alert for further price declines.
Disclaimer
In line with the Trust Project guidelines, this price analysis article is for informational purposes only and should not be considered financial or investment advice. BeInCrypto is committed to accurate, unbiased reporting, but market conditions are subject to change without notice. Always conduct your own research and consult with a professional before making any financial decisions. Please note that our Terms and Conditions, Privacy Policy, and Disclaimers have been updated.

Solana (SOL) Price Rises 13% But Fails to Break $136 Resistance

Pi Network Roadmap Frustrates Users Over Missing Timeline

MEME Rallies 73%, BONE Follows

Canary Capital Files For Staked Tron ETF

XRP Volume Plunges 20% Amid Market Uncertainty

BONK Symmetrical Triangle Squeeze: Is A Mega Breakout Imminent?

2.52 Million Altcoins Are Ruining Crypto’s Future

Animoca Brands Valuation Tanks 75% In Two Years, Here’s Why

Crypto exchange BingX hacked for $43 million

Are The Big Players Losing Interest?

Hong Kong’s Securities Association Tips Authorities On Crypto Self-Regulation

Coinbase cbBTC Set to go Live on Solana
2.52 Million Altcoins Are Ruining Crypto’s Future
Animoca Brands Valuation Tanks 75% In Two Years, Here’s Why
Crypto exchange BingX hacked for $43 million
Are The Big Players Losing Interest?
Hong Kong’s Securities Association Tips Authorities On Crypto Self-Regulation
Coinbase cbBTC Set to go Live on Solana
-

 Ethereum24 hours ago
Ethereum Investors Suffer More Losses Than Bitcoin Amid Ongoing Market Turmoil
-

 Ethereum16 hours ago
Ethereum Fee Plunges To 5-Year Low—Is This A Bottom Signal?
-
 Altcoin23 hours ago
Tron Founder Justin Sun Reveals Plan To HODL Ethereum Despite Price Drop
-

 Market20 hours ago
Ethereum Price Fights for Momentum—Traders Watch Key Resistance
-
 Altcoin20 hours ago
Expert Predicts Pi Network Price Volatility After Shady Activity On Banxa
-

 Market18 hours ago
Is XRP’s Low Price Part of Ripple’s Long-Term Growth Strategy?
-

 Market22 hours ago
Sui Meme Coins Surge With Rising DEX Volumes
-

 Altcoin21 hours ago
Analysts Predict XRP Price to Hit $6 as Wave 2 Correction Nears End