
Market
Court Ruling Raises 3AC’s FTX Claim to $1.53 Billion


The United States Bankruptcy Court for the District of Delaware granted a motion allowing the joint liquidators of Three Arrows Capital (3AC) to amend their original proof of claim in the FTX bankruptcy proceedings. This increases their claims from $120 million to $1.53 billion.
The amended filing broadened 3AC’s allegations against FTX to include breach of contract, breach of fiduciary duty, unjust enrichment, and proprietary restitutionary claims.
3AC’s Liquidators Secure Major Victory in FTX Case
The ruling stems from a motion filed by 3AC’s liquidators, Russell Crumpler and Christopher Farmer. For context, the liquidators initially filed their proof of claim in June 2023.
It sought to recover funds related to preference, conversion, and other avoidance actions tied to a $120 million loan allegedly owed by 3AC to FTX. Nonetheless, after further investigation, the liquidators determined that 3AC’s dealings with FTX were far more extensive.
“The information obtained by the Liquidators in the year since they filed their Original POC led them to the new conclusion that just two weeks before the commencement of the 3AC Liquidation, the $1.53 billion of assets that 3AC had on the FTX platform were liquidated to satisfy $1.3 billion in liabilities to FTX,” the document read.
Furthermore, according to court documents, the liquidators faced substantial obstacles during their investigation. This included a lack of proper records from 3AC. In addition, the cooperation was minimal from the company’s founders, Kyle Davies and Su Zhu.
Delays in receiving critical documents and data compounded these challenges. Much of the key information was only made available in late 2023 and early 2024. This came after FTX itself had filed for bankruptcy in November 2022. The exchange collapsed amid allegations of fraud and mismanagement under former CEO Sam Bankman-Fried.
This delay prevented the liquidators from fully understanding the scope of 3AC’s transactions with FTX until after the original claims deadline had passed.
“The evidence makes clear that the description of the facts contained in the Original POC was based on the limited information that the Liquidators had available to them at that time,” Judge John T. Dorsey wrote.
Meanwhile, FTX objected to the motion. They argued that the amendment was filed too late and expanded the scope of the claims, violating the bankruptcy process. The debtors claimed that the original proof of claim did not provide sufficient notice of the nature or the amount of the newly proposed claims.
However, the court dismissed FTX’s objections, siding with 3AC’s liquidators and approving the expanded claim. Additionally, the court found that much of the delay in filing the amended claim was attributable to FTX’s failure to provide the necessary documents to the liquidators promptly.
“Having considered all the evidence presented, I find that the balance of the equities is in favor of allowing the Amended POC,” Judge Dorsey noted.
This latest development occurs alongside Bankman-Fried’s ongoing efforts to secure a pardon from President Donald Trump. To strengthen his case, Bankman-Fried has sought to align himself with right-wing figures.
He recently appeared on Tucker Carlson’s show and has reportedly consulted with a lawyer linked to Trump. Despite Trump’s history of pardons, skepticism remains due to SBF’s lack of support in the crypto community.
Disclaimer
In adherence to the Trust Project guidelines, BeInCrypto is committed to unbiased, transparent reporting. This news article aims to provide accurate, timely information. However, readers are advised to verify facts independently and consult with a professional before making any decisions based on this content. Please note that our Terms and Conditions, Privacy Policy, and Disclaimers have been updated.


Aayush Jindal, a luminary in the world of financial markets, whose expertise spans over 15 illustrious years in the realms of Forex and cryptocurrency trading. Renowned for his unparalleled proficiency in providing technical analysis, Aayush is a trusted advisor and senior market expert to investors worldwide, guiding them through the intricate landscapes of modern finance with his keen insights and astute chart analysis.
From a young age, Aayush exhibited a natural aptitude for deciphering complex systems and unraveling patterns. Fueled by an insatiable curiosity for understanding market dynamics, he embarked on a journey that would lead him to become one of the foremost authorities in the fields of Forex and crypto trading. With a meticulous eye for detail and an unwavering commitment to excellence, Aayush honed his craft over the years, mastering the art of technical analysis and chart interpretation.
As a software engineer, Aayush harnesses the power of technology to optimize trading strategies and develop innovative solutions for navigating the volatile waters of financial markets. His background in software engineering has equipped him with a unique skill set, enabling him to leverage cutting-edge tools and algorithms to gain a competitive edge in an ever-evolving landscape.
In addition to his roles in finance and technology, Aayush serves as the director of a prestigious IT company, where he spearheads initiatives aimed at driving digital innovation and transformation. Under his visionary leadership, the company has flourished, cementing its position as a leader in the tech industry and paving the way for groundbreaking advancements in software development and IT solutions.
Despite his demanding professional commitments, Aayush is a firm believer in the importance of work-life balance. An avid traveler and adventurer, he finds solace in exploring new destinations, immersing himself in different cultures, and forging lasting memories along the way. Whether he’s trekking through the Himalayas, diving in the azure waters of the Maldives, or experiencing the vibrant energy of bustling metropolises, Aayush embraces every opportunity to broaden his horizons and create unforgettable experiences.
Aayush’s journey to success is marked by a relentless pursuit of excellence and a steadfast commitment to continuous learning and growth. His academic achievements are a testament to his dedication and passion for excellence, having completed his software engineering with honors and excelling in every department.
At his core, Aayush is driven by a profound passion for analyzing markets and uncovering profitable opportunities amidst volatility. Whether he’s poring over price charts, identifying key support and resistance levels, or providing insightful analysis to his clients and followers, Aayush’s unwavering dedication to his craft sets him apart as a true industry leader and a beacon of inspiration to aspiring traders around the globe.
In a world where uncertainty reigns supreme, Aayush Jindal stands as a guiding light, illuminating the path to financial success with his unparalleled expertise, unwavering integrity, and boundless enthusiasm for the markets.

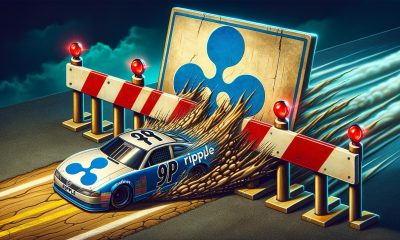
Ripple’s recently acquired Hidden Road has secured a broker-dealer license from the Financial Industry Regulatory Authority (FINRA). This marks a significant milestone in expanding its prime brokerage services for institutional investors.
Market watchers see it as a deliberate strategy by Ripple to build infrastructure and position itself for future growth. That being said, traders are expecting that XRP’s value will rise later.
Ripple Expands Institutional Presence with Hidden Road’s FINRA License
According to the latest press release, Hidden Road Partners CIV US LLC was granted approval. The license now enables the firm to provide a broader suite of regulatory-compliant services, including clearing, financing, and prime brokerage for fixed-income assets to institutions.
Noel Kimmel, President of Hidden Road, highlighted that the license was a pivotal development for the company. According to him, it enhances Hidden Road’s ability to operate in traditional financial (TradFi) markets.
“As a FINRA member, we will be able to bring our best-in-class, technology-driven fixed income service offering to an expanded universe of institutional clients. Our business has tremendous momentum, and we look forward to continuing to provide superior execution and support to our clients amidst today’s exceptionally dynamic market environment,” Kimmel said.
The FINRA approval follows Ripple’s $1.25 billion acquisition of Hidden Road. Announced on April 8, 2025, this was one of the largest deals in the digital assets sector.
The move positions Ripple as the first cryptocurrency company to own a global, multi-asset prime broker. Experts believe the acquisition and subsequent license are part of a broader strategy Ripple is employing.
“Hidden Road just secured a broker-dealer license right after Ripple’s acquisition. This isn’t a coincidence, it’s a statement. XRP is not playing checkers. It’s playing regulatory chess,” an analyst wrote on X (formerly Twitter).
Is Ripple Behind XRP’s Low Price? Analyst Thinks So
In fact, analysts also claim that XRP’s neutral reaction to recent milestones isn’t a sign of weakness but rather a strategic move. In a recent analysis, crypto analyst Levi argued that the current price of XRP, hovering around $2, is not coincidental, but rather a result of Ripple’s deliberate approach.
He suggested that the low price is designed to allow Ripple to operate under the radar while making key strategic moves, such as the Hidden Road acquisition.
“Hidden Road isn’t a flex. It’s infrastructure. It’s the final puzzle piece — giving Ripple a fully integrated, lightning-fast, global value settlement system,” he stated.
The analyst emphasized that while the public focused on Ripple’s legal battles with the SEC, the company quietly built its global value settlement system behind the scenes.
“XRP at $2 isn’t undervalued — it’s deliberately suppressed. When the switch flips, the revaluation won’t be gradual — it’ll be instant,” Levi noted.
In his view, those who have invested early will be positioned to benefit as the market shifts. Meanwhile, XRP, after hitting an all-time high earlier this year, has continued to decline.

At press time, the altcoin was trading at $2.0. According to BeInCrypto data, this represented a decline of 1.0% over the past day.
Disclaimer
In adherence to the Trust Project guidelines, BeInCrypto is committed to unbiased, transparent reporting. This news article aims to provide accurate, timely information. However, readers are advised to verify facts independently and consult with a professional before making any decisions based on this content. Please note that our Terms and Conditions, Privacy Policy, and Disclaimers have been updated.

Aayush Jindal, a luminary in the world of financial markets, whose expertise spans over 15 illustrious years in the realms of Forex and cryptocurrency trading. Renowned for his unparalleled proficiency in providing technical analysis, Aayush is a trusted advisor and senior market expert to investors worldwide, guiding them through the intricate landscapes of modern finance with his keen insights and astute chart analysis.
From a young age, Aayush exhibited a natural aptitude for deciphering complex systems and unraveling patterns. Fueled by an insatiable curiosity for understanding market dynamics, he embarked on a journey that would lead him to become one of the foremost authorities in the fields of Forex and crypto trading. With a meticulous eye for detail and an unwavering commitment to excellence, Aayush honed his craft over the years, mastering the art of technical analysis and chart interpretation.
As a software engineer, Aayush harnesses the power of technology to optimize trading strategies and develop innovative solutions for navigating the volatile waters of financial markets. His background in software engineering has equipped him with a unique skill set, enabling him to leverage cutting-edge tools and algorithms to gain a competitive edge in an ever-evolving landscape.
In addition to his roles in finance and technology, Aayush serves as the director of a prestigious IT company, where he spearheads initiatives aimed at driving digital innovation and transformation. Under his visionary leadership, the company has flourished, cementing its position as a leader in the tech industry and paving the way for groundbreaking advancements in software development and IT solutions.
Despite his demanding professional commitments, Aayush is a firm believer in the importance of work-life balance. An avid traveler and adventurer, he finds solace in exploring new destinations, immersing himself in different cultures, and forging lasting memories along the way. Whether he’s trekking through the Himalayas, diving in the azure waters of the Maldives, or experiencing the vibrant energy of bustling metropolises, Aayush embraces every opportunity to broaden his horizons and create unforgettable experiences.
Aayush’s journey to success is marked by a relentless pursuit of excellence and a steadfast commitment to continuous learning and growth. His academic achievements are a testament to his dedication and passion for excellence, having completed his software engineering with honors and excelling in every department.
At his core, Aayush is driven by a profound passion for analyzing markets and uncovering profitable opportunities amidst volatility. Whether he’s poring over price charts, identifying key support and resistance levels, or providing insightful analysis to his clients and followers, Aayush’s unwavering dedication to his craft sets him apart as a true industry leader and a beacon of inspiration to aspiring traders around the globe.
In a world where uncertainty reigns supreme, Aayush Jindal stands as a guiding light, illuminating the path to financial success with his unparalleled expertise, unwavering integrity, and boundless enthusiasm for the markets.

Dogecoin (DOGE) Under Pressure—Bearish Setup Could Trigger Sell-Off

Quantum Researchers Offer 1 Bitcoin To Break ‘Toy Version’

Shiba Inu Follows Crypto Market Trend With “Shib Is For Everyone” Post, What’s Happening?

Is XRP’s Low Price Part of Ripple’s Long-Term Growth Strategy?

XRP Price Weakens—Further Losses on The Table?

Expert Predicts Pi Network Price Volatility After Shady Activity On Banxa

2.52 Million Altcoins Are Ruining Crypto’s Future

Animoca Brands Valuation Tanks 75% In Two Years, Here’s Why

Crypto exchange BingX hacked for $43 million

Are The Big Players Losing Interest?

Hong Kong’s Securities Association Tips Authorities On Crypto Self-Regulation

Coinbase cbBTC Set to go Live on Solana
2.52 Million Altcoins Are Ruining Crypto’s Future
Animoca Brands Valuation Tanks 75% In Two Years, Here’s Why
Crypto exchange BingX hacked for $43 million
Are The Big Players Losing Interest?
Hong Kong’s Securities Association Tips Authorities On Crypto Self-Regulation
Coinbase cbBTC Set to go Live on Solana
-
 Altcoin22 hours ago
How Rising Solana Network Inflows Could Drive SOL Price to $150?
-
 Bitcoin21 hours ago
Gary Gensler Explains Why Bitcoin Will Outlast Altcoins
-

 Market21 hours ago
Bitcoin Whales Withdraw $280 Million: Bullish Signal?
-

 Altcoin13 hours ago
CZ Honors Nearly $1 Billion Token Burn Promise
-

 Market19 hours ago
Expanding Blockspace and Enhancing Privacy
-
 Market17 hours ago
Bitcoin Price Poised for $90,000 Surge
-
 Altcoin24 hours ago
Crypto Whales Bag $20M In AAVE & UNI, Are DeFi Tokens Eyeing Price Rally?
-
 Market22 hours ago
XRP’s $2.00 Pivot Point—A Launchpad or Breakdown Zone?
