
Market
Could Bittensor (TAO) Price Face A Downside?

Bittensor (TAO), one of the leading artificial intelligence coins in the market, is currently showing signs of consolidation. Market indicators suggest indecision, with neither buyers nor sellers taking firm control.
TAO’s movement appears range-bound, lacking clear momentum to either break higher or fall significantly lower. The EMA lines suggest the possibility of a “death cross,” which could spark a significant correction if the market loses momentum further.
TAO Ichimoku Cloud Shows Consolidation
The Ichimoku Cloud chart for TAO shows a mixed picture of the current market conditions. The price is currently trading near the cloud, suggesting indecision.
The cloud itself (Kumo) is mostly flat and has both green and red areas, indicating an overall neutral trend. The price recently tried to break above the cloud, but failed to gain significant upward momentum, indicating resistance.
Read more: How To Invest in Artificial Intelligence (AI) Cryptocurrencies?
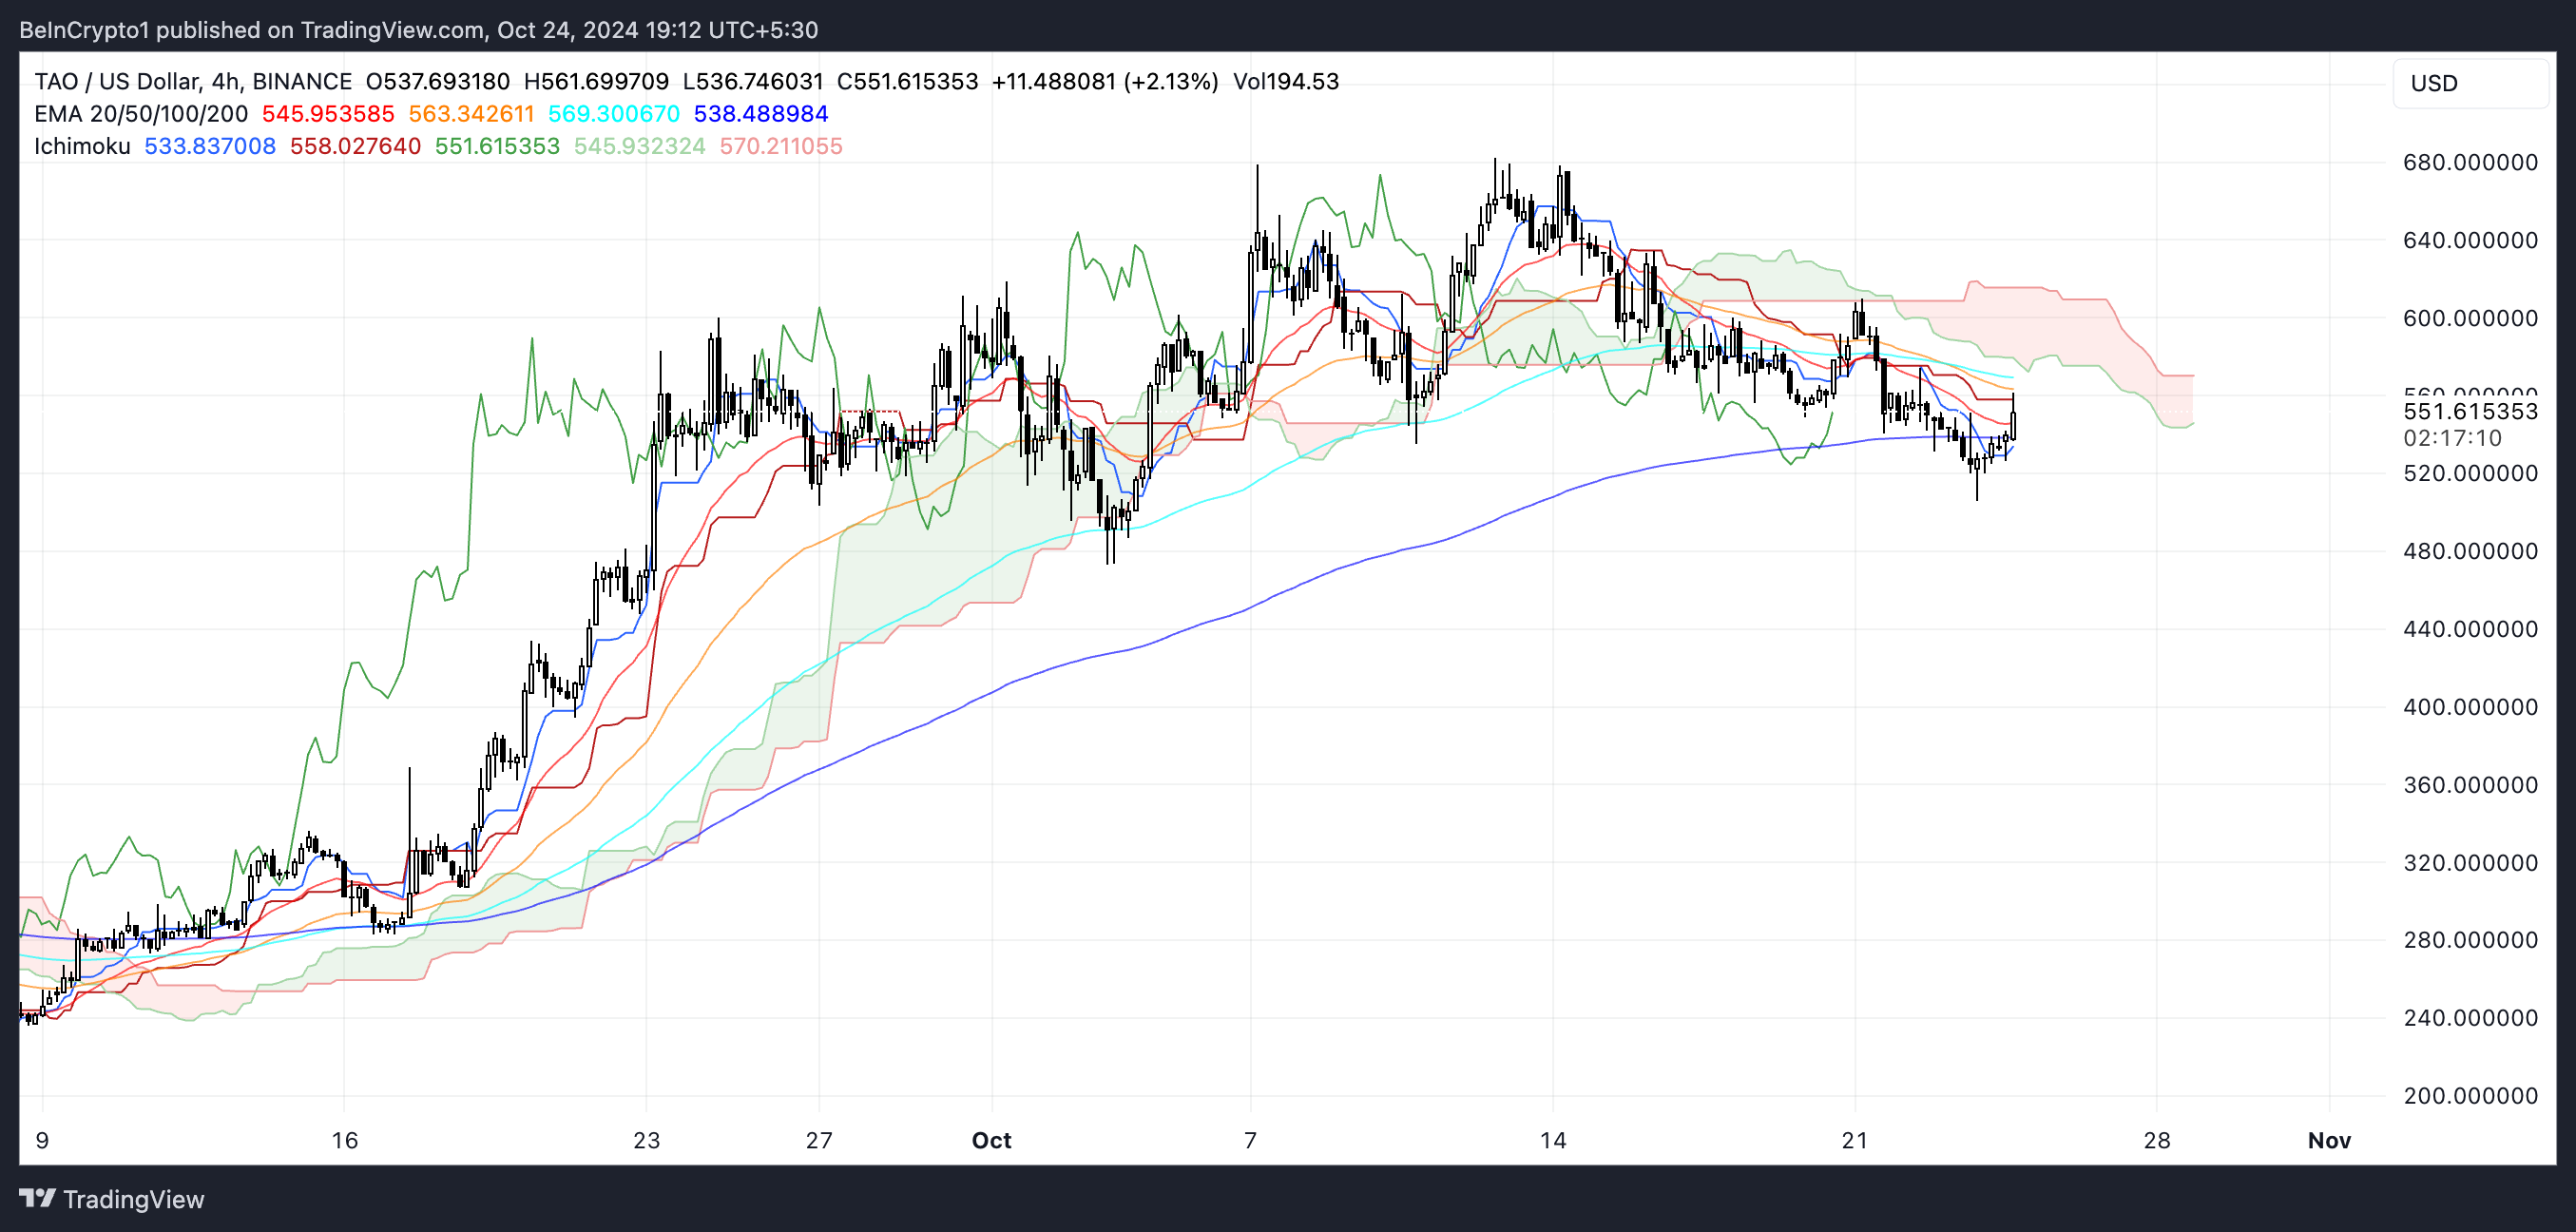
The Tenkan-sen (Conversion Line) and Kijun-sen (Base Line) intersect near the current price, suggesting the market is looking for direction. The leading span A and leading span B, which form the cloud, are not diverging sharply, pointing to potential range-bound movement.
If TAO, which is the biggest artificial intelligence coin in the market today, can break decisively above the cloud, it could indicate a bullish shift. Conversely, a fall below the lower cloud boundary would suggest a bearish trend. At the moment, the market appears hesitant, with buyers and sellers evenly matched, leading to sideways movement.
Bittensor RSI Is Back To 50
TAO’s RSI is currently at 50, rising from 31 just a day ago. This swift movement suggests renewed buying pressure, bringing market sentiment to a neutral level.
A jump from oversold conditions to a midpoint like this often implies a shift away from strong bearishness but not necessarily toward bullish dominance yet.
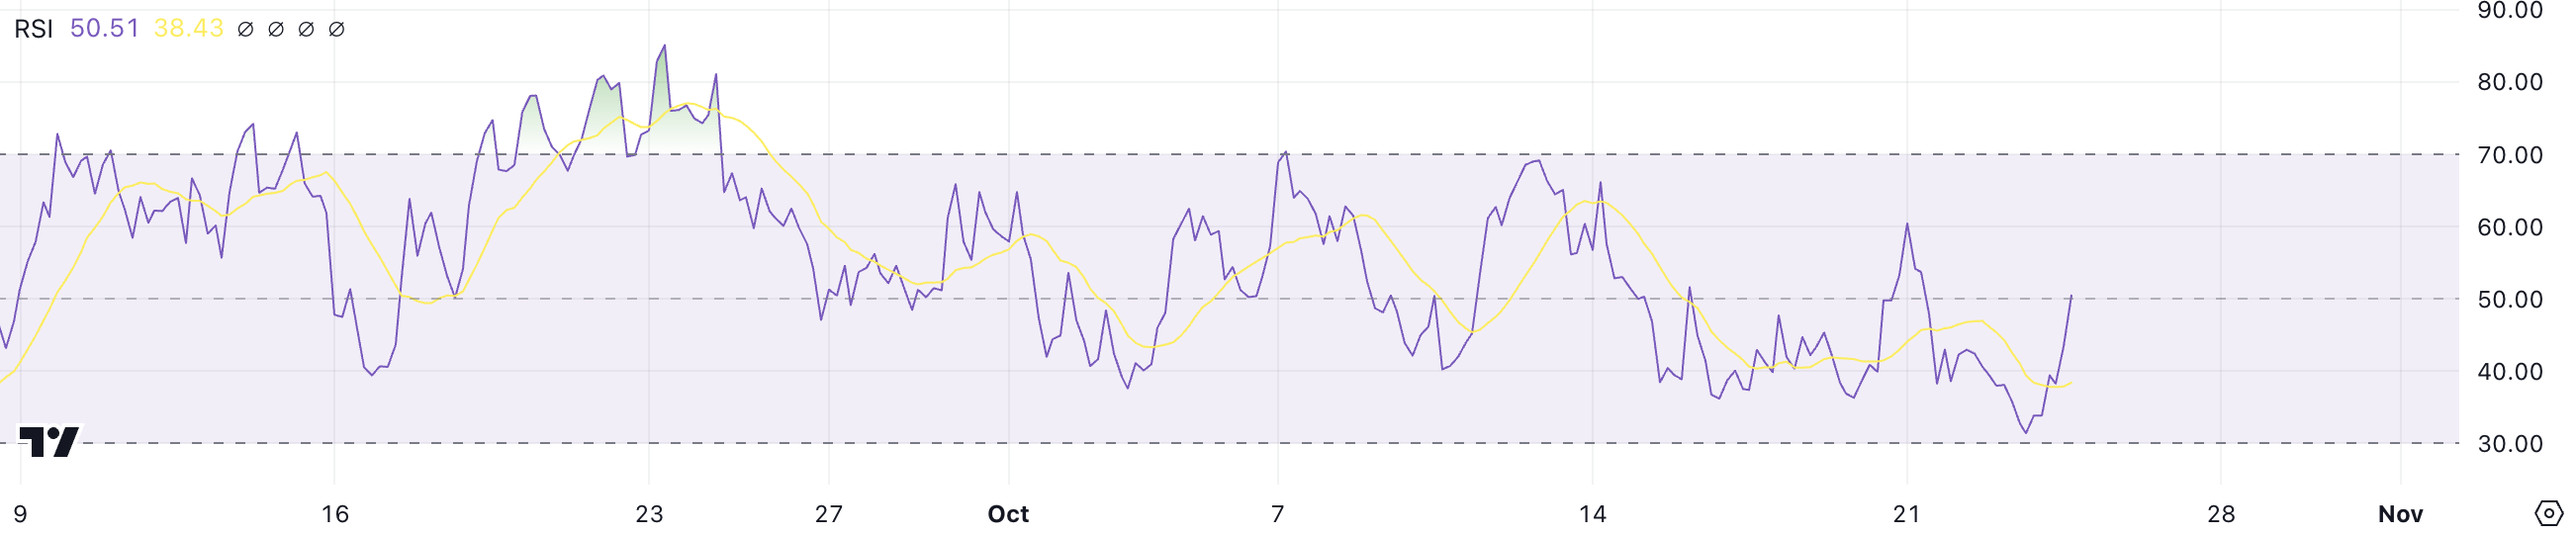
The Relative Strength Index (RSI) measures momentum by indicating whether an asset is overbought or oversold. An RSI of 50 means that the market sentiment for TAO is currently balanced.
At this level, there is no strong bias towards buying or selling, suggesting that the price might consolidate until new catalysts drive momentum in either direction.
TAO Price Prediction: No $700 Level in the Near Term
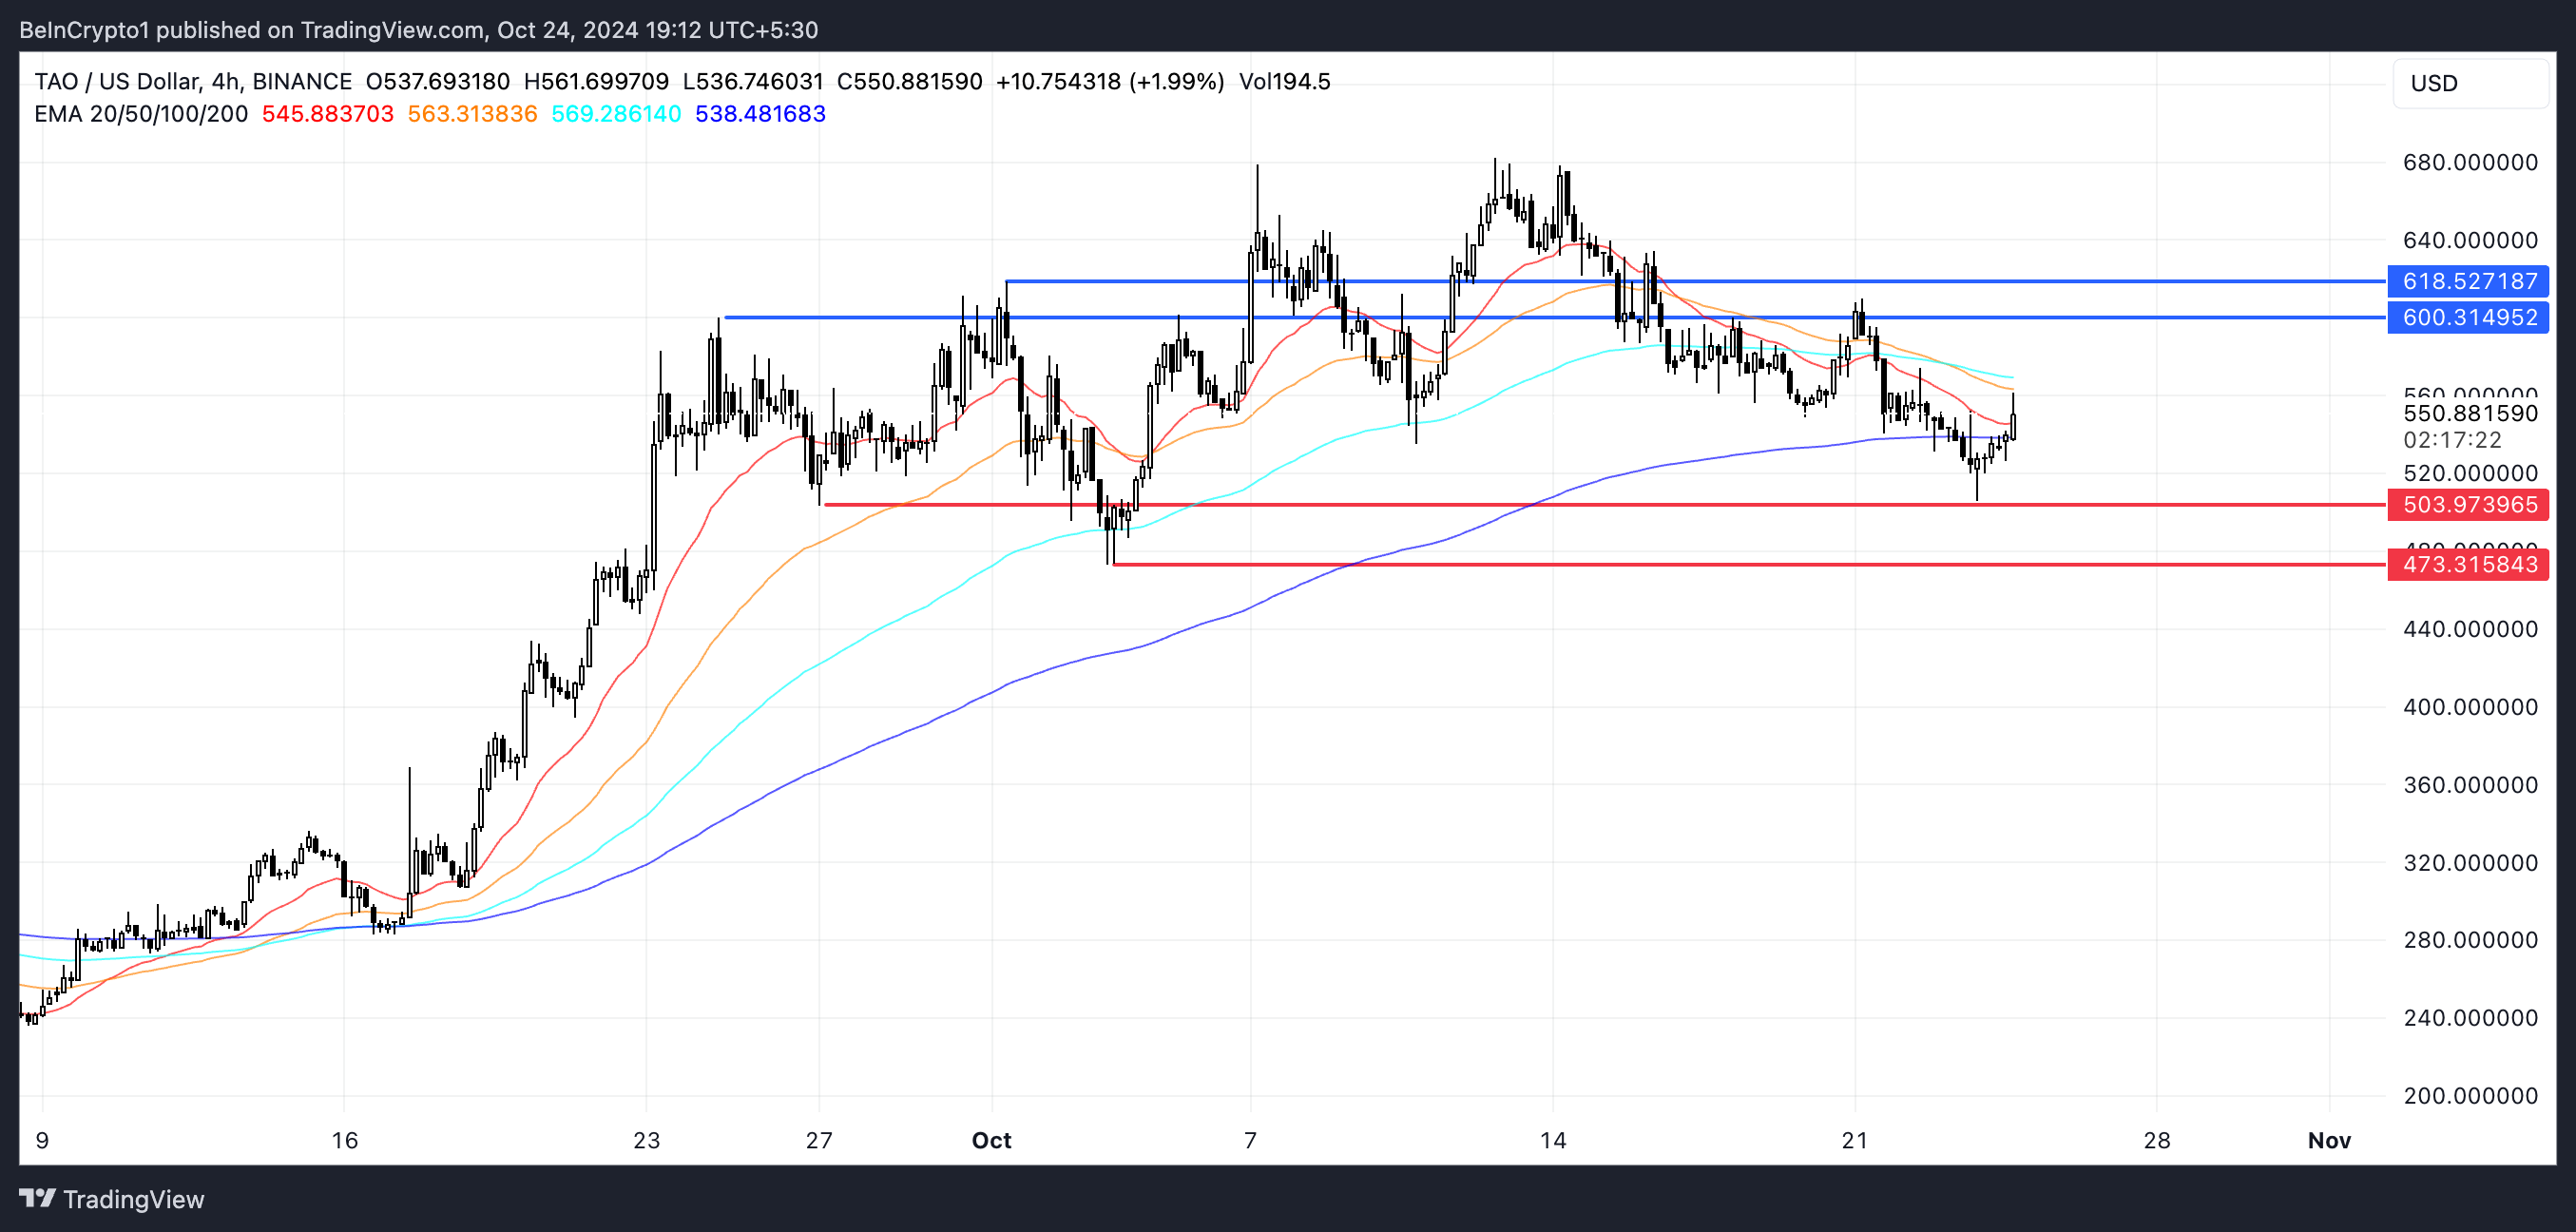
The TAO price chart shows that the price is currently in a consolidation phase, trading between key support and resistance levels. Resistance lies at $600 and $618, where previous attempts to break above have failed, while the support levels at $503 and $473 are holding for now, providing a cushion against further downside.
The EMA lines also reflect this sideways action, with the short-term EMAs getting closer to the long-term ones, indicating reduced bullish momentum.
Read more: Top 9 Artificial Intelligence (AI) Cryptocurrencies in 2024
The short-term EMA lines are on the verge of crossing below the long-term EMA lines, which, if confirmed, could form a “death cross.” A death cross typically signals a bearish reversal, implying that downward pressure could intensify and trigger a significant correction.
If TAO price can recover its uptrend, it could test the resistances at $600 and $618 soon. This would mark a potential 12% price surge. However, if the uptrend isn’t strong enough and the trend is reverted, TAO could go as down as $473, marking a 14% price correction.
Disclaimer
In line with the Trust Project guidelines, this price analysis article is for informational purposes only and should not be considered financial or investment advice. BeInCrypto is committed to accurate, unbiased reporting, but market conditions are subject to change without notice. Always conduct your own research and consult with a professional before making any financial decisions. Please note that our Terms and Conditions, Privacy Policy, and Disclaimers have been updated.


Ethereum has experienced a challenging month and a half, with its price nearing a 17-month low at $1,802 at the time of writing. Despite this ongoing downtrend, which nearly sent ETH into a bear market, key investors have remained optimistic.
As Ethereum approaches these significant levels, many market participants believe that a price rebound could be on the horizon.
Ethereum Investors Capitalize On Low Prices
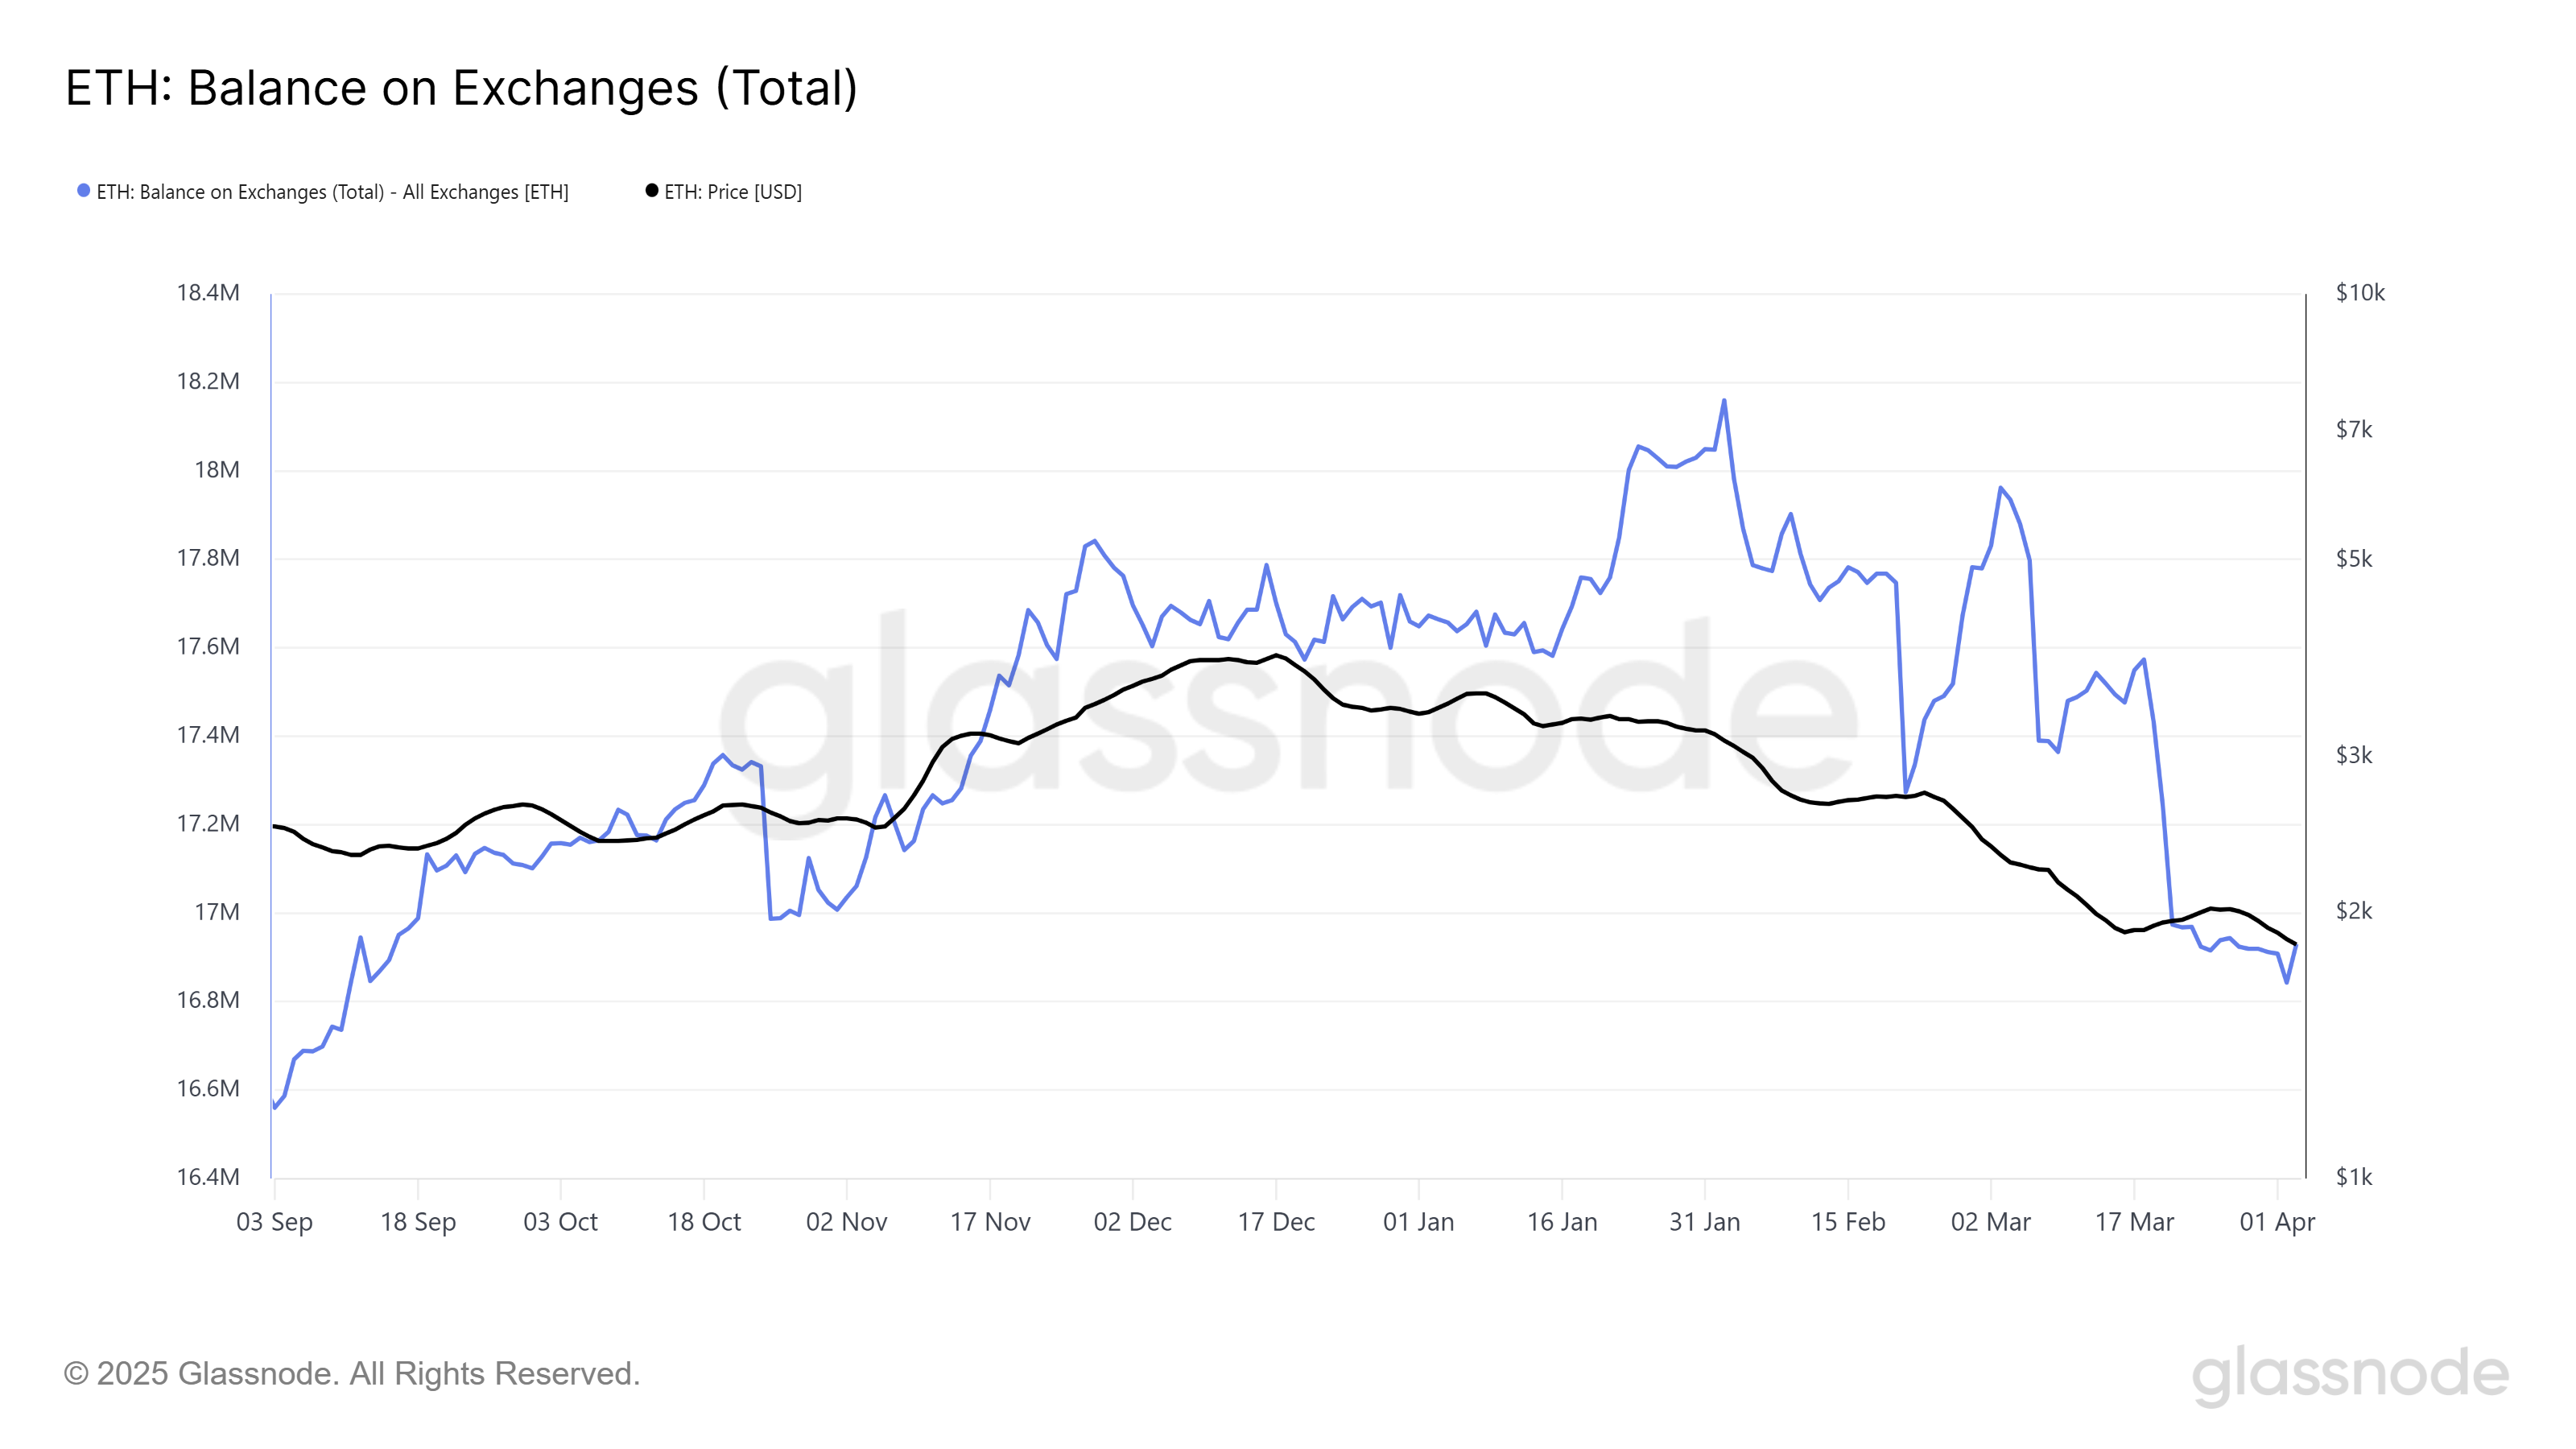
Ethereum’s supply on exchanges has dropped to a six-month low, indicating that investors are increasingly holding their assets off the market. This drop in exchange supply is often seen as a bullish sign because it suggests that long-term holders (LTHs) are accumulating more ETH at these low price levels, anticipating future price appreciation.
These investors are not willing to sell, demonstrating strong conviction in Ethereum’s long-term value. The decrease in exchange balances also indicates less short-term trading activity. This suggests that many investors are waiting for the price to rebound before making any moves.
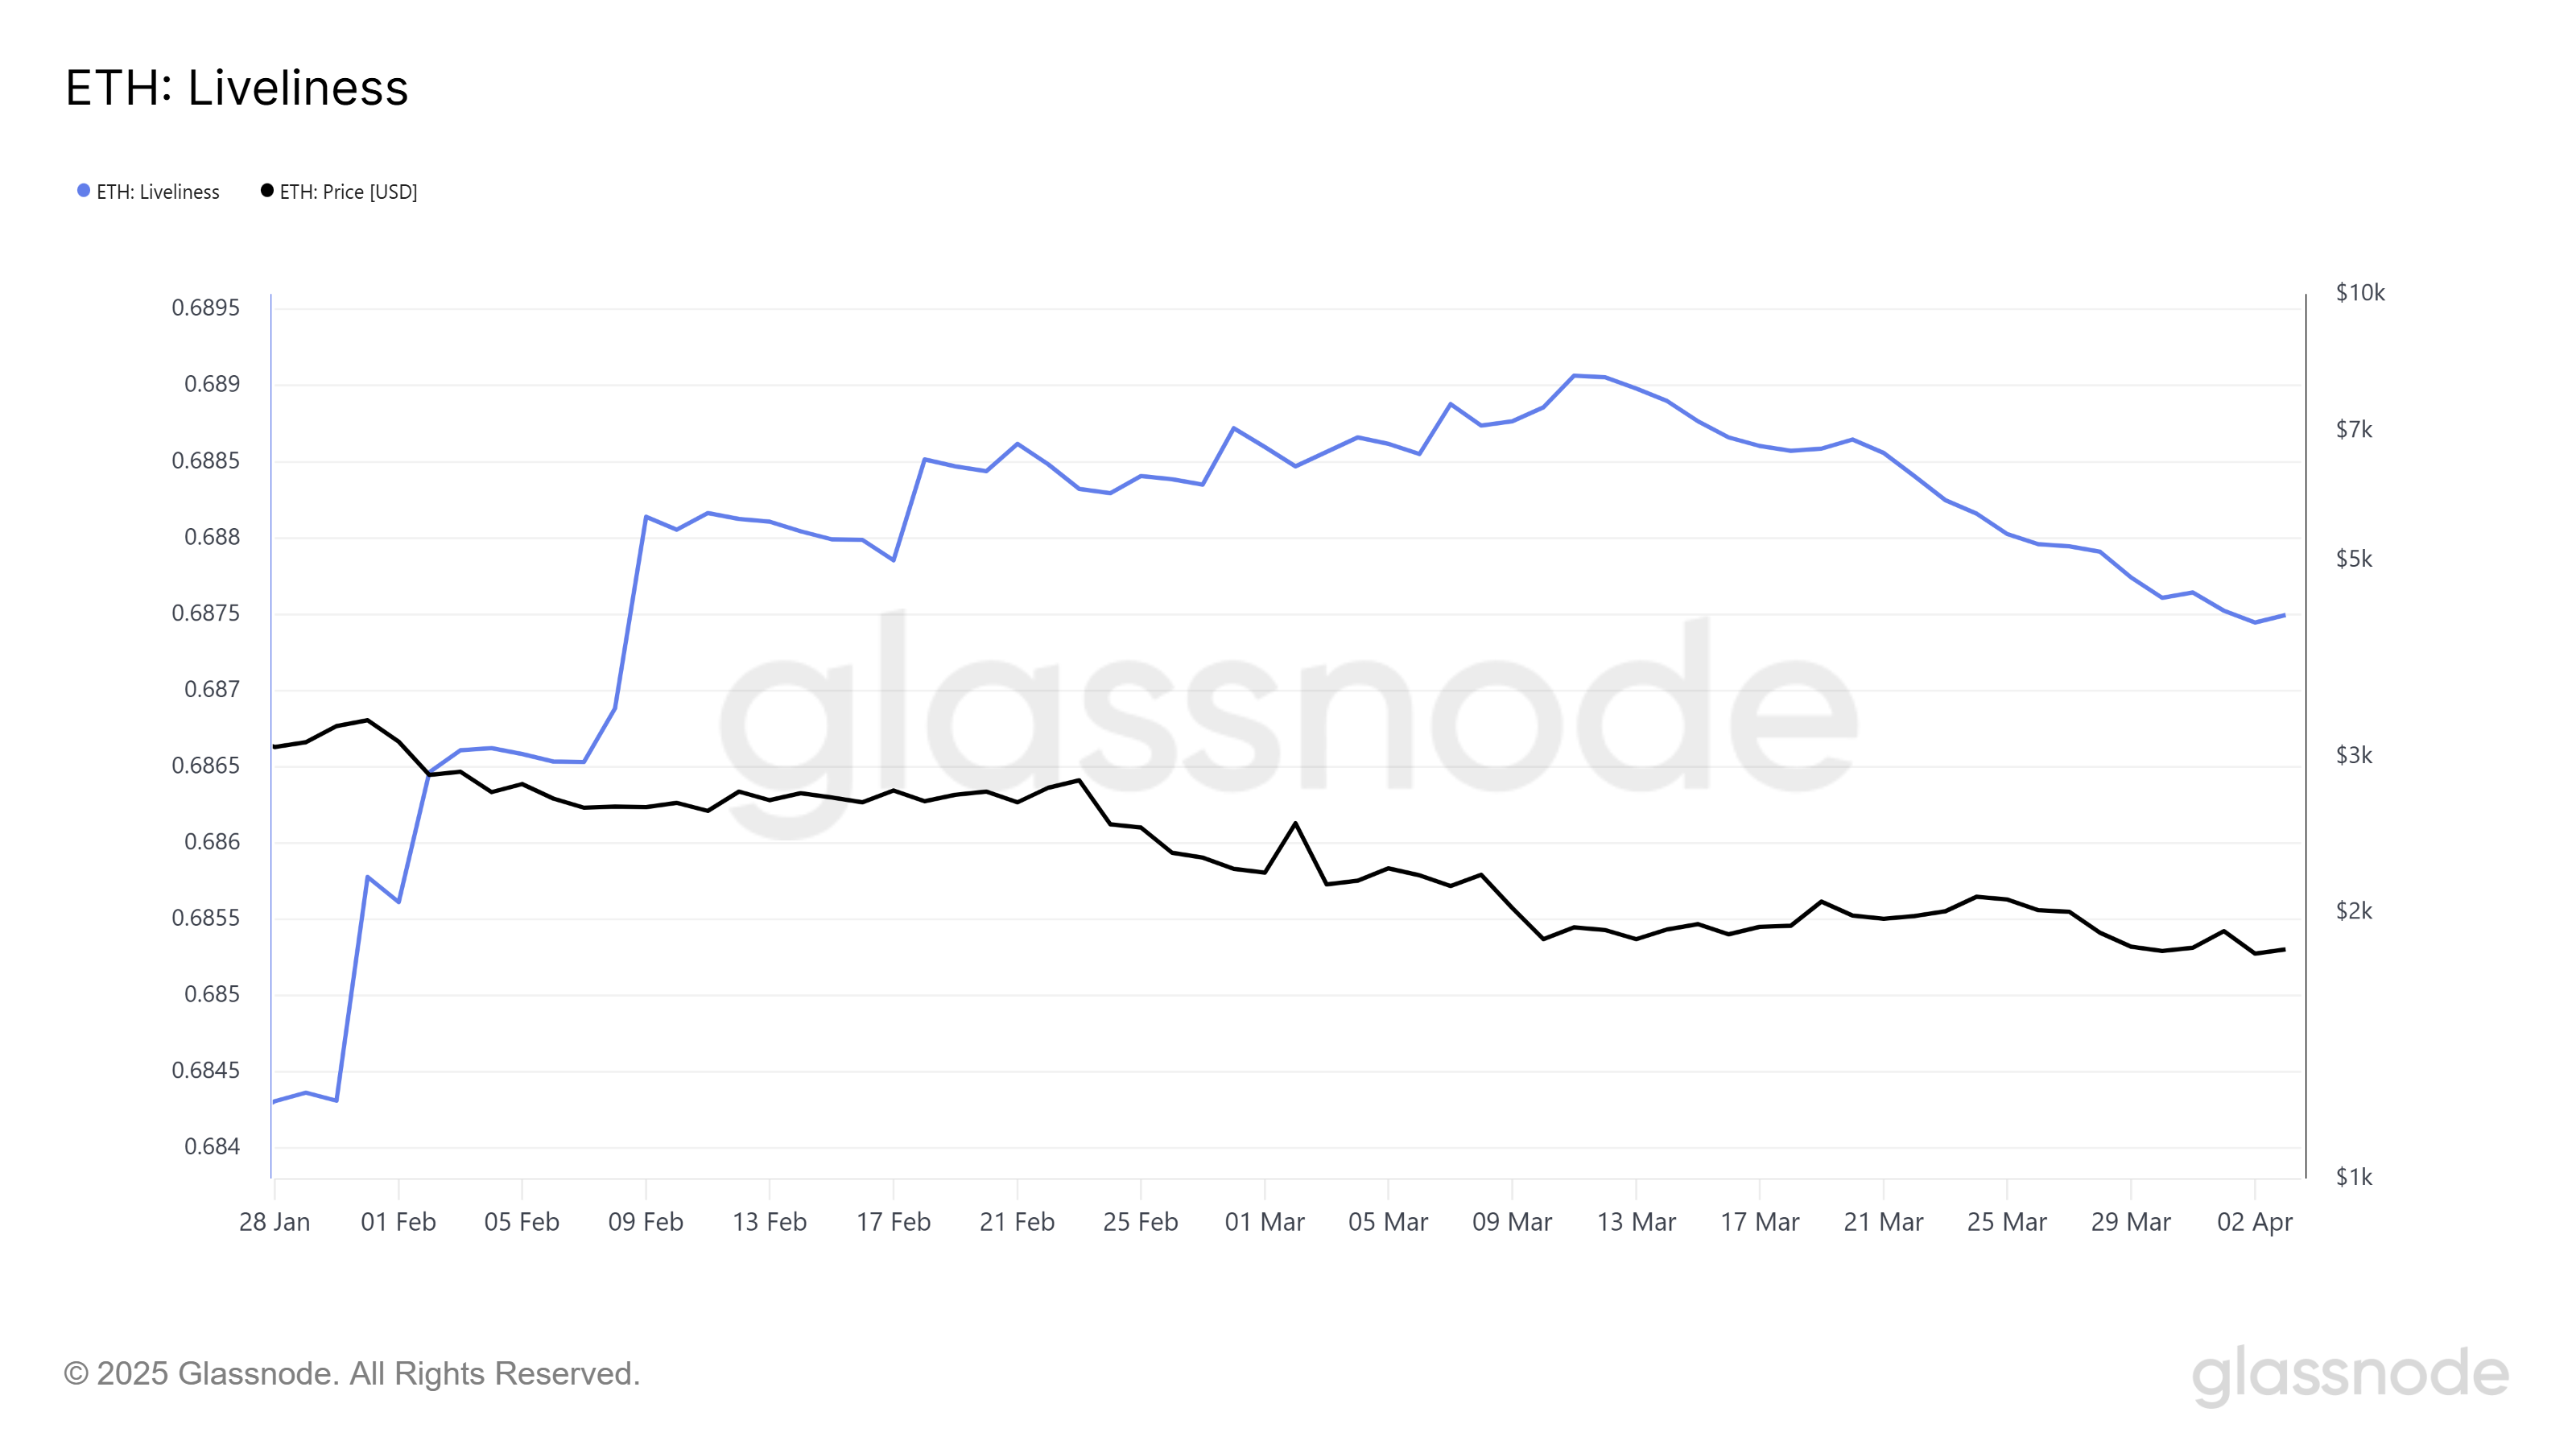
Over the past month, Ethereum’s Liveliness indicator has declined, signaling that the selling pressure is weakening. Liveliness measures the activity of long-term holders, and a decline generally points to accumulation rather than selling.
This drop reflects the growing sentiment among Ethereum’s long-term investors, who are increasing their holdings and expecting the price to recover in the future. The decline in Liveliness suggests that many are confident in Ethereum’s fundamentals and are less concerned about short-term fluctuations.
This accumulation phase suggests that Ethereum’s market sentiment may be shifting. The confidence of LTHs—who hold significant influence over the asset’s price—could lead to a strong upward momentum once the market conditions improve.
ETH Price Needs A Nudge
Ethereum is currently trading at $1,802, just below the resistance level of $1,862. The price has been stuck under this barrier for six weeks, continuing the downtrend that has defined much of the recent price action. However, if Ethereum can break above $1,862, it could signal the end of the downtrend and the start of a price recovery.
Given the current market sentiment and accumulation by key holders, it is possible that Ethereum will continue to gain upward momentum. If Ethereum successfully breaks through the $1,862 resistance, it could move toward the $2,000 mark, regaining some of the losses from the previous weeks.

On the other hand, should the bearish sentiment intensify, Ethereum’s price may dip further toward its 17-month low of $1,745. Failure to secure support at this level could lead to even greater losses. This could extend the recent downtrend and leave many investors exposed to a prolonged bearish market.
Disclaimer
In line with the Trust Project guidelines, this price analysis article is for informational purposes only and should not be considered financial or investment advice. BeInCrypto is committed to accurate, unbiased reporting, but market conditions are subject to change without notice. Always conduct your own research and consult with a professional before making any financial decisions. Please note that our Terms and Conditions, Privacy Policy, and Disclaimers have been updated.

PENDLE has surged by 10% in the past 24 hours, making it the market’s top gainer during this period. The altcoin has even outperformed major cryptocurrencies like Bitcoin (BTC) and Ethereum (ETH).
With buying activity still underway, the PENDLE token is poised to extend its uptrend in the short term.
PENDLE Soars 43% After March Lows
PENDLE cratered to a seven-month low of $1.81 on March 11. As sellers got exhausted, the token’s buyers regained dominance and drove a rally. Trading at $3.24 at press time, PENDLE’s value has since climbed 43%.
The double-digit surge in the altcoin’s price has pushed it above the Leading Spans A and B of its Ichimoku Cloud indicator. They now form dynamic support levels below PENDLE’s price at $2.73 and $2.80, respectively.
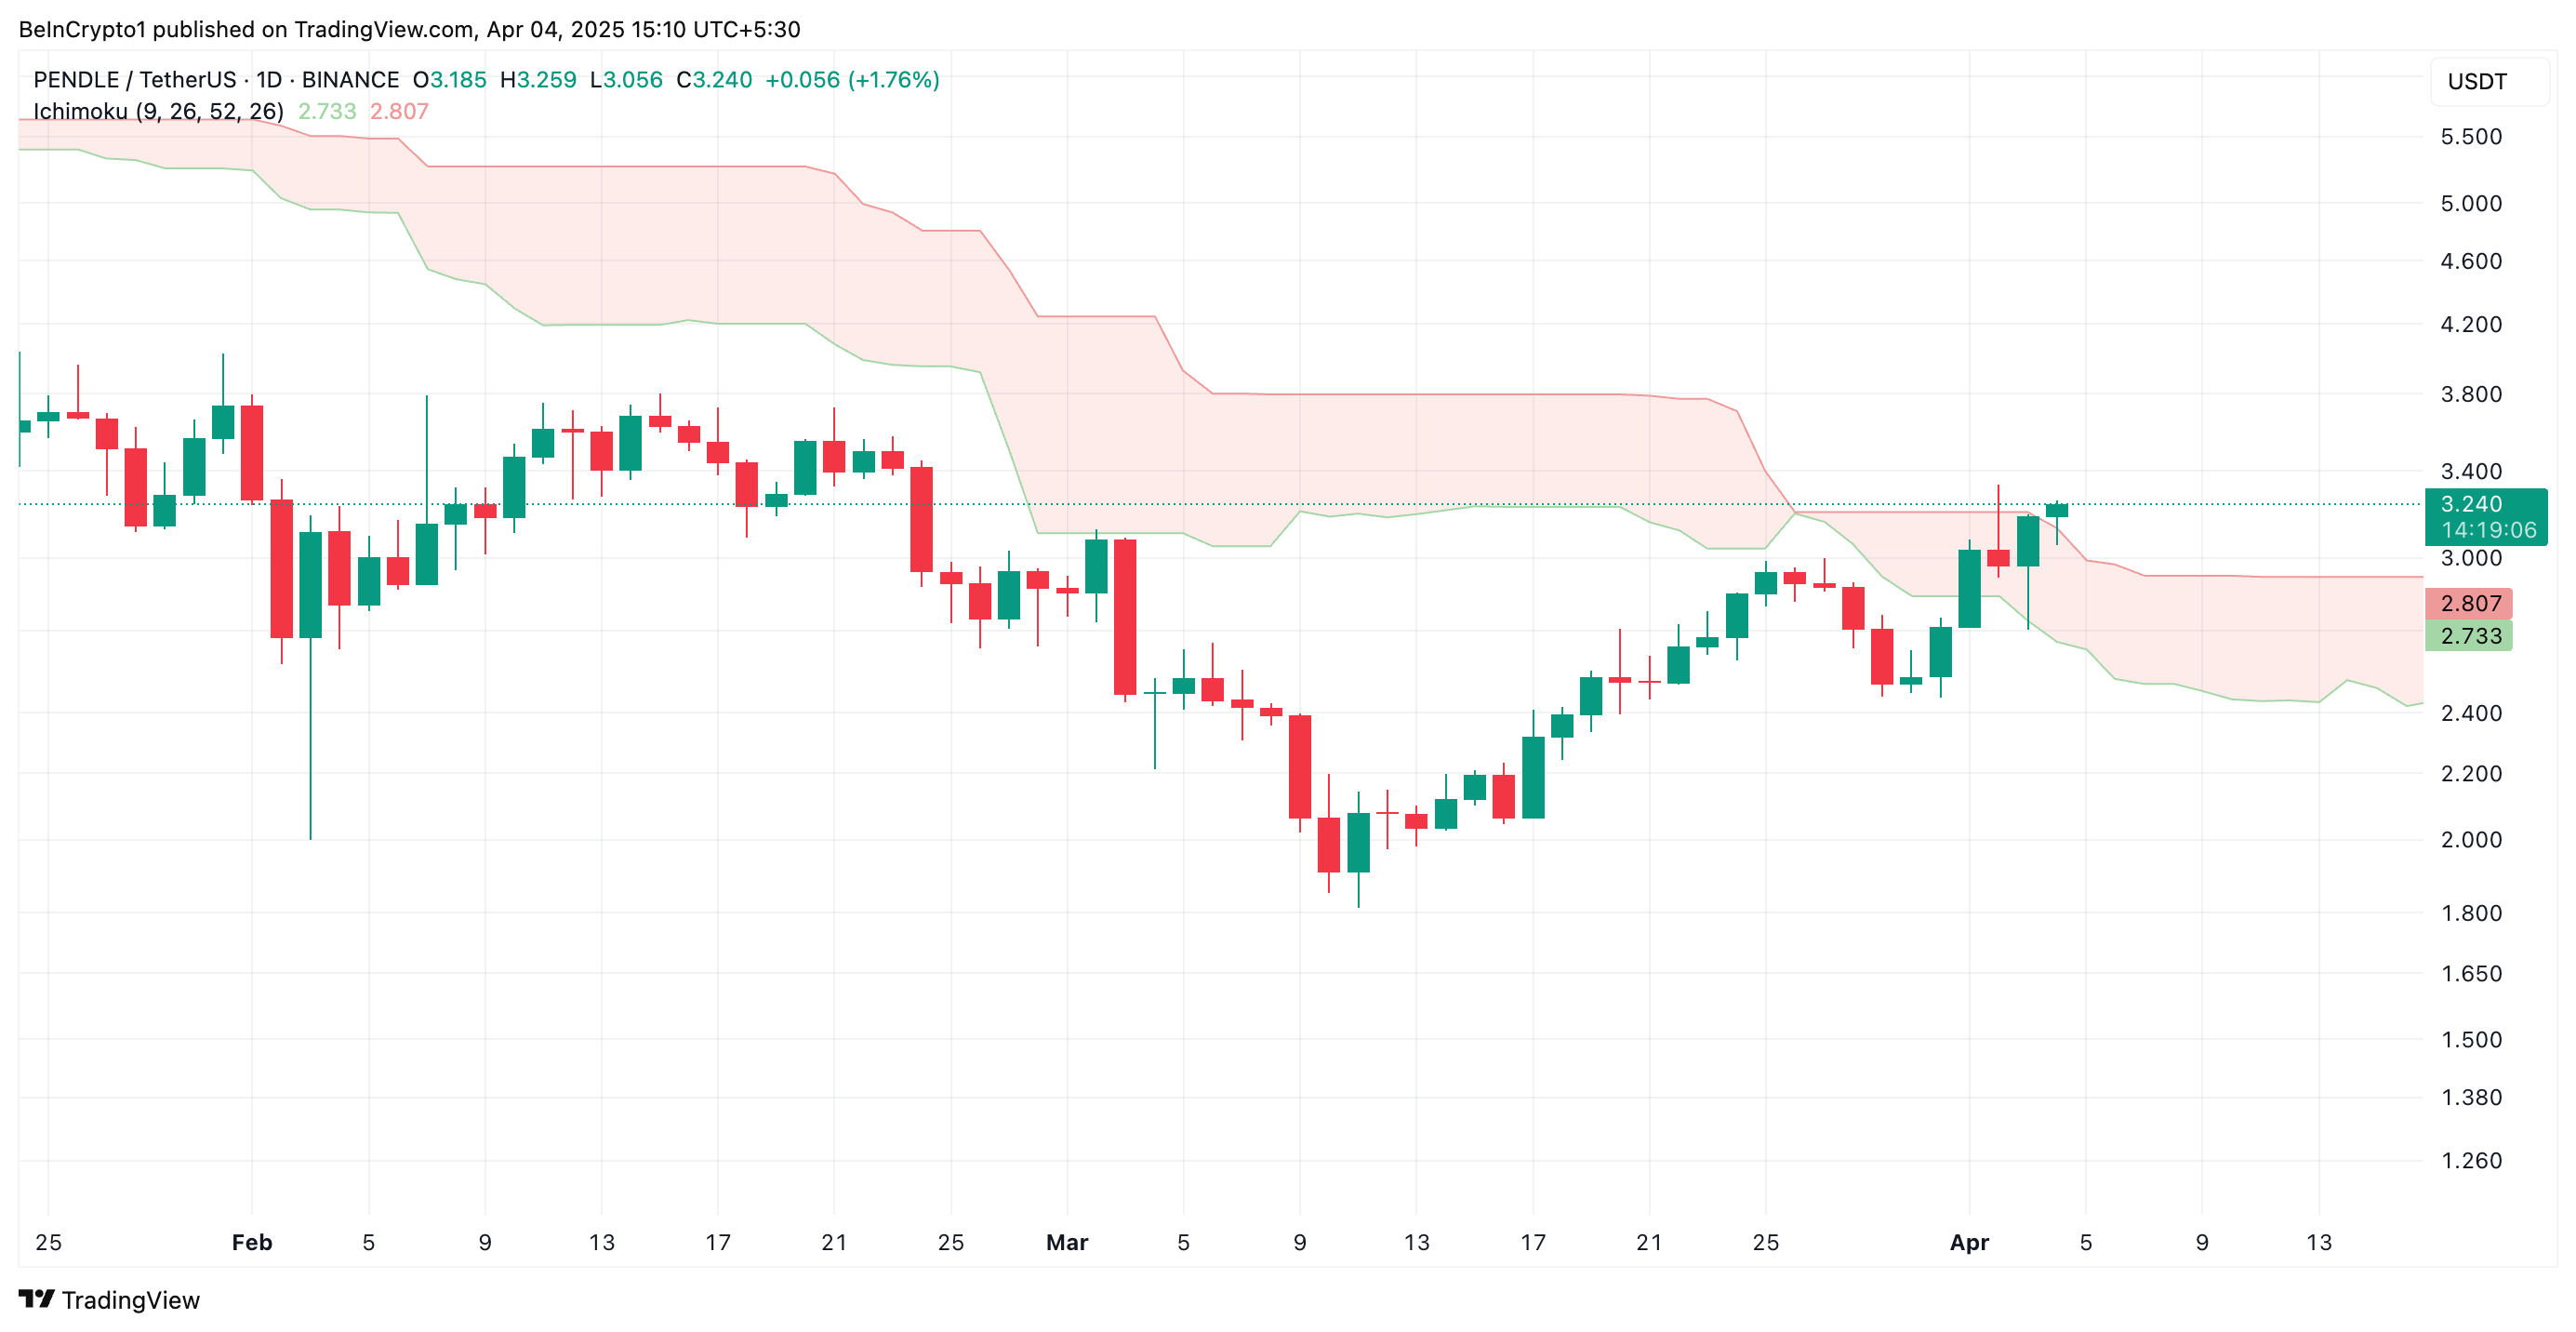
The Ichimoku Cloud tracks the momentum of an asset’s market trends and identifies potential support/resistance levels. When an asset trades above the leading spans A and B of this indicator, its price is in a strong bullish trend. The area above the Cloud is considered a “bullish zone,” indicating that market sentiment is positive, with PENDLE buyers in control.
This pattern suggests that the token’s price could continue to rise, with the Cloud acting as a support level if prices pull back.
In addition, PENDLE currently trades above its Super Trend indicator, confirming the likelihood of extended gains.
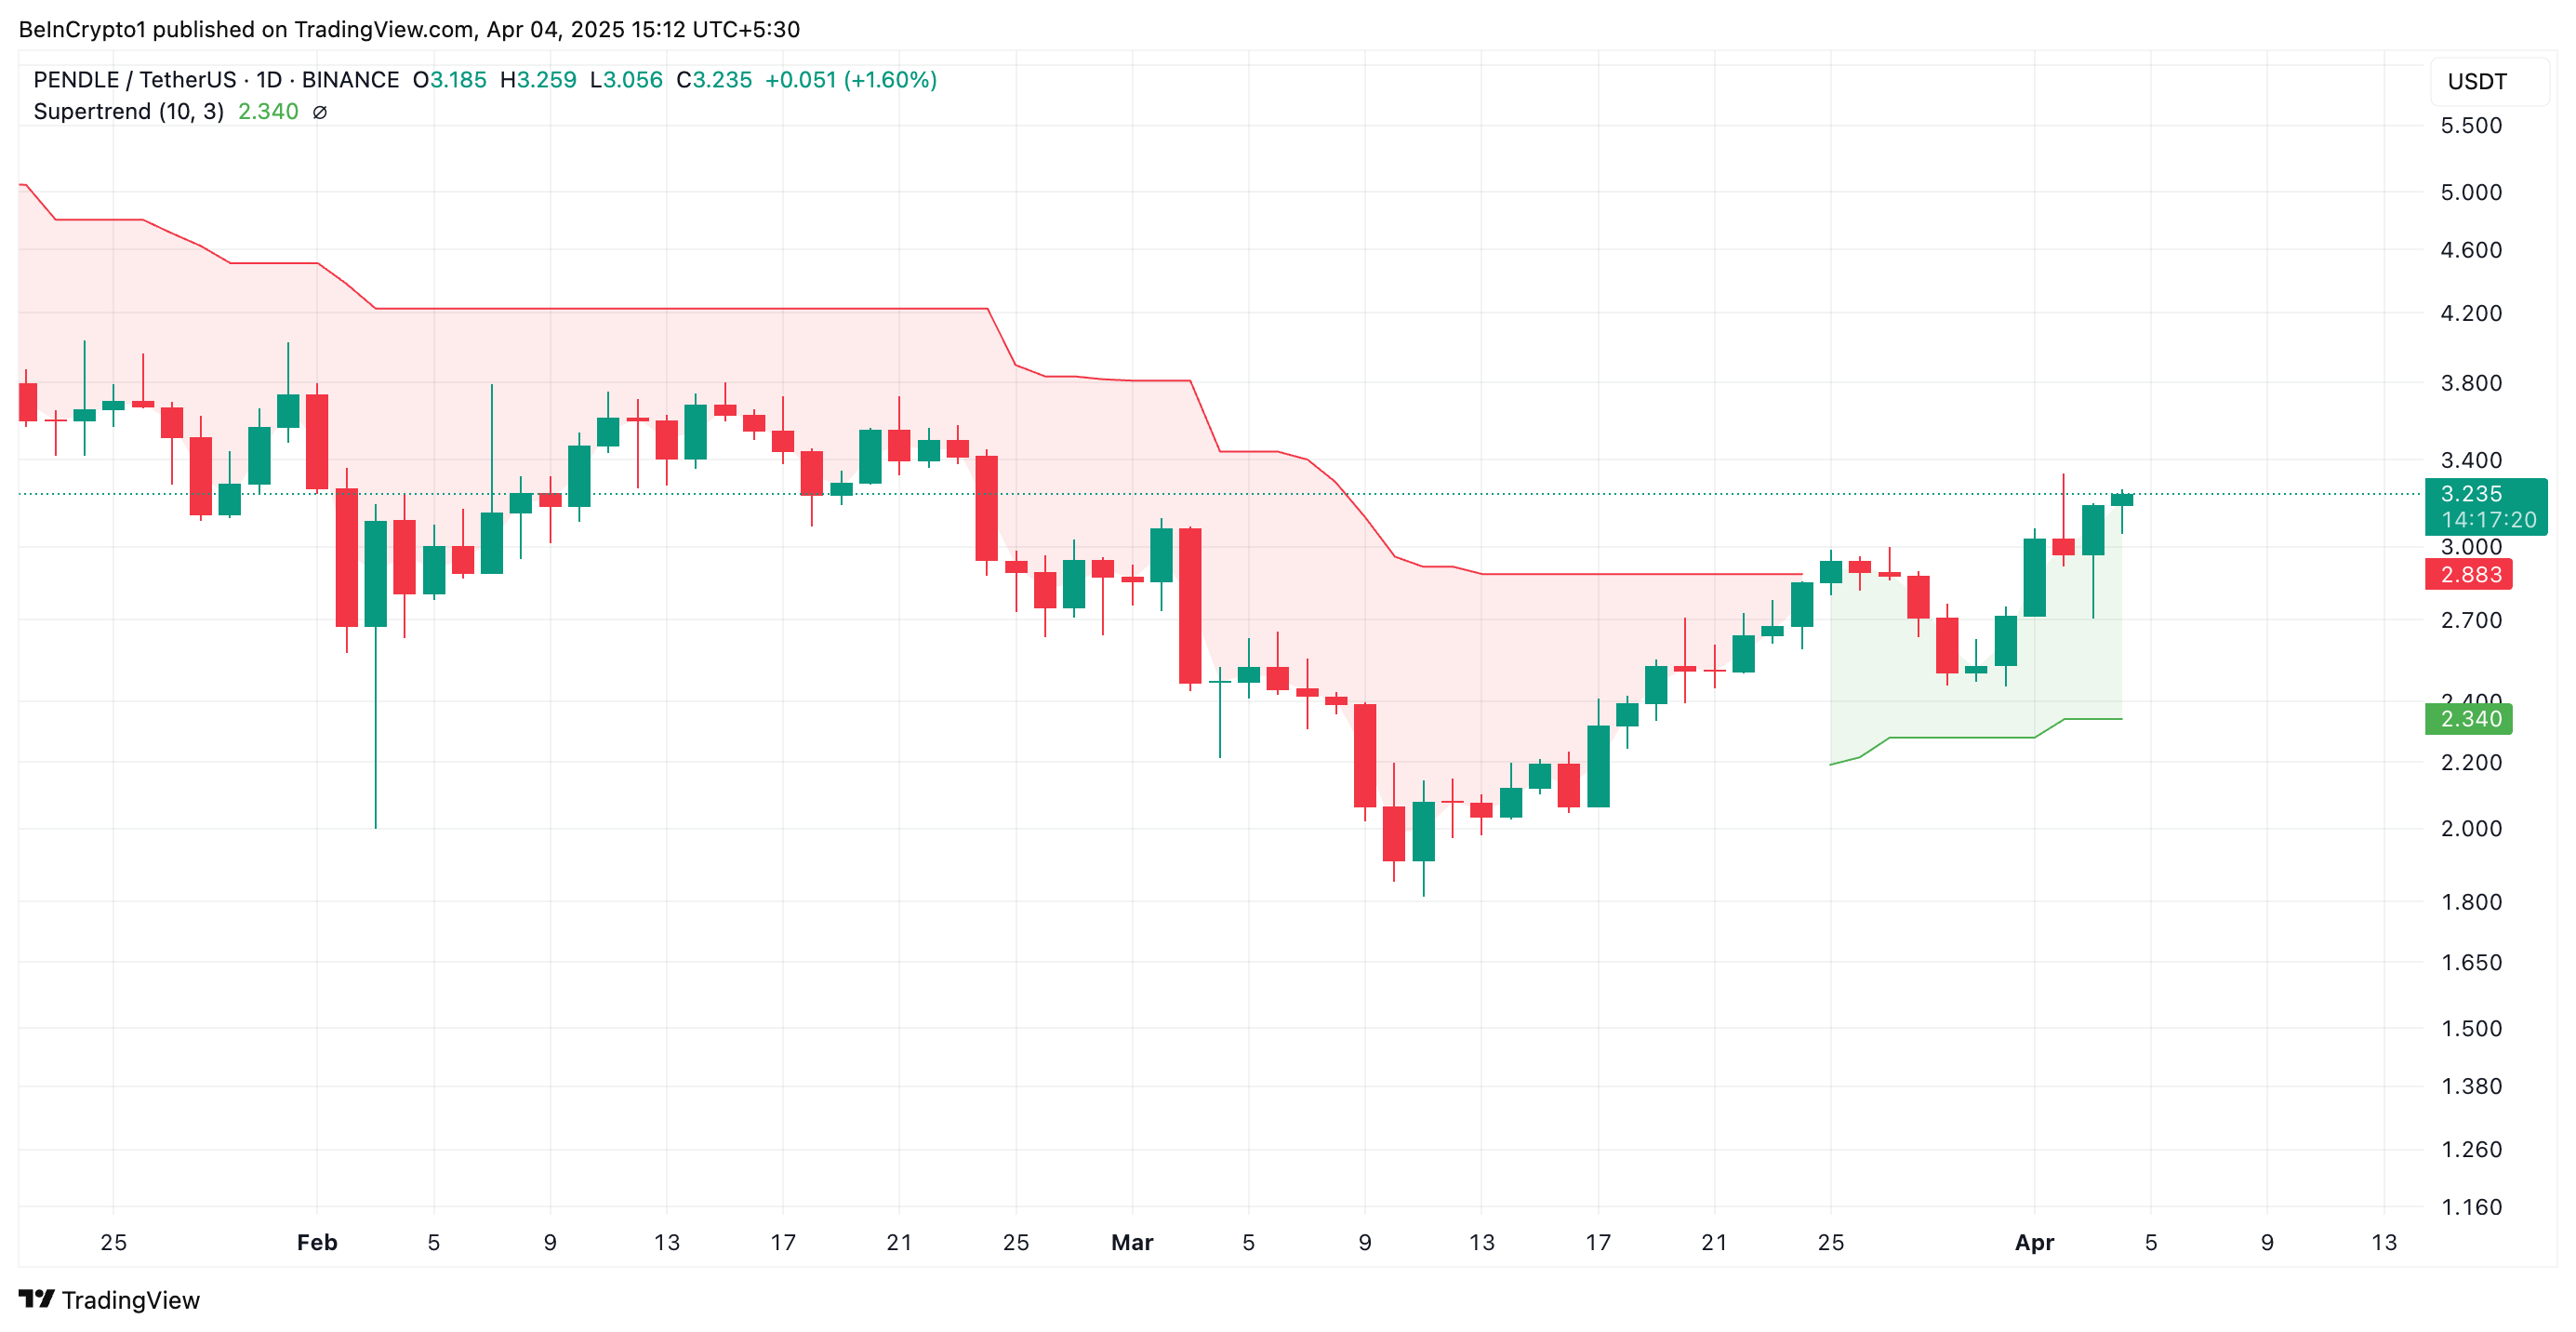
The Super Trend indicator tracks the direction and strength of an asset’s price trend. It is displayed as a line on the price chart, changing color to signify the trend: green for an uptrend and red for a downtrend.
If an asset’s price is above this line, it signals bullish momentum in the market. In this scenario, this line represents a support level that will prevent the price from any significant dips. For PENDLE, this is formed at $2.34.
PENDLE Holds Above Key Trendline
Since its rally began on March 11, PENDLE has traded above an ascending trendline. This pattern forms when a series of higher lows connect, indicating that the price of an asset is consistently rising over time.
It represents a bullish trend, showing that PENDLE demand exceeds supply, with buyers pushing prices higher.
This trendline acts as a support level. With the token’s price bouncing off the trendline, it signals that the asset is in an uptrend and likely to continue. In this scenario, PENDLE could rally to $3.60.
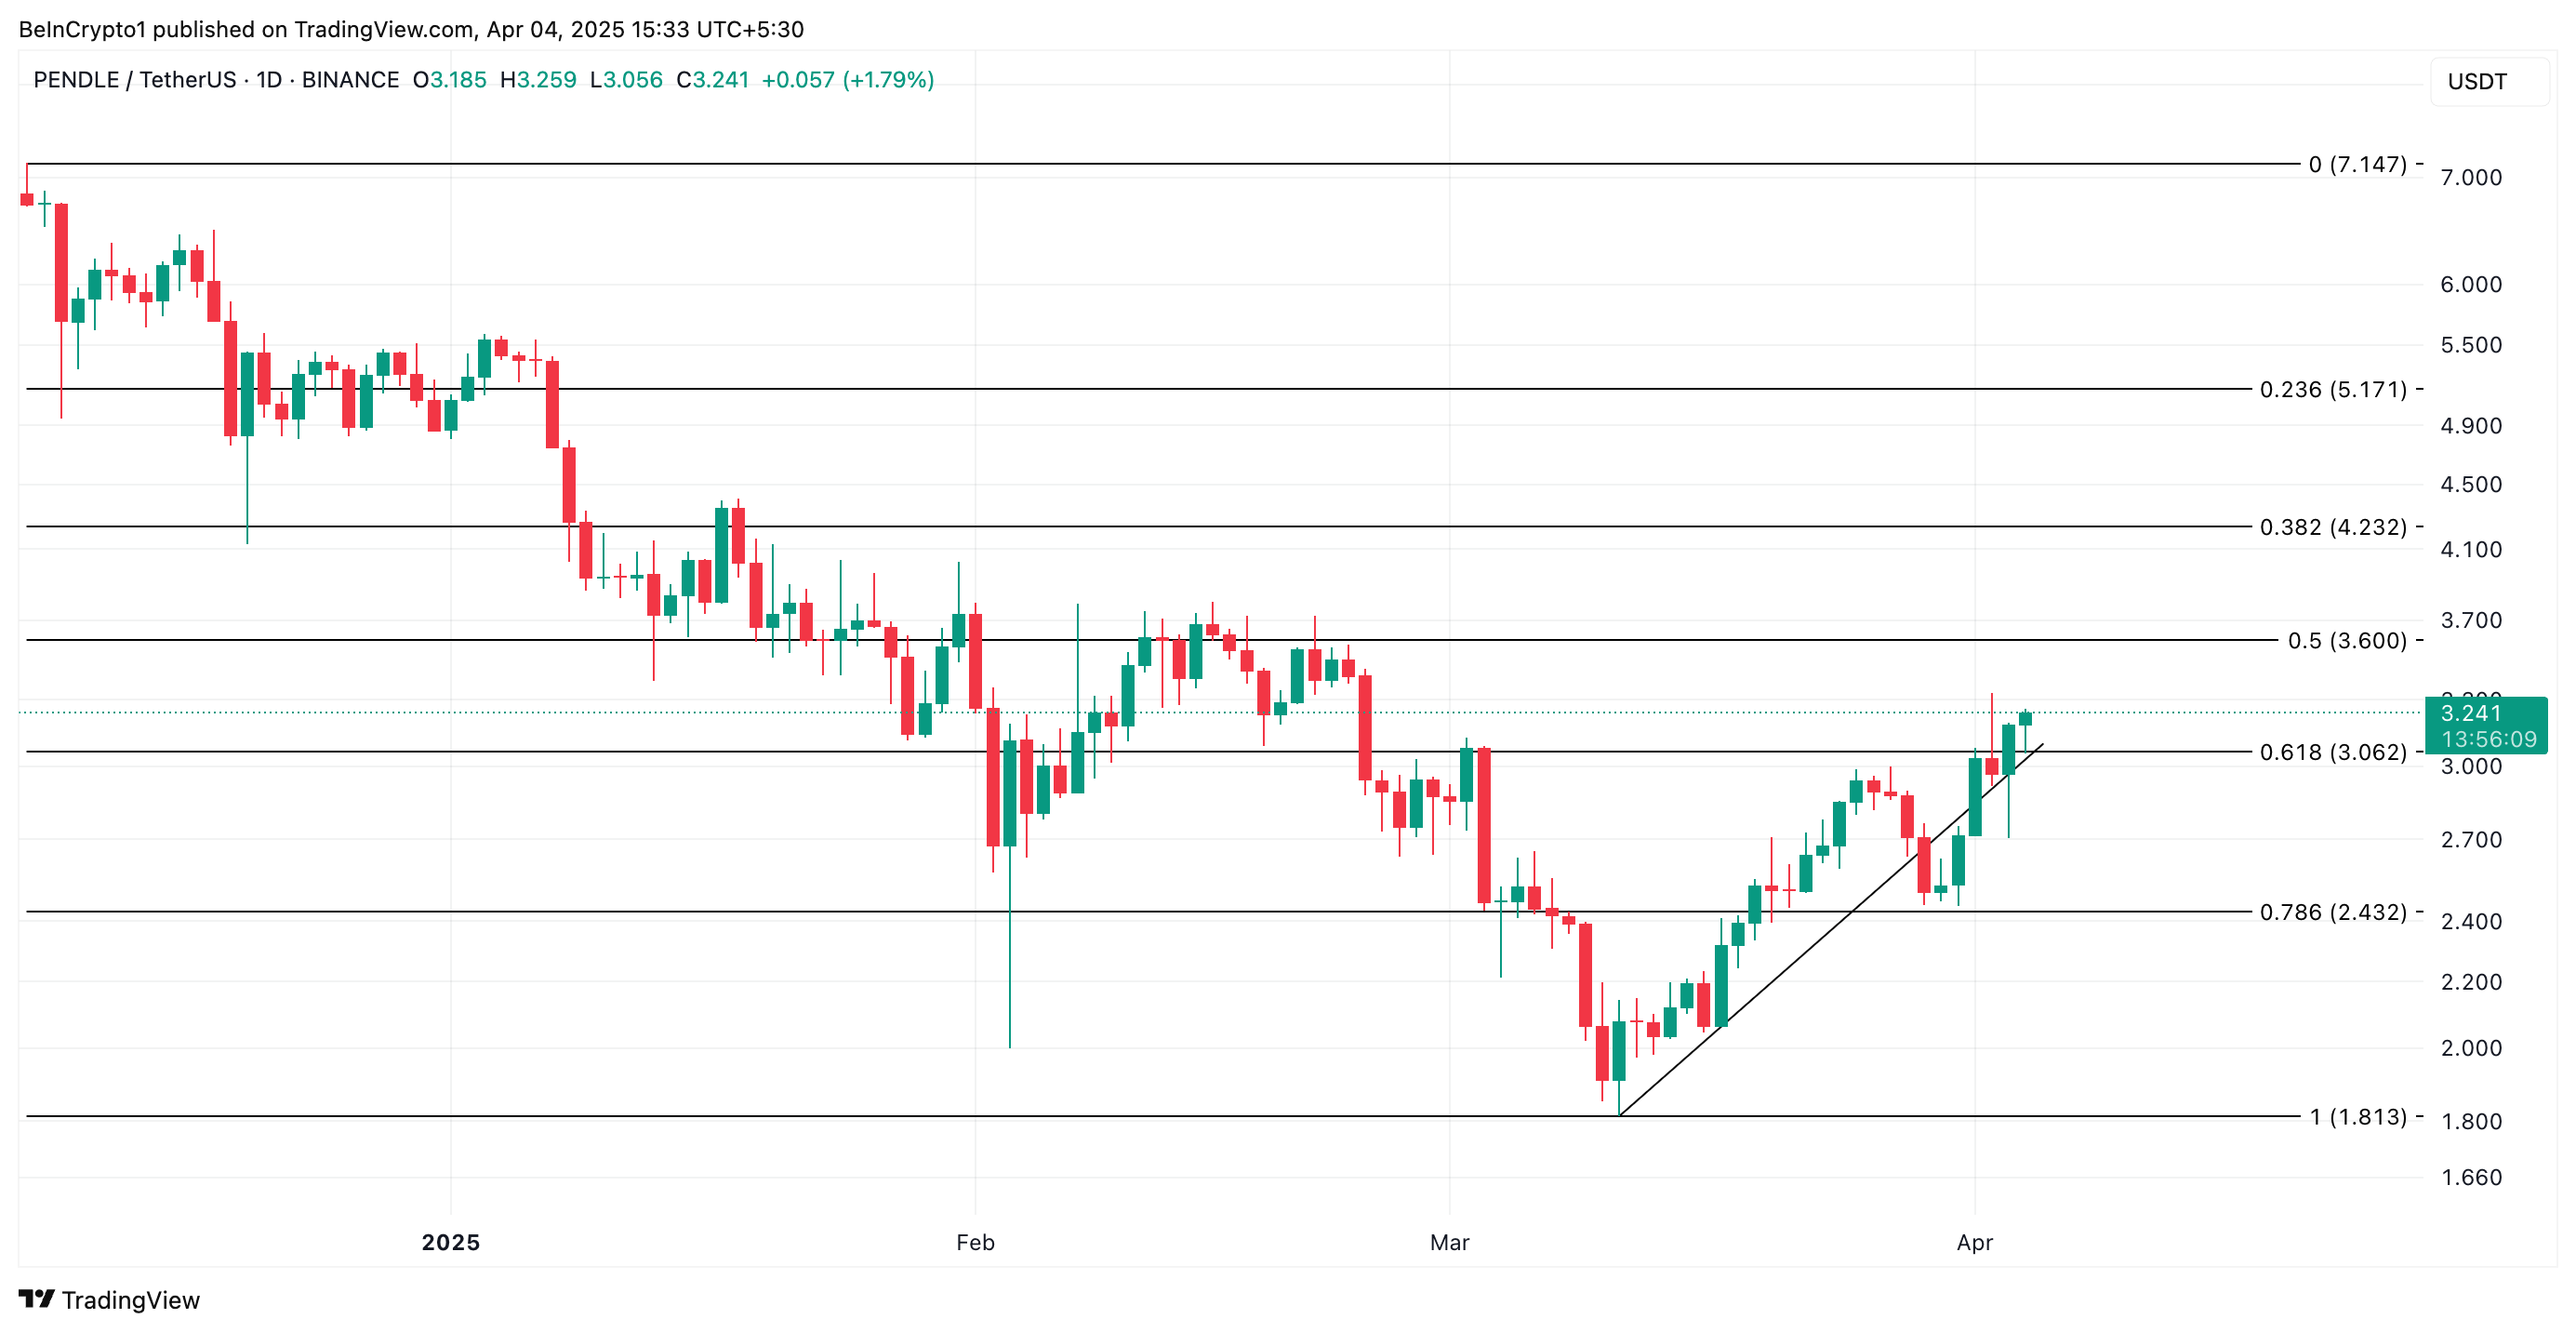
However, if selloffs commence, the PENDLE token could lose some of its recent gains and fall to $3.06.
Disclaimer
In line with the Trust Project guidelines, this price analysis article is for informational purposes only and should not be considered financial or investment advice. BeInCrypto is committed to accurate, unbiased reporting, but market conditions are subject to change without notice. Always conduct your own research and consult with a professional before making any financial decisions. Please note that our Terms and Conditions, Privacy Policy, and Disclaimers have been updated.

Grayscale has submitted a registration statement with the SEC to convert its Grayscale Solana Trust (GSOL) into an ETF listed on NYSE Arca.
Despite the filing, prediction markets remain unconvinced about the chances of approval.
Is a Solana ETF Approval Still Unlikely for Q2?
On Polymarket, odds for a Solana ETF approval in the second quarter of 2025 stand at just 23%. Broader expectations for any 2025 approval are at 83%, down from 92% earlier this year.
The decline reflects regulatory delays. In March, the SEC extended review timelines for several ETF applications tied to Solana, XRP, and other altcoins.

This pattern suggests the agency may be holding off on decisions until a permanent chair takes over. Mark Uyeda, currently serving as interim chair, has not signaled a shift in stance.
Paul Atkins, Trump’s nominee to lead the agency, appeared before the Senate last week. Lawmakers questioned his involvement in crypto-related businesses, adding further uncertainty around future approvals.
Grayscale’s latest filing excludes staking, which could speed up the review process. The SEC has previously objected to staking features in ETF proposals.
When spot Ethereum ETFs moved forward last year, Grayscale, Fidelity, and Ark Invest/21Shares all removed staking components to align with the SEC’s expectations at the time.
Under Gary Gensler’s leadership, the SEC expressed concern that proof-of-stake protocols could fall under securities law. Asset managers adjusted their applications accordingly to move forward.
Following approvals for spot Bitcoin and Ethereum ETFs, several firms aim to expand their offerings to include other cryptocurrencies. They plan to offer access through traditional brokerage accounts without requiring direct asset custody.
Solana remains a strong contender due to its growing futures market in the US and a more favorable regulatory environment. Analysts view it as one of the next likely approvals if the SEC opens the door to more altcoin ETFs.
Disclaimer
In adherence to the Trust Project guidelines, BeInCrypto is committed to unbiased, transparent reporting. This news article aims to provide accurate, timely information. However, readers are advised to verify facts independently and consult with a professional before making any decisions based on this content. Please note that our Terms and Conditions, Privacy Policy, and Disclaimers have been updated.

Ethereum Holders Buy Heavily as Price Nears October 2023 Levels

Vitalik’s L2 Roadmap, XRP Unlock and More

Ethereum Whales Buy the Dip – Over 130K ETH Added In A Single Day

PENDLE Token Outperforms BTC and ETH with a 10% Rally

Will the SEC Approve Grayscale’s Solana ETF?

XRP Price Vulnerable To Falling Below $2 After 18% Decline

2.52 Million Altcoins Are Ruining Crypto’s Future

Animoca Brands Valuation Tanks 75% In Two Years, Here’s Why

Crypto exchange BingX hacked for $43 million

Are The Big Players Losing Interest?

Hong Kong’s Securities Association Tips Authorities On Crypto Self-Regulation

Coinbase cbBTC Set to go Live on Solana
2.52 Million Altcoins Are Ruining Crypto’s Future
Animoca Brands Valuation Tanks 75% In Two Years, Here’s Why
Crypto exchange BingX hacked for $43 million
Are The Big Players Losing Interest?
Hong Kong’s Securities Association Tips Authorities On Crypto Self-Regulation
Coinbase cbBTC Set to go Live on Solana
-

 Market23 hours ago
Wormhole (W) Jumps 10%—But Is a Pullback Coming?
-

 Altcoin23 hours ago
Altcoin Season Still In Sight Even As Ethereum Struggles To Gain Upward Momentum
-

 Market22 hours ago
Binance’s CZ is Helping Kyrgyzstan Become A Crypto Hub
-
 Altcoin22 hours ago
Here’s Why Is Shiba Inu Price Crashing Daily?
-
 Market21 hours ago
Crypto Market Mirrors Nasdaq and S&P 500 Amid Recession Fears
-
 Altcoin21 hours ago
Expert Reveals XRP Price Could Drop To $1.90 Before Rally To New Highs
-
 Bitcoin19 hours ago
Why ETF Issuers are Buying Bitcoin Despite Recession Fears
-

 Ethereum17 hours ago
Ethereum Faces ‘Hyperinflation Hellscape’—Analyst Reveals Key On-Chain Insights