
Market
Celestia (TIA) Risks New Lows as Demand Plunges

The value of TIA, the native token of Celestia, a modular blockchain network, has fallen to a price level last observed in November 2023.
As of this writing, the altcoin exchanges hands at $6.82, having shed almost 30% of its value in the past 30 days.
Celestia Traders Look Elsewhere
The fall in Celestia’s value has resulted in a corresponding decline in activity in its futures market. At $81.20 million as of this writing, the coin’s futures open interest has decreased by 37% since the beginning of the month.
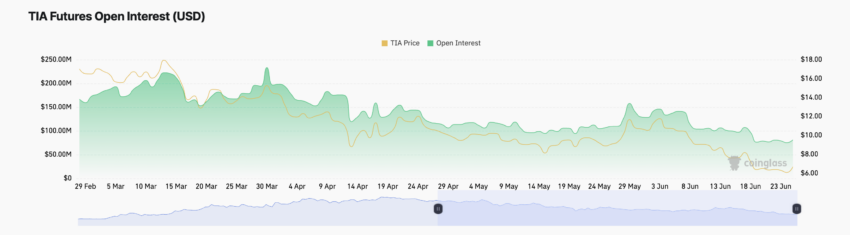
On a year-to-date (YTD) basis, the altcoin’s futures open interest has plunged by 44%. At its current level, TIA’s futures open interest is at its lowest since November 11, 2023.
An asset’s futures open interest is the total number of outstanding futures contracts that have not been settled or closed.
When it falls, traders are closing their positions without opening new ones. This is often a bearish signal that hints at reduced market activity and confirms the possibility of a further price decline.
The coin’s double-digit devaluation since June began has led to a series of long liquidations. This is because most of its derivatives traders continue to demand long positions despite TIA’s price decline.
Read More: Top 10 Aspiring Crypto Coins for 2024
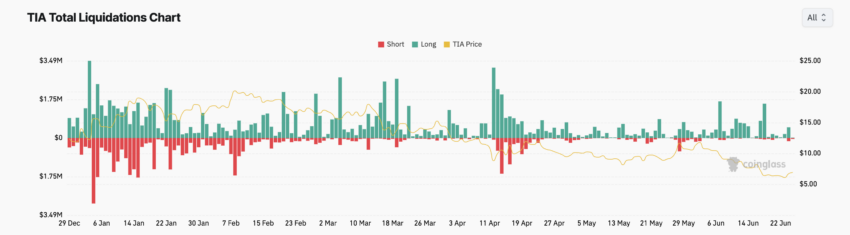
However, their positions are forcefully closed as the coin’s price touches new lows. Trades are liquidated when a trader’s position is forcefully closed due to insufficient funds to maintain it.
Long liquidations happen when an asset’s value drops unexpectedly, forcing traders with open positions in favor of a price rally to exit.
TIA Price Prediction: Fall Under $6 Imminent?
TIA’s negative Elder-Ray Index confirms the bearish sentiment that currently trails the altcoin. At press time, this indicator’s value is -0.55. For context, it has returned only negative values since June 6.
This indicator measures the relationship between the strength of buyers and sellers in the market. When its value is negative, bear power dominates the market.
Further, the setup of TIA’s Parabolic Stop and Reverse (SAR) indicator lends credence to the position above. The dots that make up the indicator are above its price.
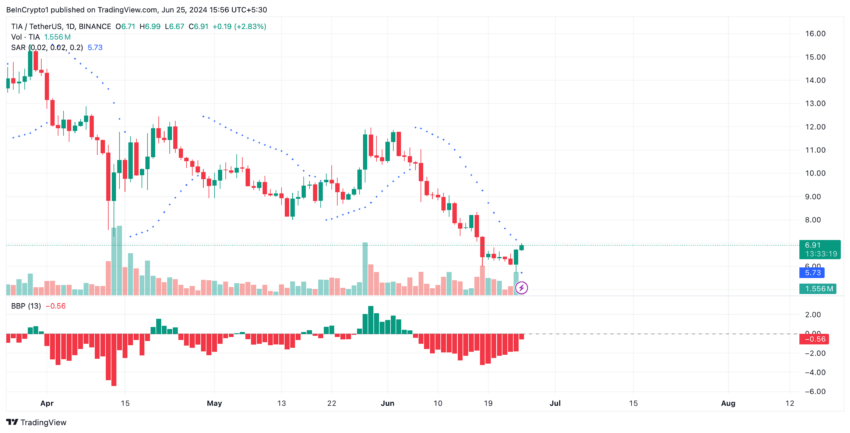
This indicator determines the direction of an asset’s price and identifies potential reversal points. When its dots rest above an asset’s price, the market is said to be in decline.
Market participants interpret this as a signal that the price will continue falling, and they should hold short positions or enter new ones.
If TIA’s price continues on its downtrend, its value may fall under $6 to trade at $5.77.
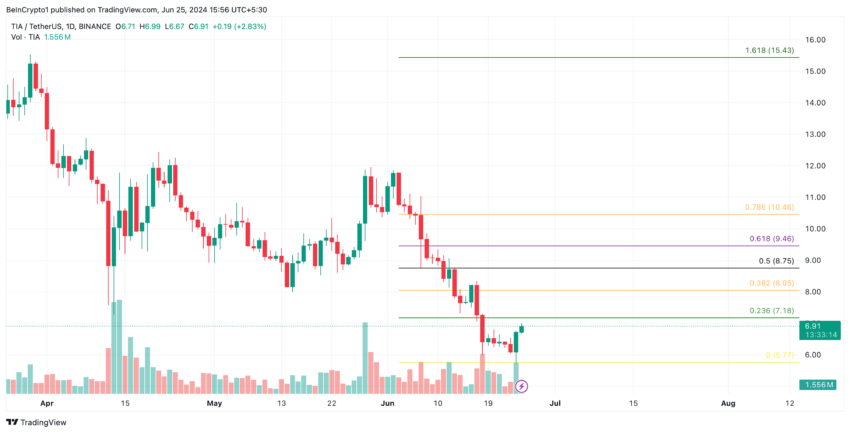
However, if the bulls initiate a rebound, the above projection will be invalidated, and the coin’s price will climb toward $7.18.
Disclaimer
In line with the Trust Project guidelines, this price analysis article is for informational purposes only and should not be considered financial or investment advice. BeInCrypto is committed to accurate, unbiased reporting, but market conditions are subject to change without notice. Always conduct your own research and consult with a professional before making any financial decisions. Please note that our Terms and Conditions, Privacy Policy, and Disclaimers have been updated.


Crypto whales are making bold moves heading into May 2025, and three tokens are standing out: Ethereum (ETH), Artificial Superintelligence Alliance (FET), and Onyxcoin (XCN). All three have seen a noticeable uptick in large-holder accumulation over the last week, signaling growing interest from big players despite recent volatility.
While ETH and XCN are both coming off sharp corrections, whale buying suggests confidence in a potential rebound. Meanwhile, FET is riding renewed momentum in the AI sector, with whale activity accelerating alongside rising prices.
Ethereum (ETH)
The number of Ethereum crypto whales—wallets holding between 1,000 and 10,000 ETH—has been steadily climbing since April 15. Back then, there were 5,432 such addresses.
That number has now risen to 5,460, the highest count since August 2023. At the same time, the concentration of ETH held by these whales is also hitting new highs, signaling growing accumulation by large holders.
While this can be interpreted as confidence in Ethereum’s long-term value, it also raises concerns about centralization and potential selling pressure if whales decide to take profits.

Ethereum price is currently down more than 19% over the last 30 days. If the correction continues, the price could retest support at $1,535. Losing that level might send ETH toward deeper support at $1,412 or even $1,385.
However, if the trend reverses, key resistance zones lie at $1,669 and $1,749—with a potential push toward $1,954 if bullish momentum builds.
In this context, the growing dominance of whales could act as either a stabilizing force or a looming risk, depending on how they respond to market shifts.
Artificial Superintelligence Alliance (FET)
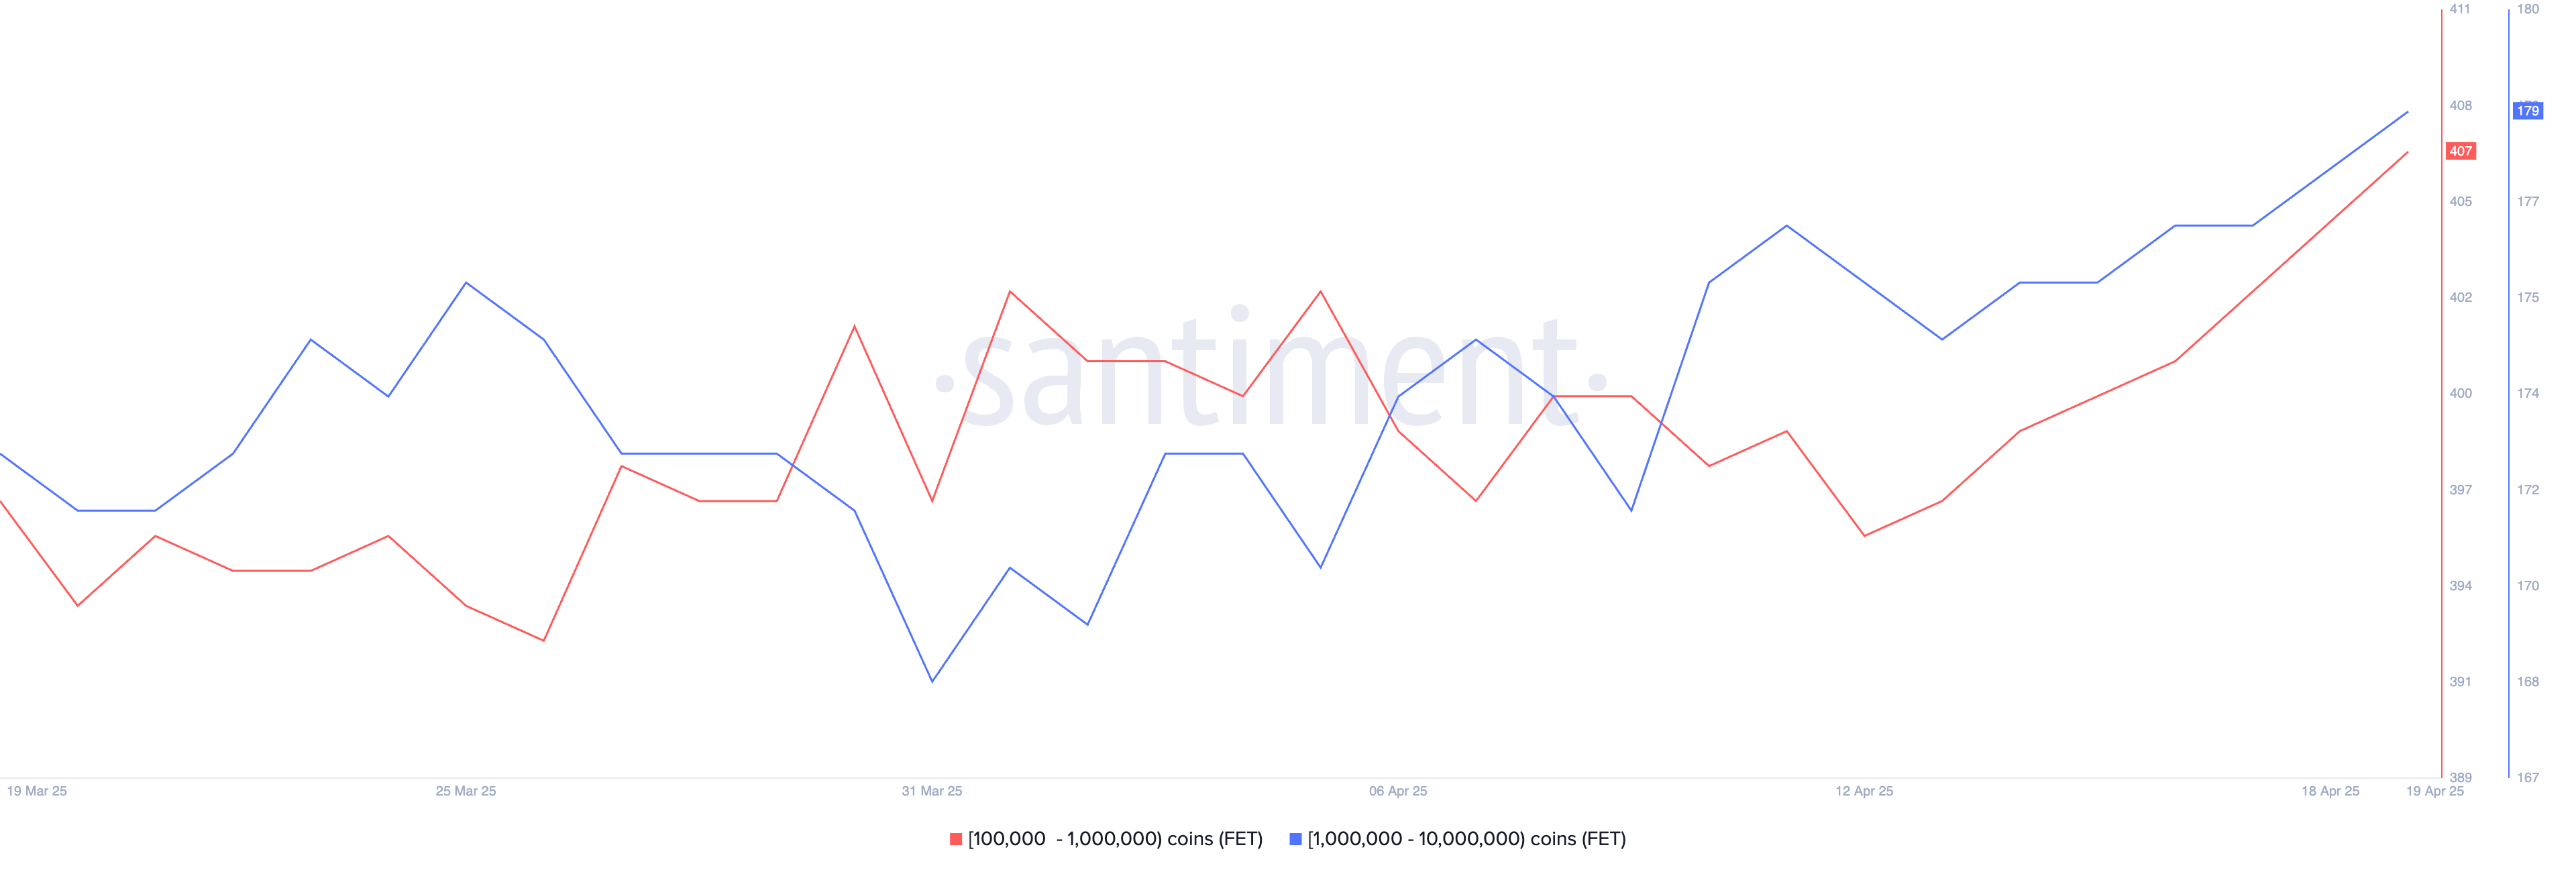
The number of FET whales—wallets holding between 10,000 and 1,000,000 tokens—increased from 572 on April 13 to 586 by April 19.
This steady growth in large holders points to rising confidence among bigger players. It comes at a time when the broader AI crypto narrative is showing signs of a rebound.
Key AI coins like FET, TAO, and RENDER have all increased over 9% in the last seven days, with FET itself gaining more than 8% in the past 24 hours and 13.5% over the week. This suggests a possible comeback for the artificial intelligence narrative in crypto.
If this momentum continues, FET could push toward resistance at $0.659. A clean breakout from that level could open the door to further gains, with $0.77 and $0.82 as the next potential targets.
On the flip side, if the rally stalls, FET might drop back to test support at $0.54. A breakdown below that could send it as low as $0.44.
With whale activity heating up and the AI sector showing renewed strength, FET’s next move could be a key signal for where the narrative heads next.
Onyxcoin (XCN)
Onyxcoin was one of the standout performers in January, but its momentum has faded in recent months. After a strong bounce—up of over 57% in the last 30 days, the token is now correcting, down 19% in the past seven days.
Despite this pullback, accumulation continues. The number of crypto whales holding between 1 million and 10 million XCN has grown from 528 on April 16 to 541, suggesting some large holders may be buying the dip.

If the correction deepens, XCN could lose support at $0.0165. A drop below that may open the door to further declines toward $0.0139 and $0.0123.
But if the trend flips back upward, the token could first test resistance at $0.020. A strong breakout from there might lead to a move toward $0.027. With whale activity on the rise and volatility returning, XCN’s next move could be decisive.
Disclaimer
In line with the Trust Project guidelines, this price analysis article is for informational purposes only and should not be considered financial or investment advice. BeInCrypto is committed to accurate, unbiased reporting, but market conditions are subject to change without notice. Always conduct your own research and consult with a professional before making any financial decisions. Please note that our Terms and Conditions, Privacy Policy, and Disclaimers have been updated.

Bitcoin (BTC) is now one year past its most recent halving, and this cycle is shaping up to be unlike any before it. Unlike previous cycles where explosive rallies followed the halving, BTC has seen a far more muted gain, up just 31%, compared to 436% over the same timeframe in the last cycle.
At the same time, long-term holder metrics like the MVRV ratio are signaling a sharp decline in unrealized profits, pointing to a maturing market with compressing upside. Together, these shifts suggest Bitcoin may be entering a new era, defined less by parabolic peaks and more by gradual, institution-driven growth.
A Year After the Bitcoin Halving: A Cycle Unlike Any Other
This Bitcoin cycle is unfolding noticeably differently than previous ones, signaling a potential shift in how the market responds to halving events.
In earlier cycles—most notably from 2012 to 2016 and again from 2016 to 2020—Bitcoin tended to rally aggressively around this stage. The post-halving period was often marked by strong upward momentum and parabolic price action, largely fueled by retail enthusiasm and speculative demand.
The current cycle, however, has taken a different route. Instead of accelerating after the halving, the price surge began earlier, in October and December 2024, followed by consolidation in January 2025 and a correction in late February.
This front-loaded behavior diverges sharply from historical patterns where halvings typically acted as the catalyst for major rallies.
Several factors are contributing to this shift. Bitcoin is no longer just a retail-driven speculative asset—it’s increasingly seen as a maturing financial instrument. The growing involvement of institutional investors, coupled with macroeconomic pressures and structural changes in the market, has led to a more measured and complex response.
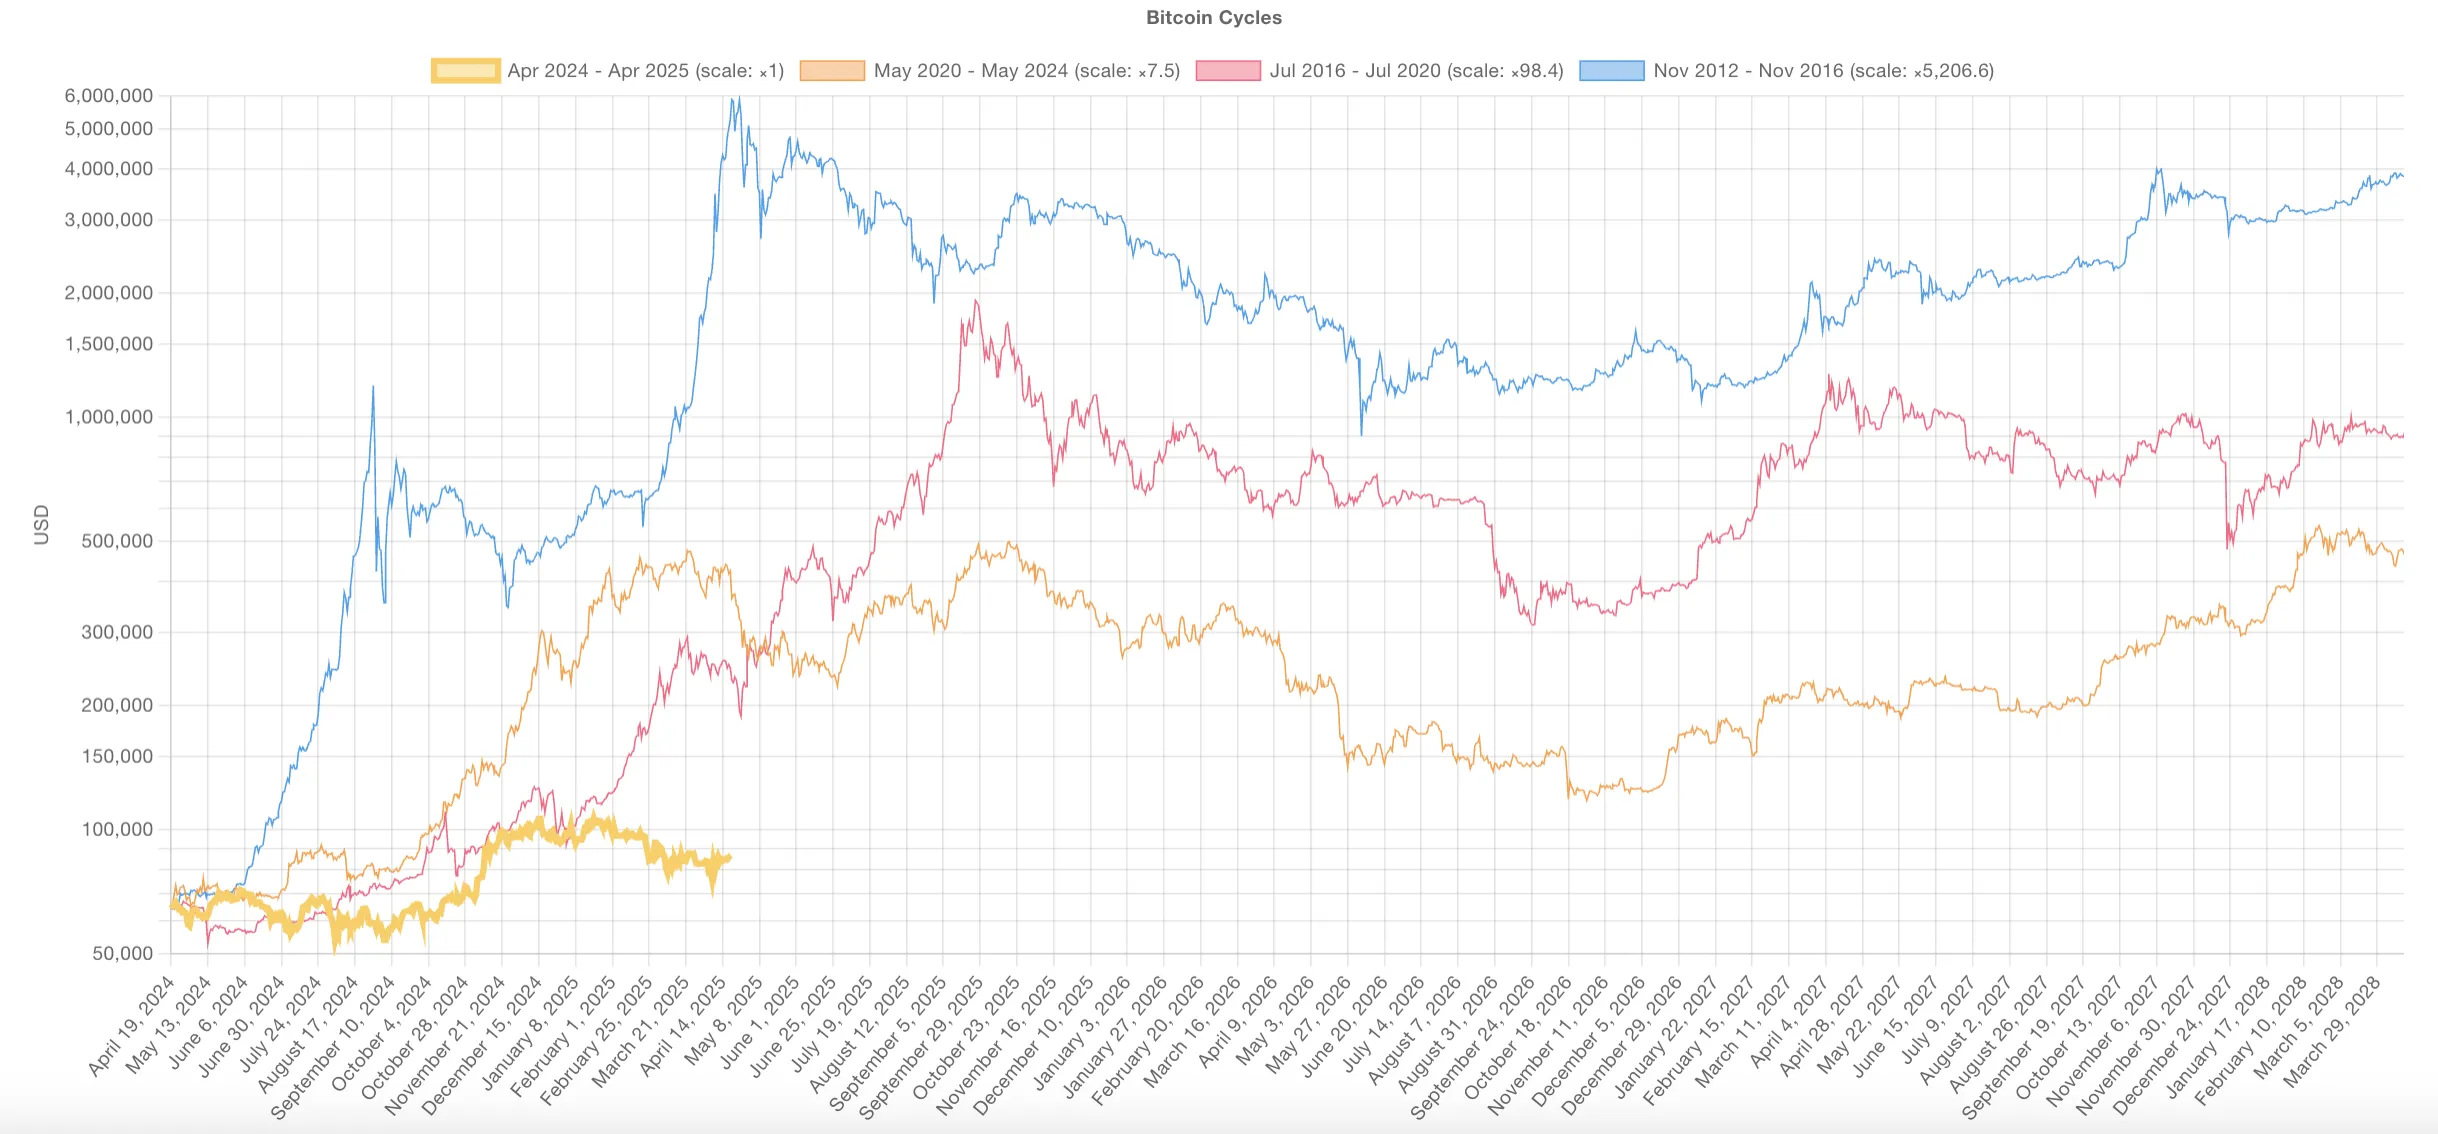
Another clear sign of this evolution is the weakening strength of each successive cycle. The explosive gains of the early years have become harder to replicate as Bitcoin’s market cap has grown. For instance, in the 2020–2024 cycle, Bitcoin had climbed 436% one year after the halving.
In contrast, this cycle has seen a much more modest 31% increase over the same timeframe.
This shift could mean Bitcoin is entering a new chapter. One with less wild volatility and more steady, long-term growth. The halving may no longer be the main driver. Other forces are taking over—rates, liquidity, and institutional money.
The game is changing. And so is the way Bitcoin moves.
Nonetheless, it’s important to note that previous cycles also featured periods of consolidation and correction before resuming their uptrend. While this phase may feel slower or less exciting, it could still represent a healthy reset before the next move higher.
That said, the possibility remains that this cycle will continue to diverge from historical patterns. Instead of a dramatic blow-off top, the outcome may be a more prolonged and structurally supported uptrend—less driven by hype, more by fundamentals.
What Long-Term Holder MVRV Reveals About Bitcoin’s Maturing Market
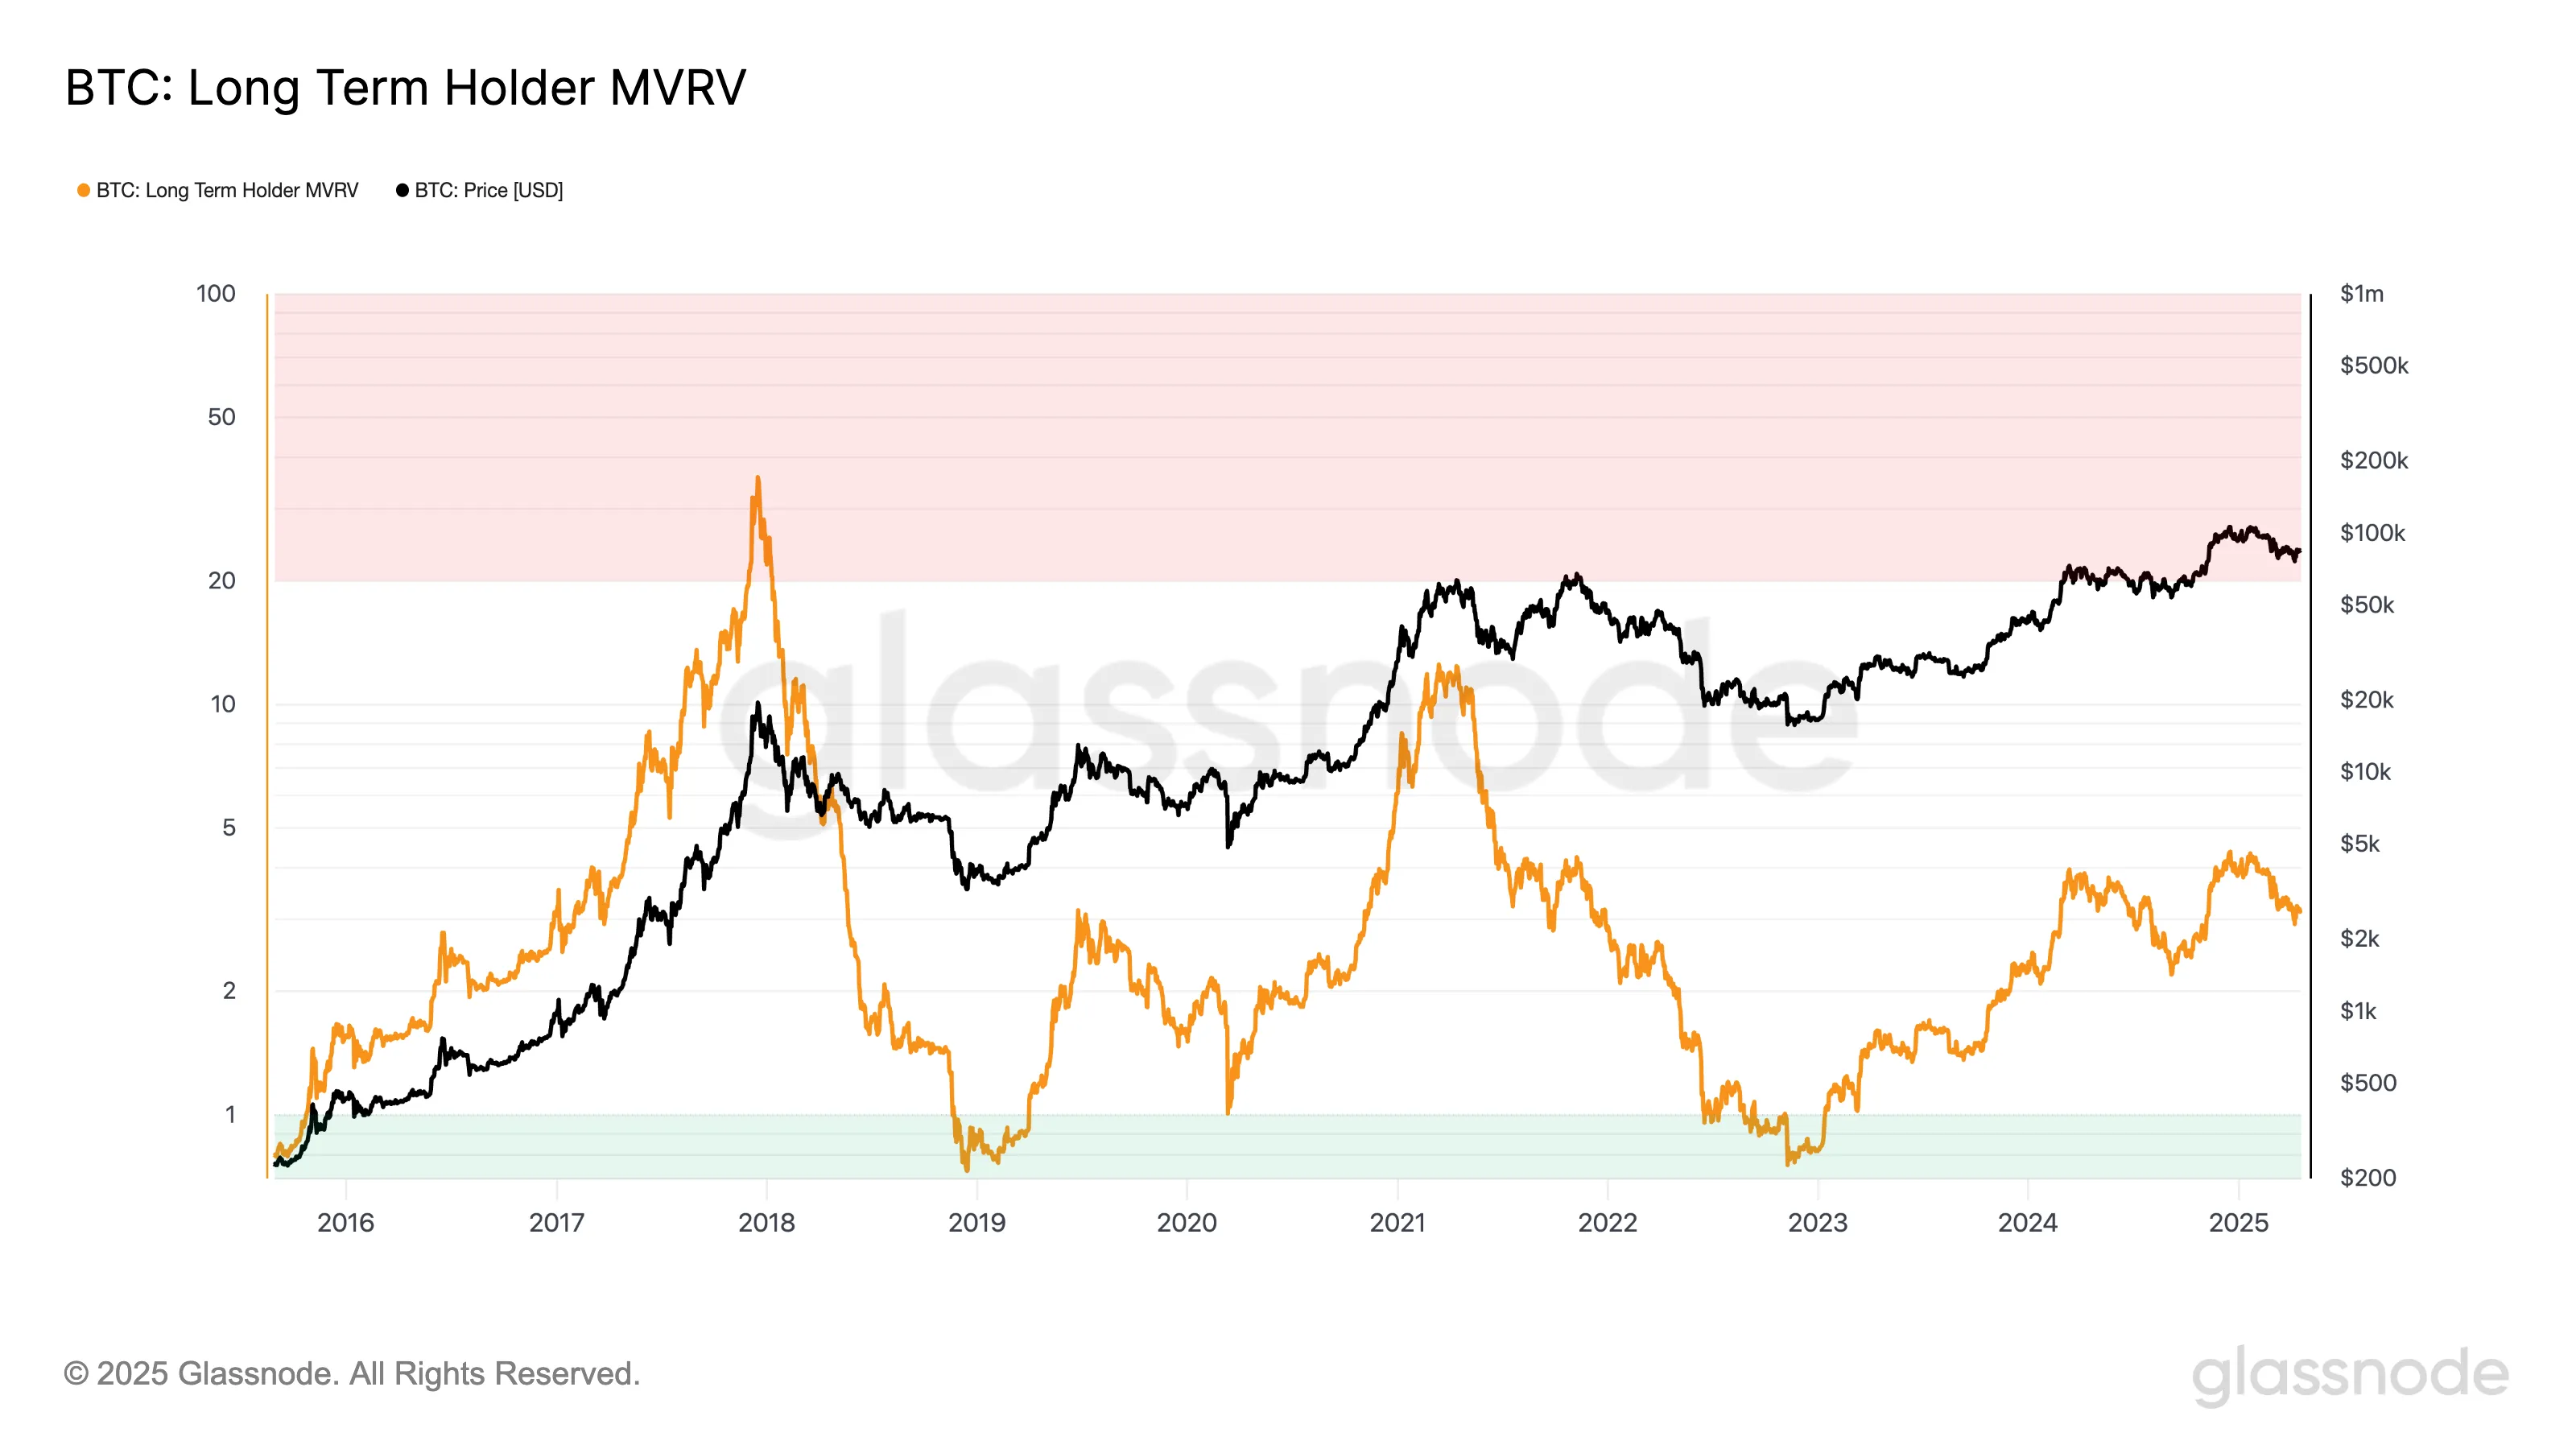
The Long-Term Holder (LTH) MVRV ratio has always been a solid measure of unrealized profits. It shows how much long-term investors are sitting on before they start selling. But over time, this number is falling.
In the 2016–2020 cycle, LTH MVRV peaked at 35.8. That signaled massive paper profits and a clear top forming. By the 2020–2024 cycle, the peak dropped sharply to 12.2. This happened even as Bitcoin price hit fresh all-time highs.
In the current cycle, the highest LTH MVRV so far is just 4.35. That’s a massive drop. It shows long-term holders aren’t seeing the same kind of gains. The trend is clear: each cycle delivers smaller multiples.
Bitcoin’s explosive upside is compressing. The market is maturing.
Now, in the current cycle, the highest LTH MVRV reading so far has been 4.35. This stark drop suggests long-term holders are experiencing much lower multiples on their holdings compared to previous cycles, even with substantial price appreciation. The pattern points to one conclusion: Bitcoin’s upside is compressing.
This isn’t just a fluke. As the market matures, explosive gains are naturally harder to come by. The days of extreme, cycle-driven profit multiples may be fading, replaced by more moderate—but potentially more stable—growth.
A growing market cap means it takes exponentially more capital to move the price significantly.
Still, it’s not definitive proof that this cycle has already topped out. Previous cycles often included extended periods of sideways movement or modest pullbacks before new highs were reached.
With institutions playing a larger role, accumulation phases could stretch longer. Therefore, peak profit-taking may be less abrupt than in earlier cycles.
However, if the trend of declining MVRV peaks continues, it could reinforce the idea that Bitcoin is transitioning away from wild, cyclical surges and toward a more subdued but structured growth pattern.
The sharpest gains may already be behind, especially for those entering late in the cycle.
Disclaimer
In line with the Trust Project guidelines, this price analysis article is for informational purposes only and should not be considered financial or investment advice. BeInCrypto is committed to accurate, unbiased reporting, but market conditions are subject to change without notice. Always conduct your own research and consult with a professional before making any financial decisions. Please note that our Terms and Conditions, Privacy Policy, and Disclaimers have been updated.

Voxies (VOXEL), a little-known gaming token, surged by over 200% within 24 hours on April 20 following a suspected malfunction in Bitget’s trading system.
The unexpected glitch led to an explosive spike in activity, pushing the VOXEL/USDT contract’s trading volume to an eye-watering $12.7 billion. According to Coingecko data, this significantly outpaces Bitcoin’s $4.76 billion volume on the same platform.
Bitget Trading Error Reportedly Lets Users Earn Six-Figure Profits
The unprecedented spike drew attention across the crypto space, particularly given that VOXEL is a relatively obscure free-to-play blockchain game token with a market cap under $30 million.
According to on-chain analyst Dylan, the Bitget bot repeatedly executed trades within the narrow $0.125 to $0.138 price range. Savvy traders quickly caught on, using just $100 to scalp profits exceeding six figures.
Reports suggest that the glitch allowed some users to walk away with tens or even hundreds of thousands of USDT in a matter of hours.
In response, Bitget’s spokesperson Xie Jiayin confirmed the platform was aware of the irregular activity and has launched an internal investigation. The company also noted that affected accounts may face temporary restrictions, urging users to contact in-app support for further assistance.
“Every platform, at every stage of development, may encounter challenges and uncertainties, yet these are an inevitable part of the journey. Bitget will provide the event details and resolution within 24 hours,” Jiayin added.
Meanwhile, the incident has sparked criticism from market experts and traders, many of whom question Bitget’s internal safeguards and technical maturity.
Several community members have criticized Bitget’s response to the issue. Some have claimed that the exchange’s decision to forcibly settle VOXEL contracts at discounted rates breached user trust. Bitget’s hybrid custody model is also receiving backlash following the incident.
“The platform’s product design reveals concerning flaws: a hybrid custody risk pool exposes users to systemic risks, and unrestricted position sizes open the door to manipulation. If these issues are not addressed, more altcoins could be weaponized against Bitget—potentially making it the next catastrophic failure in the crypto space,” one analyst stated.
Meanwhile, the timing of the incident is also notable. VOXEL is currently listed on Binance’s “Vote to Delist” program. The campaign aims to improve transparency and give the community a voice in token listings.
Overall, the Bitget incident has amplified concerns about potential market manipulation involving the token and highlighted the broader risks tied to centralized exchanges.
Disclaimer
In adherence to the Trust Project guidelines, BeInCrypto is committed to unbiased, transparent reporting. This news article aims to provide accurate, timely information. However, readers are advised to verify facts independently and consult with a professional before making any decisions based on this content. Please note that our Terms and Conditions, Privacy Policy, and Disclaimers have been updated.

Tokens Big Players Are Buying
1 Year After Bitcoin Halving: What’s Different This Time?

VOXEL Climbs 200% After Suspected Bitget Bot Glitch

Binance Traders Go Big On Dogecoin—Majority Holding Long Positions

How Token Launch Frenzy Is Delaying 2025 Altcoin Season

XRP Leads Crypto Shopping List For Latin America Ahead Of ETH, SOL—Report

2.52 Million Altcoins Are Ruining Crypto’s Future

Animoca Brands Valuation Tanks 75% In Two Years, Here’s Why

Crypto exchange BingX hacked for $43 million

Are The Big Players Losing Interest?

Hong Kong’s Securities Association Tips Authorities On Crypto Self-Regulation

Coinbase cbBTC Set to go Live on Solana
2.52 Million Altcoins Are Ruining Crypto’s Future
Animoca Brands Valuation Tanks 75% In Two Years, Here’s Why
Crypto exchange BingX hacked for $43 million
Are The Big Players Losing Interest?
Hong Kong’s Securities Association Tips Authorities On Crypto Self-Regulation
Coinbase cbBTC Set to go Live on Solana
-

 Altcoin20 hours ago
Cardano Bulls Secure Most Important Signal To Drive Price Rally
-

 Altcoin18 hours ago
Ripple Expands In Asia With Debut XRP Investment Tool
-

 Bitcoin15 hours ago
Analyst Says Bitcoin Price Might Be Gearing Up For Next Big Move — What To Know
-

 Bitcoin22 hours ago
Swiss Supermarket Chain Welcomes Crypto Payments
-
 Altcoin15 hours ago
Expert Reveals Why Consensus 2025 Will Be Pivotal For Pi Network
-
 Altcoin12 hours ago
Uniswap Founder Urges Ethereum To Pursue Layer 2 Scaling To Compete With Solana
-

 Market22 hours ago
5 Crucial Red Flags Investors Missed
-

 Market21 hours ago
SUI Ranks 5th in DEX Volume, But Rally Lacks Strength