
Market
Cardano (ADA) Struggles to Build Bullish Momentum: Will It Turn Around?

Cardano price started a fresh decline below the $0.3550 zone. ADA is consolidating above $0.3400 and might attempt a recovery wave.
- ADA price started a downward move below the $0.3500 support level.
- The price is trading below $0.3550 and the 100-hourly simple moving average.
- There was a break below a key bullish trend line with support at $0.3600 on the hourly chart of the ADA/USD pair (data source from Kraken).
- The pair could attempt a recovery wave if it clears the $0.3585 resistance zone.
Cardano Price Consolidates Losses
After testing the $0.3685 resistance, Cardano struggled to continue higher. ADA formed a short-term top and started a fresh decline, like Bitcoin and Ethereum. There was a move below the $0.3550 and $0.3500 support levels.
There was a break below a key bullish trend line with support at $0.3600 on the hourly chart of the ADA/USD pair. The price even declined below $0.3440 before the bulls appeared. A low was formed at $0.3420 and the price is now correcting losses. There was a minor move above the $0.3480 level.
The price cleared the 23.6% Fib retracement level of the downward move from the $0.3685 swing high to the $0.3420 low. Cardano price is now trading below $0.3550 and the 100-hourly simple moving average.
On the upside, the price might face resistance near the $0.3550 zone or the 50% Fib retracement level of the downward move from the $0.3685 swing high to the $0.3420 low. The first resistance is near $0.3585. The next key resistance might be $0.3685.

If there is a close above the $0.3685 resistance, the price could start a strong rally. In the stated case, the price could rise toward the $0.3780 region. Any more gains might call for a move toward $0.3950.
Another Decline in ADA?
If Cardano’s price fails to climb above the $0.3550 resistance level, it could start another decline. Immediate support on the downside is near the $0.3480 level.
The next major support is near the $0.3420 level. A downside break below the $0.3420 level could open the doors for a test of $0.3250. The next major support is near the $0.3120 level where the bulls might emerge.
Technical Indicators
Hourly MACD – The MACD for ADA/USD is losing momentum in the bearish zone.
Hourly RSI (Relative Strength Index) – The RSI for ADA/USD is now below the 50 level.
Major Support Levels – $0.3450 and $0.3420.
Major Resistance Levels – $0.3550 and $0.3685.


A crypto whale’s high-stakes, 10x leveraged PEPE position on Hyperliquid faces mounting risk. The whale’s leveraged PEPE bet remains precarious, risking liquidation amid market instability.
With added margin but persistent losses, any adverse price move could trigger cascading sell-offs and broader crypto turbulence.
Whale Opens 10X Leverage on PEPE
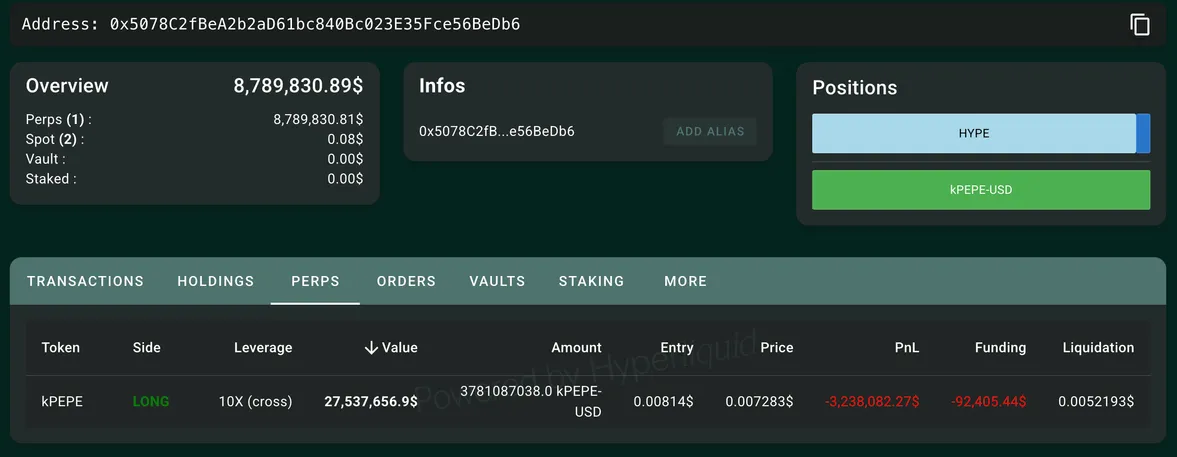
Crypto and DeFi analyst Ai revealed a notable gamble by a whale trader, placing a high-stakes bet on the PEPE meme coin. They opened a 10x leveraged long position worth $27.53 million on the Hyperliquid network.
However, the trade quickly turned against them, with unrealized losses amounting to $3.238 million.
The whale, identified by the address 0x507…BeDb6 initiated the position on March 24 at an entry price of $0.00814 per 1,000 PEPE. As it stands, they are now at risk of liquidation should the price fall to $0.005219.
To prevent forced closure, they have added 3.818 million USDC in margin (approximately $3.8 million).
The precarious nature of the position raises concerns about the broader risks to PEPE’s market stability and the implications for leveraged trading on Hyperliquid.
Using 10X leverage dramatically amplifies potential gains and losses, making this a highly volatile bet. Even minor price fluctuations can lead to significant swings in the whale’s account balance.
If PEPE’s price continues to decline and reaches the liquidation threshold, Hyperliquid’s automated systems will forcibly close the position.
This could further drive down PEPE’s price. Such liquidations often lead to cascading sell-offs as other leveraged traders get caught in a feedback loop, exacerbating market volatility.
Meanwhile, the whale’s decision to inject more margin suggests they are committed to defending their position. However, this also signals the pressure they are under to maintain solvency.
What Are the Perceived Risks?
PEPE’s inherent volatility adds another layer of risk. As a meme coin, its price movements are often driven by social sentiment rather than fundamental value. This makes it particularly vulnerable to quick price swings, which could trouble the whale’s position.
If negative market sentiment prevails due to external factors such as regulatory news or shifting trader interest, PEPE’s price could decline further.
Given that the market has already been experiencing a downturn, the likelihood of additional price pressure remains a significant concern.
Another critical issue is the potential for whale-induced market manipulation. Large-scale traders have the power to sway market trends, either through direct trades or by influencing sentiment.
By continuously adding margin to avoid liquidation, the whale may attempt to prop up PEPE’s price and prevent a major sell-off.
However, such efforts can only go so far. If the whale ultimately exits their position, it could trigger panic among smaller traders, leading to a rapid decline in PEPE’s value.
The broader impact on retail investors closely tracking whale activity could exacerbate instability.
The risks associated with liquidation cascades also cannot be ignored. Hyperliquid’s decentralized liquidation mechanism allows efficient order processing.
However, a large liquidation can spark a chain reaction in highly leveraged markets.
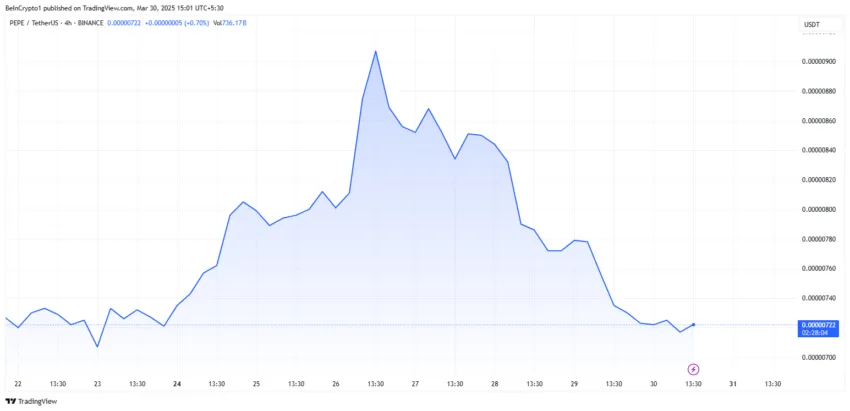
The PEPE price has fallen by over 5% in the last 24 hours and was trading for $0.00000721 as of this writing.
If PEPE’s price nears the whale’s liquidation point, other traders may begin preemptively selling to avoid losses, creating a snowball effect.
This could result in PEPE experiencing sharp price declines quickly, potentially affecting other meme coins and broader crypto markets.
KOL Opens Similar Leverage Position for Ethereum
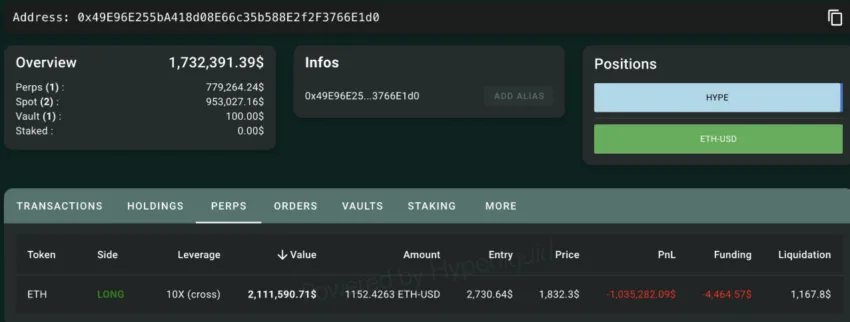
The risks are not limited to PEPE alone. A similar situation is unfolding with another prominent trader, CBB, a Key Opinion Leader (KOL) on X. They opened a 10X leveraged long position on Ethereum (ETH) worth $2.11 million.
Currently, they are facing an unrealized loss of $1.035 million due to an entry price of $2,730. Given current market conditions, this has proven to be too high.
However, unlike the PEPE whale, this trader has a more comfortable margin buffer, with a liquidation price of $1,167.8.
While not in immediate danger, this case further reflects the precarious nature of highly leveraged trading in volatile markets.
The unfolding drama surrounding these positions highlights the risks of excessive leverage, particularly in a declining market.
With PEPE’s whale struggling to maintain their position and Ethereum’s long traders facing mounting losses, the broader crypto market could see increased volatility in the coming days.
Disclaimer
In adherence to the Trust Project guidelines, BeInCrypto is committed to unbiased, transparent reporting. This news article aims to provide accurate, timely information. However, readers are advised to verify facts independently and consult with a professional before making any decisions based on this content. Please note that our Terms and Conditions, Privacy Policy, and Disclaimers have been updated.

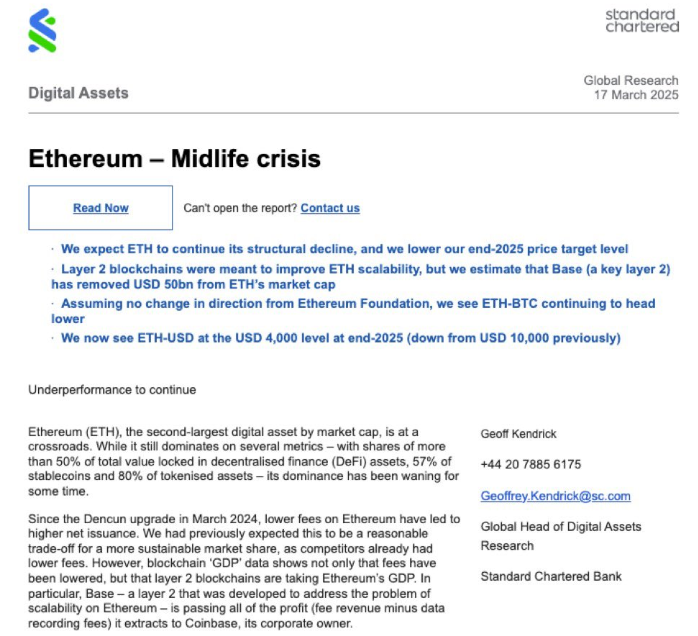
Ethereum (ETH) is still a leader in decentralized finance (DeFi) and smart contract applications, but it’s at a crossroads. The community has questioned Ethereum’s relevance in the shifting crypto industry, putting the altcoin’s future under intense scrutiny.
Mainstream narratives paint a dark picture of Ethereum’s developer exodus and underperformance.
Is Ethereum Getting Left Behind?
Critics reflect how Bitcoin’s ideological and political dominance, particularly after President Donald Trump’s pro-crypto stance, overshadowed Ethereum’s early promise of a global, decentralized computer.
Ethereum’s price downturn — down 44% in 2025 — is being driven by the exodus of developers, and network activity dropping 17% last year.
In contrast, Solana has spiked with an 83% uptick in developer engagement, partly driven by its adoption of meme coins and fast transaction speeds.
Standard Chartered analysts also cut their end-of-year Ether price forecast by 60%, based on what they told clients was Ethereum’s “identity crisis” and unclear direction forward.
Ethereum’s co-founder, Vitalik Buterin, acknowledged the growing criticism but rejected demands for quick fixes.
He reiterated Ethereum’s trajectory hinges on “long-term value” and real-world utility, not short-term speculation or political power.
“The only thing that can move Ethereum forward at this point is things that give long term value in a way where you can clearly see that the value is coming from a thing that is actually sustainable — like actual use for people,” Bloomberg reported citing Buterin.
Grassroots Push: Ethereum’s Loyalists See Opportunity
Despite growing critics, Ethereum’s most diehard supporters remain undeterred. They view the pessimism around the largest altcoin by market cap metrics as an inflection point for a turnaround.
“This is a bottom signal. Mainstream media almost always get the timing wrong,” a user on X remarked.
Ethereum Layer-2 (L2) solutions continue to dominate chain activity, while real-world asset (RWA) growth on Ethereum looks “exponential,” the user added.
Other users also reacted to the Bloomberg article, which renewed bullishness.
“Was starting to feel bearish but this post has me all bulled up again,” one added in a post.
These responses, among others, speak to Ethereum’s strong community, which has tended to shine in the face of adversity and innovation.
There is no political spectacle for Ethereum, unlike Bitcoin, with growth hinging on scalability and real-world use.
Recently, Buterin outlined a roadmap to Ethereum’s L2 ecosystem, calling for funding of open-source development to guarantee continued progress.
His vision is already coming to fruition as projects like Celo successfully transition to Ethereum layer-2 solutions. As BeInCrypto reported, Celo completed the migration after 20 months of testing, which aimed to improve scalability and transaction efficiency.
Adoption of Ethereum’s L2 scaling solutions, such as Arbitrum, Optimism, and Polygon, has also increased.
This aligns with Buterin’s perspective that sustainable blockchain growth comes from strengthened infrastructures, not hype-driven narratives.
These moves indicate that while speculation on Ethereum may be declining, long-term technological adoption could pick up the slack.
Can the Pectra Upgrade Flip the Narrative?
Likewise, Ethereum managed to overcome challenges through significant upgrades. Against that backdrop, its soon-to-be-released Pectra Upgrade could be revolutionary.
Though delays have frustrated some in the community, the upgrade is anticipated to offer improved security, transaction efficiency, and developer-friendly tools.
Ethereum’s continued commitment to innovation and ongoing testnet trials may be the perfect catalyst for reclaiming its DeFi throne. The network’s dominance in decentralized finance (DeFi) and NFT (non-fungible tokens) ecosystems proves particularly resilient.
Indeed, meme coins and speculative trading have shifted to faster chains such as Solana.
That said, when it comes to high-value applications, Ethereum is still at the heart of it all — from decentralized exchanges (DEXs) to institutional-grade financial products.
The question now, however, is whether Ethereum’s focus on real-world adoption can preserve and outlast Bitcoin’s dominance in the halls of political and financial attention.
With the Pectra upgrade on the horizon and a community loyal to the chain’s dominance in the ecosystem, Ethereum may soon show again that its greatest strength lies not in the hype but in resilience and innovation.
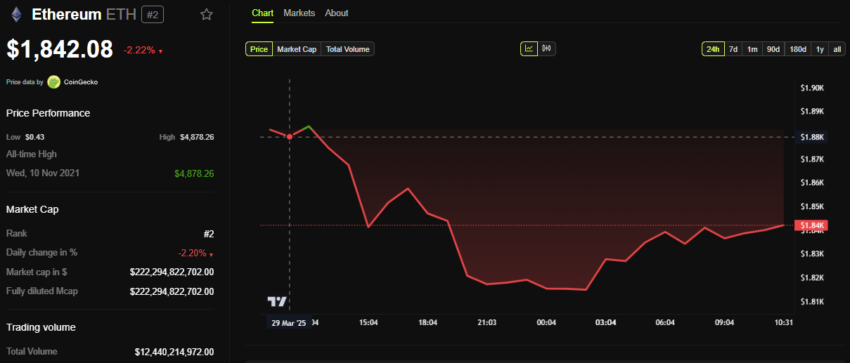
Despite community optimism, Ethereum’s price is down by 2.22% in the last 24 hours. BeInCrypto data shows ETH was trading for $1,842 as of this writing.
Disclaimer
In adherence to the Trust Project guidelines, BeInCrypto is committed to unbiased, transparent reporting. This news article aims to provide accurate, timely information. However, readers are advised to verify facts independently and consult with a professional before making any decisions based on this content. Please note that our Terms and Conditions, Privacy Policy, and Disclaimers have been updated.


The US Commodities Futures Trading Commission (CFTC) scrapped a key directive that had previously signaled increased scrutiny for digital asset derivatives.
This decision indicates a friendlier regulatory climate for digital assets in the US, given the Trump administration’s pro-crypto stance.
CFTC Loosens Oversight for Crypto Derivatives
The CFTC withdrew Staff Advisory No. 23-07 and No. 18-14 by its Division of Clearing and Risk (DCR).
The former, issued in May 2023, focused on the risks of clearing digital assets. Meanwhile, the latter targeted virtual currency derivatives listings.
Upon establishment, both directives hinted at the singling out of crypto products for tougher oversight.
However, both have now been deemed unnecessary, effective immediately, amid the commodities’ regulator’s push toward regulatory consistency.
The decision indicates a shift to treating digital asset derivatives like those on Ethereum (ETH) as traditional finance (TradFi) products.
“As stated in today’s withdrawal letter, DCR determined to withdraw the advisory to ensure that it does not suggest that its regulatory treatment of digital asset derivatives will vary from its treatment of other products,” the CFTC explained.
This move will eliminate the perceived distinctions between digital asset derivatives and TradFi instruments.
It also paves the way for enhanced market participation, which will facilitate broader involvement from financial institutions in the digital asset derivatives market. This could lead to increased liquidity and market maturity.
Nevertheless, the advisory warned derivatives clearing organizations (DCOs) to prepare for risk assessments specific to digital products’ unique characteristics.
Therefore, while it reflects the CFTC’s commitment to promoting innovation, it also suggests the intention to maintain strong financial oversight.
Meanwhile, this decision comes only weeks after the Office of the Comptroller of the Currency (OCC) allowed US banks to offer crypto and stablecoin services without prior approval.
However, the OCC had articulated that despite lifting the approval requirement, banks must maintain strong risk management controls akin to those required for traditional banking operations.
“The OCC expects banks to have the same strong risk management controls in place to support novel bank activities as they do for traditional ones,” said Rodney E. Hood, the acting Comptroller of the Currency.
Therefore, the CFTC’s move to eliminate regulatory bias for crypto derivatives marks a major divide in US policy. On the one hand, the CFTC seeks to scrap the distinction between crypto derivatives and TradFi instruments.
On the other hand, the FDIC (Federal Deposit Insurance Corporation) and OCC want banks to maintain risk management controls similar to those required for traditional banking operations despite providing crypto and stablecoin services.
Notwithstanding, these efforts mirror a growing trend among US financial regulators to lower barriers and foster responsible innovation in the crypto industry.
Disclaimer
In adherence to the Trust Project guidelines, BeInCrypto is committed to unbiased, transparent reporting. This news article aims to provide accurate, timely information. However, readers are advised to verify facts independently and consult with a professional before making any decisions based on this content. Please note that our Terms and Conditions, Privacy Policy, and Disclaimers have been updated.

Ethereum May Have Hit Cycle Bottom, But Pricing Bands Signal Strong Resistance At $2,300

Ethereum MVRV Ratio Nears 160-Day MA Crossover – Accumulation Trend Ahead?
Whale Leverages $27.5 Million PEPE Long on Hyperliquid

Ethereum Playing Catch-Up? Bloomberg Examines ETH’s Struggles In New Report

Can Ethereum’s Utility Make a Comeback Against Bitcoin?

Crypto Derivatives Get a Boost from US CFTC

2.52 Million Altcoins Are Ruining Crypto’s Future

Animoca Brands Valuation Tanks 75% In Two Years, Here’s Why

Crypto exchange BingX hacked for $43 million

Are The Big Players Losing Interest?

Hong Kong’s Securities Association Tips Authorities On Crypto Self-Regulation

Coinbase cbBTC Set to go Live on Solana
2.52 Million Altcoins Are Ruining Crypto’s Future
Animoca Brands Valuation Tanks 75% In Two Years, Here’s Why
Crypto exchange BingX hacked for $43 million
Are The Big Players Losing Interest?
Hong Kong’s Securities Association Tips Authorities On Crypto Self-Regulation
Coinbase cbBTC Set to go Live on Solana
-

 Market19 hours ago
GRASS Jumps 30% in a Week, More Gains Ahead?
-
 Altcoin18 hours ago
Pepe Coin Whale Sells 150 Billion Tokens, Price Fall Ahead?
-

 Ethereum24 hours ago
Ethereum Breakdown, Analyst Eyes $1,130–$1,200 Price Target
-

 Market17 hours ago
XRP Falls 12% in a Week as Network Activity Declines
-

 Bitcoin24 hours ago
Bitcoin Price Could Surge To $95,000 — But Analyst Sounds ‘Bull Trap’ Alarm
-

 Market23 hours ago
Dark Web Criminals Are Selling Binance and Gemini User Data
-

 Ethereum17 hours ago
Ethereum Bulls Disappointed As Recovery Attempt Fails At $2,160 Resistance
-

 Market20 hours ago
Vitalik Buterin Promotes Ethereum Layer 2 Roadmap