
Market
Cardano (ADA) Faces Death Cross After Price Falls 37% In March

Cardano (ADA) has been on a rocky path this month. After posting early gains, the altcoin has now retraced 37%, erasing most of its recent upside.
While broader market indicators hinted at a bullish outlook, technical patterns suggest that the momentum may not hold.
Cardano Losses Are Likely
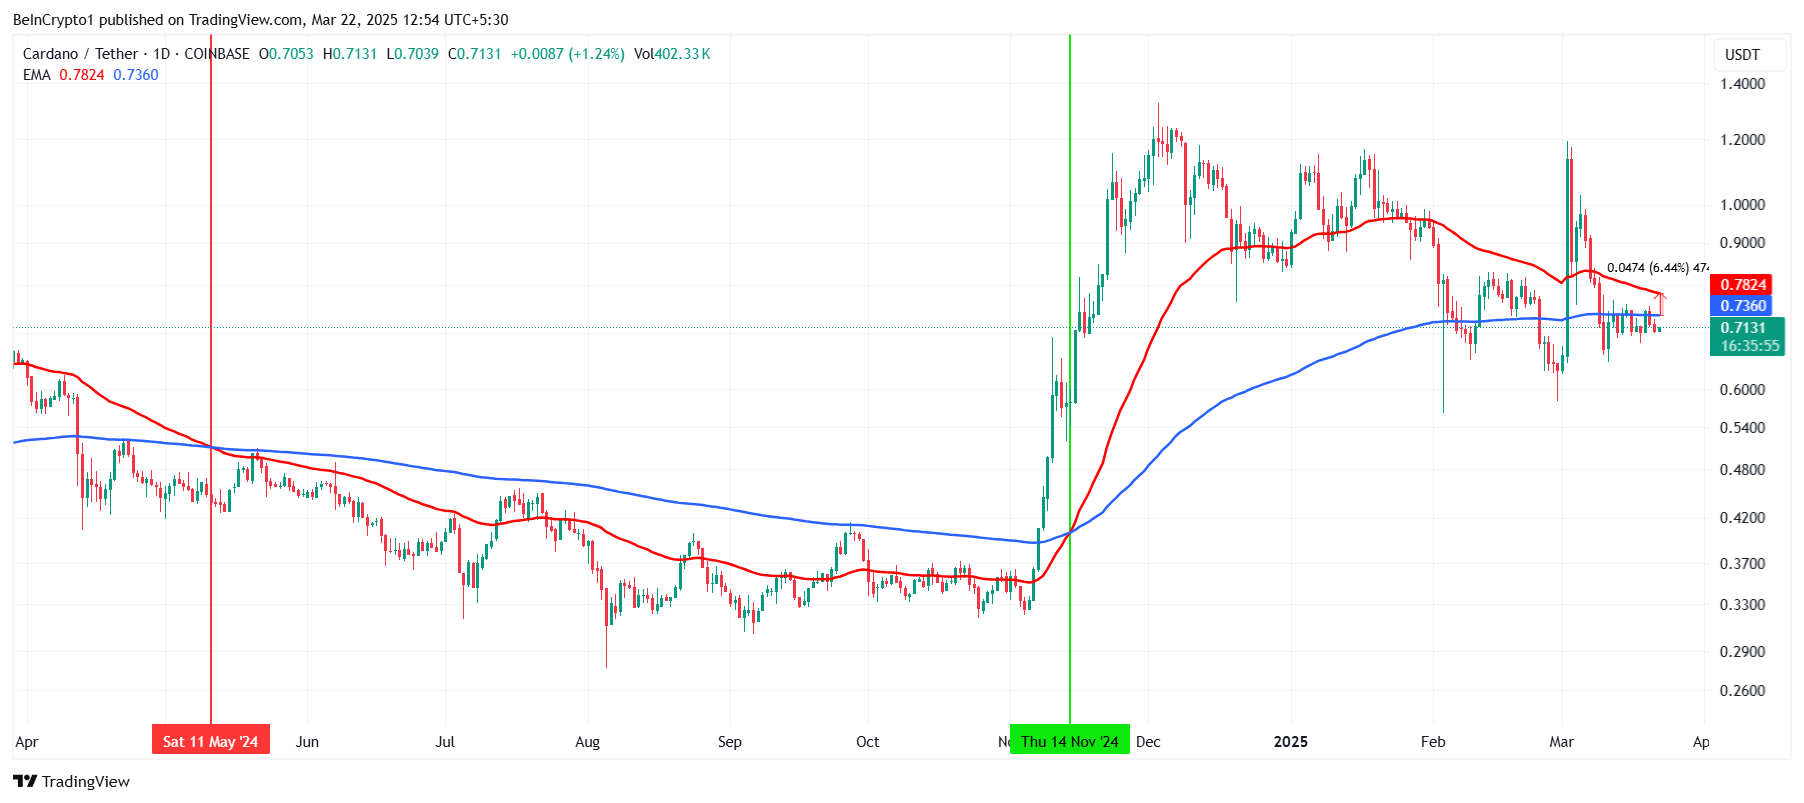
Cardano appears to be nearing a Death Cross, a bearish technical signal. This occurs when the 50-day exponential moving average (EMA) slips below the 200-day EMA. Historically, this crossover has often preceded sharp price declines.
If this formation is confirmed, it would be ADA’s first Death Cross in 10 months. It would also officially end the ongoing five-month-long Golden Cross, a bullish pattern that previously supported the asset’s growth.
With momentum fading, investors may see this as a pivot toward further downside pressure.
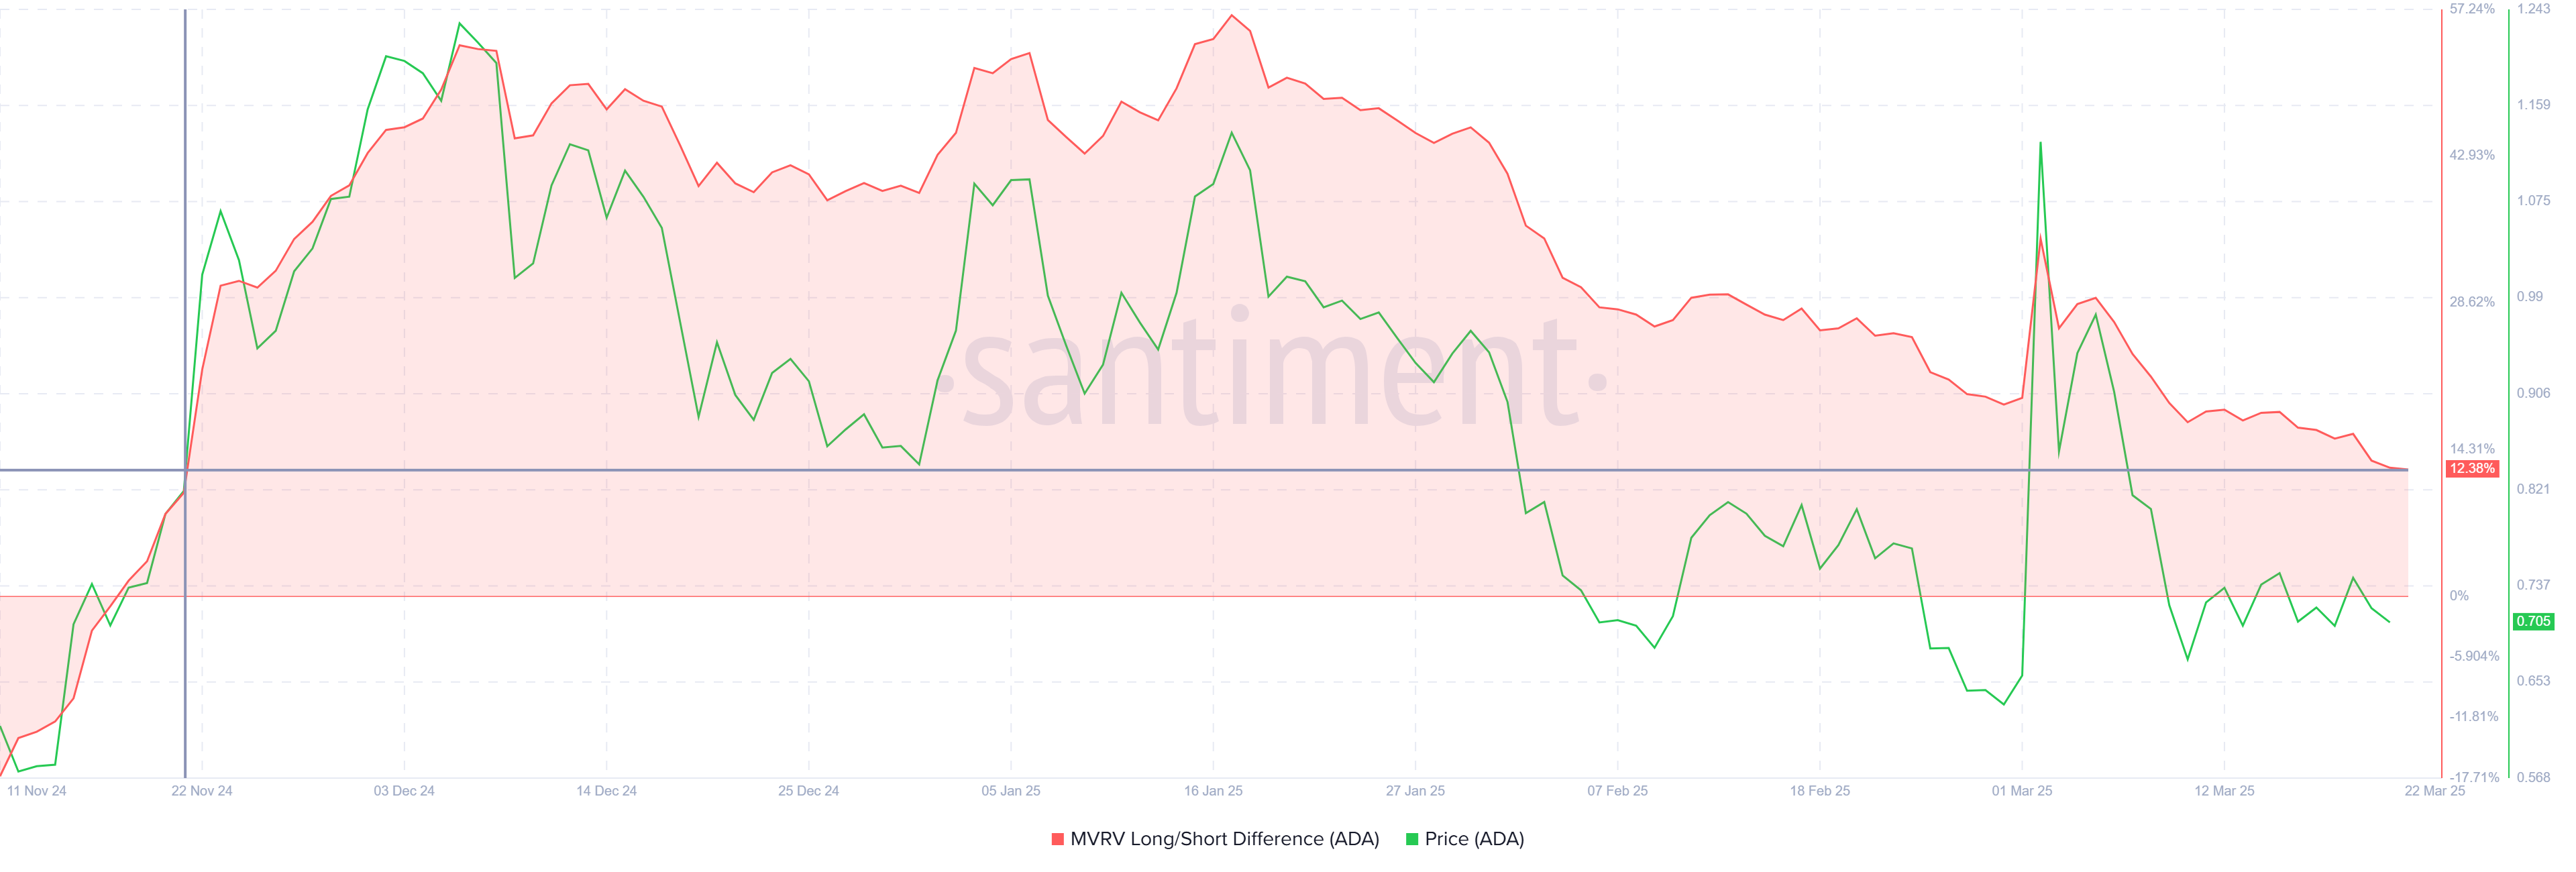
On-chain data further dampens investor confidence. The MVRV Long/Short Difference — a metric comparing the profitability of long-term holders (LTHs) to short-term holders (STHs) — has been declining steadily.
While still in positive territory, its fall suggests LTHs are seeing their profits shrink.
This metric is now sitting at a four-month low, increasing the risk of profit-taking by LTHs. If these investors begin to sell to preserve gains, it could introduce added selling pressure. The resulting drawdown may undercut any bullish momentum Cardano is attempting to hold onto.
ADA Price Is Consolidated
ADA is currently trading at $0.71, down 37% from its recent high. The decline has broken its macro uptrend, although the altcoin remains just above the $0.70 support level. This floor has acted as a key technical barrier.
However, the looming Death Cross, combined with fading long-term investor confidence, may push Cardano below this support. If $0.70 is breached, ADA could slip to $0.62. This would mark a further extension of the ongoing correction phase, reinforcing the bearish outlook.
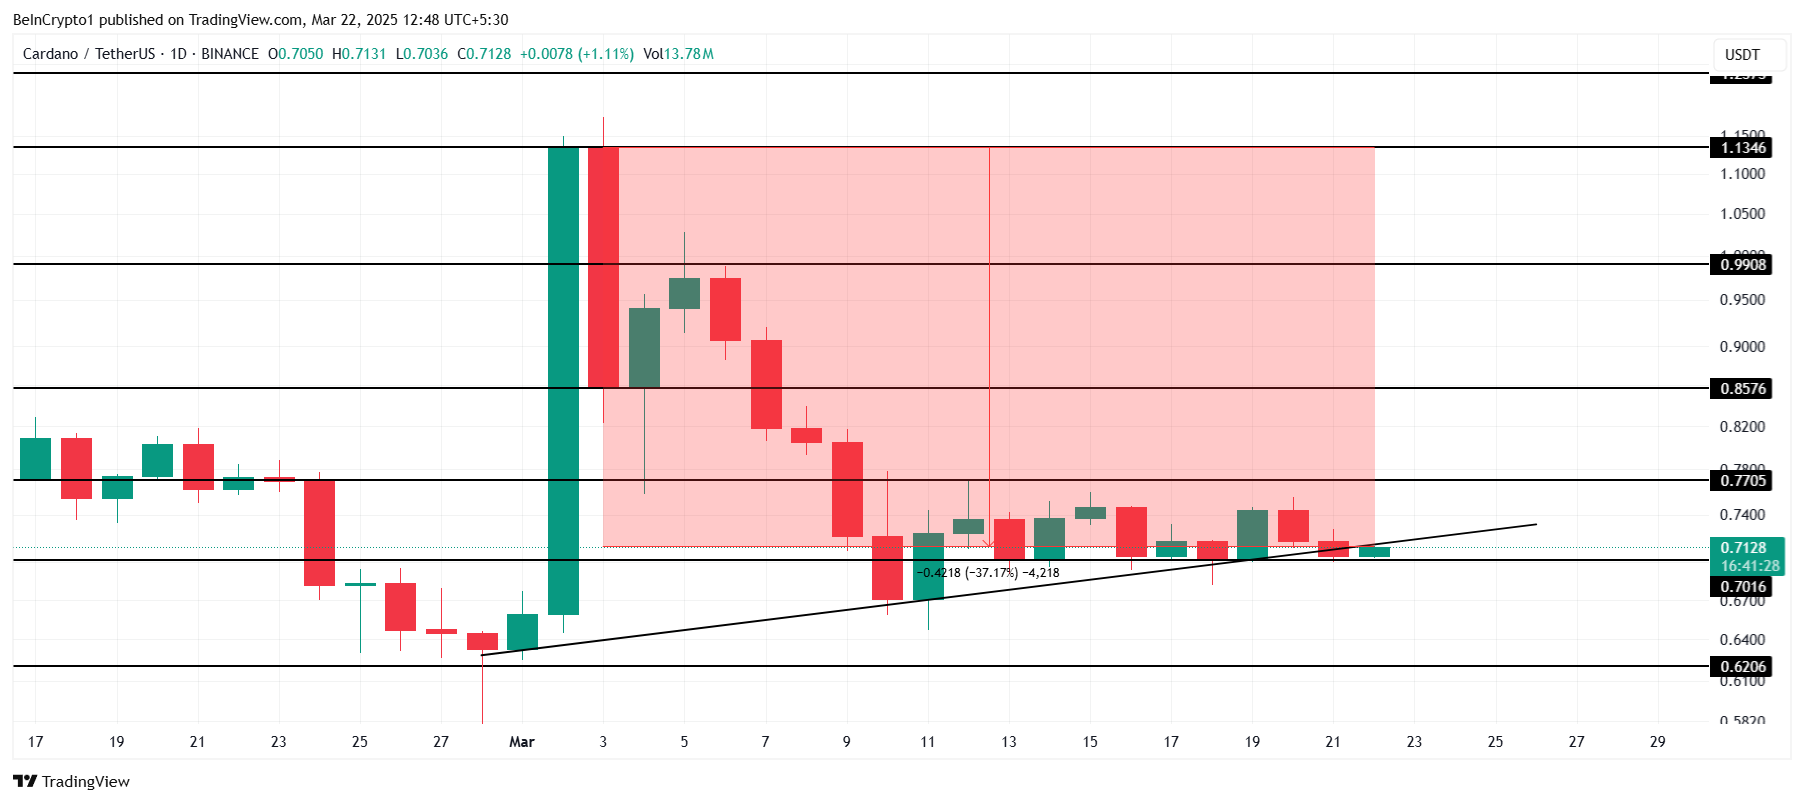
On the other hand, if Cardano manages to invalidate the bearish thesis, it must rise above $0.77. This would end the current 11-day consolidation phase.
A successful breakout could propel ADA toward $0.85, reclaiming some of the lost ground and potentially restoring short-term investor confidence.
Disclaimer
In line with the Trust Project guidelines, this price analysis article is for informational purposes only and should not be considered financial or investment advice. BeInCrypto is committed to accurate, unbiased reporting, but market conditions are subject to change without notice. Always conduct your own research and consult with a professional before making any financial decisions. Please note that our Terms and Conditions, Privacy Policy, and Disclaimers have been updated.


Crypto users often focus on user interfaces and pay less attention to the complex internal protocols. Security experts recently raised concerns about a critical vulnerability in Crypto-MCP (Model-Context-Protocol), a protocol for connecting and interacting with blockchains.
This flaw could allow hackers to steal digital assets. They could redirect transactions or expose the seed phrase — the key to accessing a crypto wallet.
How Dangerous is the Crypto-MCP Vulnerability?
Crypto-MCP is a protocol designed to support blockchain tasks. These tasks include querying balances, sending tokens, deploying smart contracts, and interacting with decentralized finance (DeFi) protocols.
Protocols like Base MCP from Base, Solana MCP from Solana, and Thirdweb MCP offer powerful features. These include real-time blockchain data access, automated transaction execution, and multi-chain support. However, the protocol’s complexity and openness also introduce security risks if not properly managed.
Developer Luca Beurer-Kellner first raised the issue in early April. He warned that an MCP-based attack could leak WhatsApp messages via the protocol and bypass WhatsApp’s security.
Following that, Superoo7—head of Data and AI at Chromia—investigated and reported a potential vulnerability in Base-MCP. This issue affects Cursor and Claude, two popular AI platforms. The flaw allows hackers to use “prompt injection” techniques to change the recipient address in crypto transactions.
For example, if a user tries to send 0.001 ETH to a specific address, a hacker can insert malicious code to redirect the funds to their wallet. What’s worse, the user may not notice anything wrong. The interface will still show the original intended transaction details.
“This risk comes from using a ‘poisoned’ MCP. Hackers could trick Base-MCP into sending your crypto to them instead of where you intended. If this happens, you might not notice,” Superoo7 said.

Developer Aaronjmars pointed out an even more serious issue. Wallet seed phrases are often stored unencrypted in the MCP configuration files. If hackers gain access to these files, they can easily steal the seed phrase and fully control the user’s wallet and digital assets.
“MCP is an awesome architecture for interoperability & local-first interactions. But holy shit, current security is not tailored for Web3 needs. We need better proxy architecture for wallets,” Aaronjmars emphasized.
So far, no confirmed cases of this vulnerability being exploited to steal crypto assets exist. However, the potential threat is serious.
According to Superoo7, users should protect themselves by using MCP only from trusted sources, keeping wallet balances minimal, limiting MCP access permissions, and using the MCP-Scan tool to check for security risks.
Hackers can steal seed phrases in many ways. A report from Security Intelligence at the end of last year revealed that an Android malware called SpyAgent targets seed phrases by stealing screenshots.
Kaspersky also discovered SparkCat malware that extracts seed phrases from images using OCR. Meanwhile, Microsoft warned about StilachiRAT, malware that targets 20 crypto wallet browser extensions on Google Chrome, including MetaMask and Trust Wallet.
Disclaimer
In adherence to the Trust Project guidelines, BeInCrypto is committed to unbiased, transparent reporting. This news article aims to provide accurate, timely information. However, readers are advised to verify facts independently and consult with a professional before making any decisions based on this content. Please note that our Terms and Conditions, Privacy Policy, and Disclaimers have been updated.

After suffering a historic price collapse, Mantra’s OM is making a remarkable comeback. The altcoin plunged over 90% on April 13, falling from $6.30 to under $0.50 in hours.
However, it has bounced back with a 25% gain over the past 24 hours. OM is currently the market’s top gainer and is poised to extend its gains in the short term.
OM Leads Market Gains With a 25% Jump
The sudden resurgence in investor interest in OM comes after an April 15 X post from Mantra CEO John Patrick Mullin, announcing plans to burn the team’s token allocation.
While plans for the token burn are still being finalized, Mullin’s announcement has calmed market fears and revived bullish sentiment among some traders. This renewed confidence has prompted increased OM accumulation, driving the token’s price up by over 25% in the past 24 hours.
Key on-chain and market metrics support the rebound narrative. For example, the token’s open interest has risen sharply by 9%, indicating a surge in fresh capital entering OM positions in the past 24 hours.
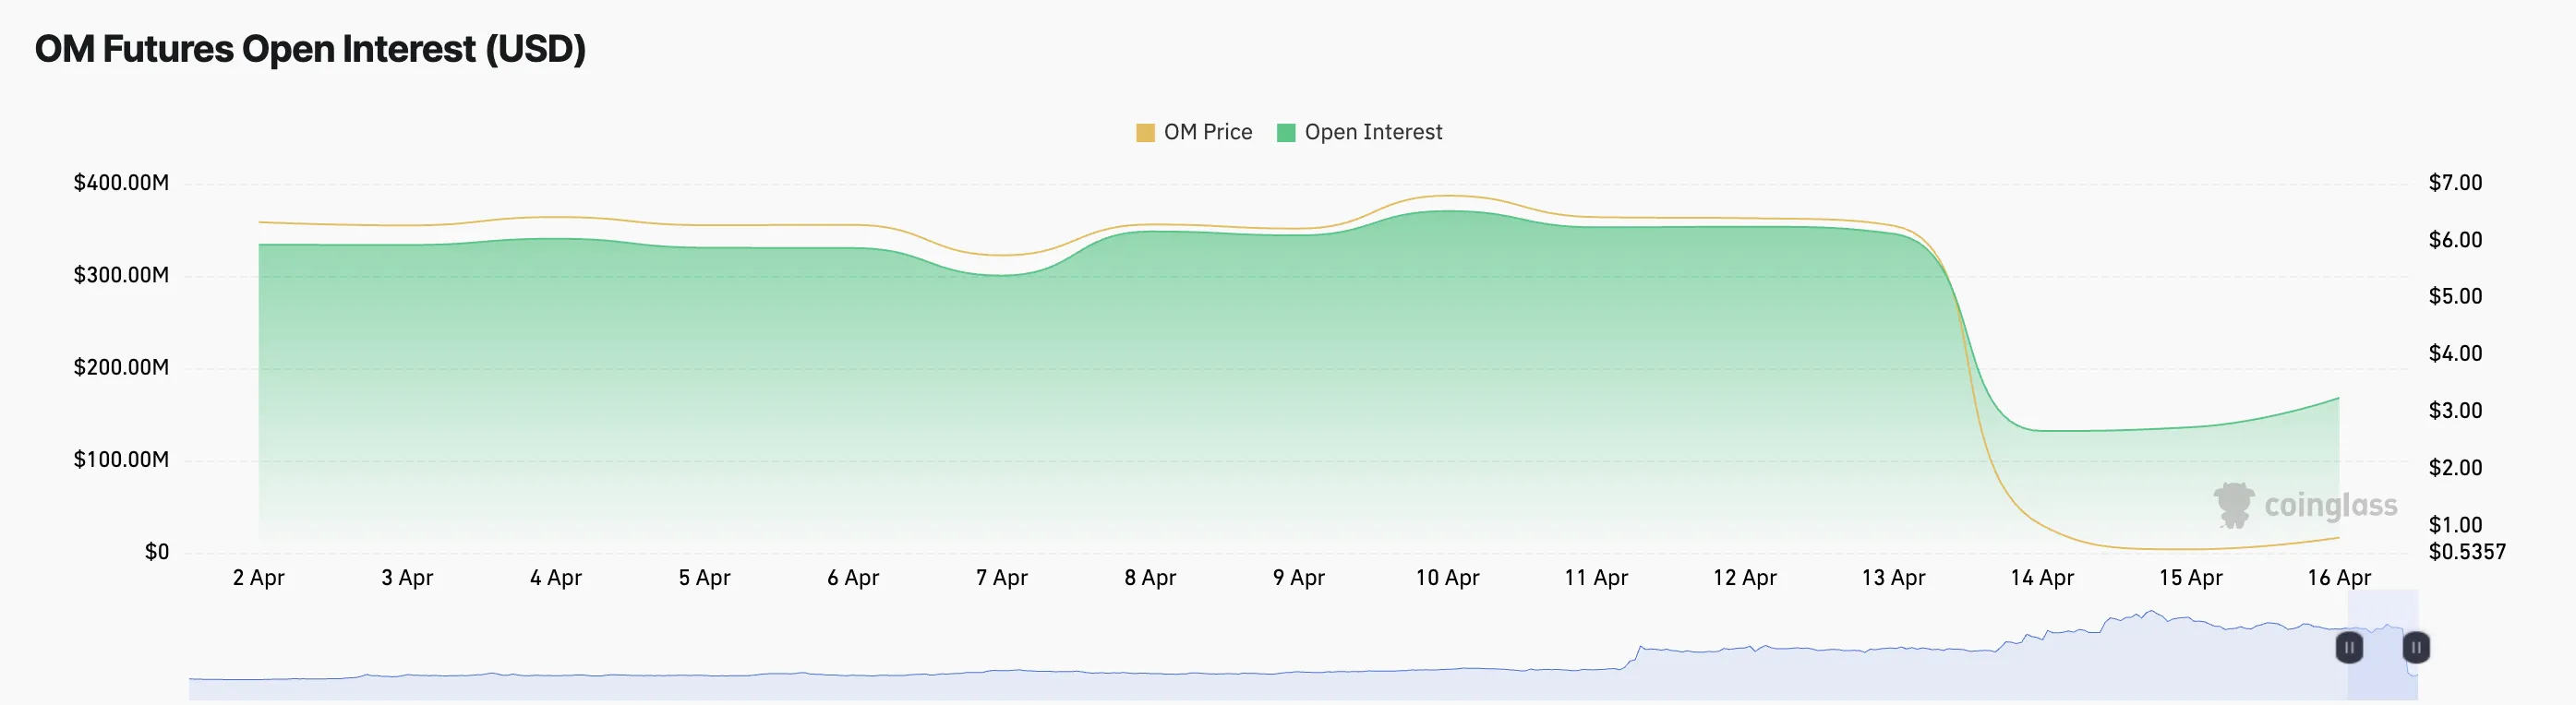
As of this writing, this stands at $156.74 million. When an asset’s open interest climbs alongside its price like this, it signals that new money is entering the market and that traders are opening fresh positions in the direction of the uptrend.
Moreover, OM’s long/short ratio confirms this. As of this writing, it is currently at 1.02, highlighting the preference for long positions among futures traders.
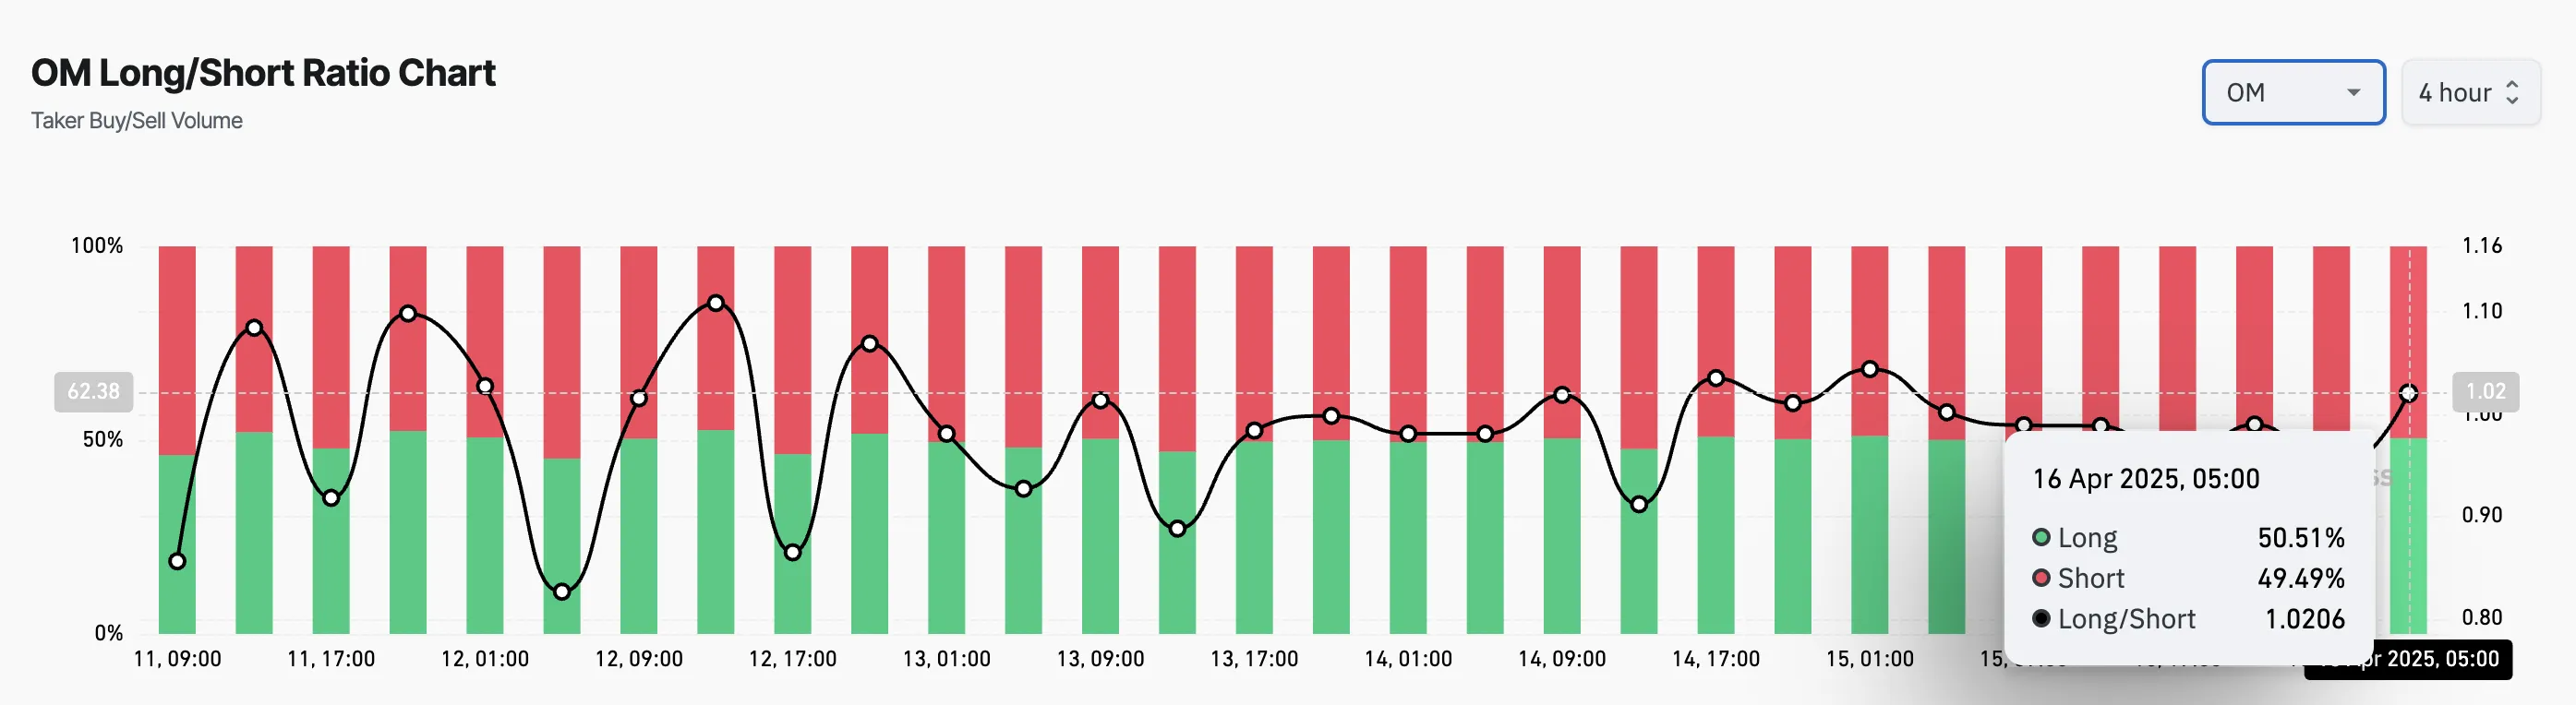
An asset’s long/short ratio measures the proportion of its long positions to short ones in the market.
A ratio above one like this means there are more positions betting on a sustained OM price rally than those opened in favor of a decline.
Next Stop $2.64 or Back to January’s $0.09 Lows?
At press time, OM trades at $0.78, climbing 29% from April 13’s low of $0.50. With the gradual uptick in its buying pressure, the altcoin could maintain its current rally to trade at $2.64.
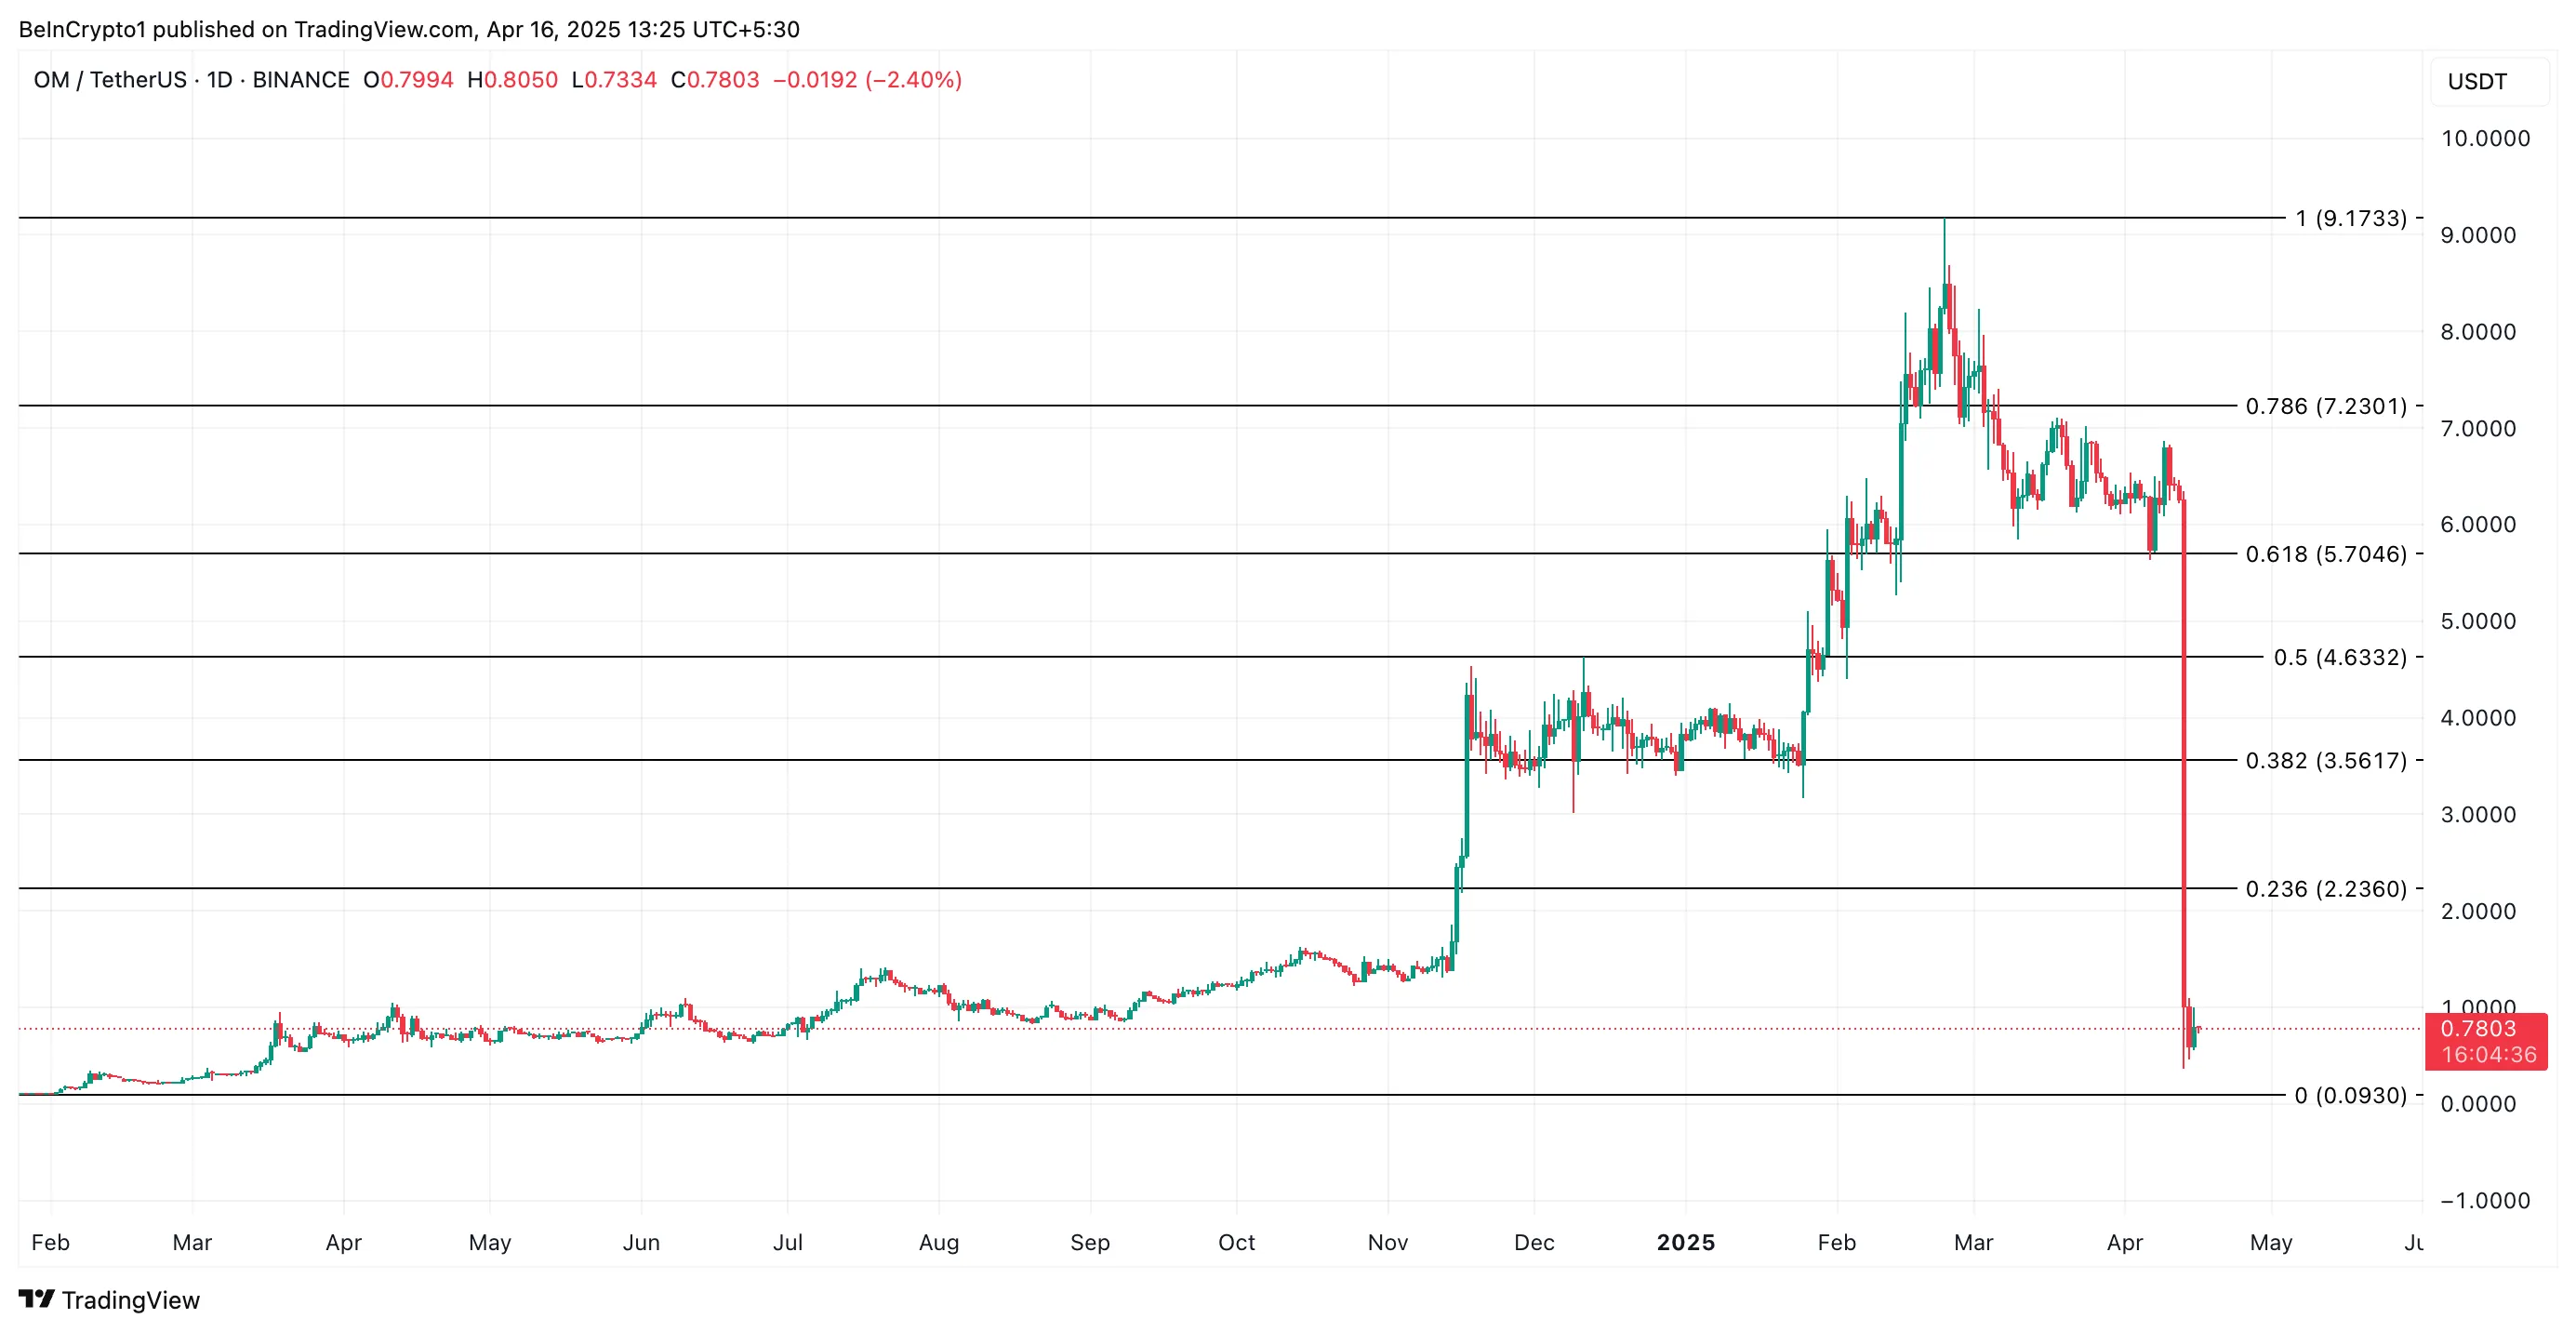
However, if the bears regain market control and increase the downward pressure on OM, it could extend its decline and fall to $0.09, a low it last reached in January 2024.
Disclaimer
In line with the Trust Project guidelines, this price analysis article is for informational purposes only and should not be considered financial or investment advice. BeInCrypto is committed to accurate, unbiased reporting, but market conditions are subject to change without notice. Always conduct your own research and consult with a professional before making any financial decisions. Please note that our Terms and Conditions, Privacy Policy, and Disclaimers have been updated.

Binance co-founder Changpeng Zhao (CZ) announced a major deflationary milestone, confirming the completion of BNB Chain’s 31st quarterly token burn.
In total, 1.57 million BNB, valued at approximately $916 million, was permanently removed from circulation.
BNB Chain Burns $916 Million Worth of Tokens in 31st Quarterly Event
The BNB burn is part of BNB Smart Chain’s long-running commitment to reduce the token’s total supply and potentially bolster long-term value.
According to an official blog post, this quarter’s burn was completed successfully. The remaining total supply of BNB stands at just over 139 million. Former Binance CEO Changpeng Zhao echoed the update with a simple post on X (Twitter).
“$916,000,000 BNB burned,” CZ wrote.
They sent the tokens to a burn address, 0x000…dEaD, making them unrecoverable and effectively reducing the total supply.
The burn occurred under BNB’s Auto-Burn mechanism and marks one of the largest events in the chain’s history. Established under BEP95, BNB’s Auto-Burn system provides transparency and predictability. It adjusts the burn amount based on BNB’s market price and the number of blocks generated on the BNB Smart Chain (BSC) each quarter.
The goal is gradually reducing the token’s circulating supply to 100 million BNB. Once this happens, regular burns will cease.
Deflationary mechanisms are typically bullish, but the market reaction was tepid. BNB’s price slipped 2.11% over the past 24 hours, trading around $578.04 as of this writing.

Impact of BNB Burn on Market Sentiment
The muted response mirrors the aftermath of the 30th burn, suggesting that even billion-dollar reductions in supply are not enough to overcome broader market sentiment or investor fatigue. Meanwhile, community members expressed mixed feelings about the event.
“It actually pains me sometimes to see BNB burns! I know it’s part of the deflationary process… but it still hurts brother CZ,” crypto advocate Shahzad Quadri commented.
Meanwhile, others questioned the utility of such a large burn. Users asked CZ why the BNB chain did not redirect the funds toward marketing efforts.
“It’s not up to me. It was in the whitepaper. A promise is a promise,” CZ replied.
This statement resonated with community leaders, including a MEXC exchange KOL, who responded in a post.
“Saw people wishing it wasn’t burnt. The only way is burning because if it is not burnt, the team won’t be keeping the promise on the whitepaper,” the KOL highlighted.
Changpeng Zhao added a touch of irony, seeming surprised by the size of the burn. Users asked whether this burn was separate from the ongoing gas fee burn introduced under BEP95.
“I have no idea. There are a few different automated burn mechanisms. I learned about this burn on X,” he chimed.
In addition to the quarterly Auto-Burn, BNB implements a real-time burn model that permanently removes a portion of gas fees from circulation. Since its inception, over 259,000 BNB tokens have been burned through this mechanism.

Furthermore, the BNB Pioneer Burn Program continues to cover user losses from accidental token misplacements. It uses quarterly burns to offset such events.
CZ has a personal investment, with 98.6% of his portfolio in BNB as of February. Still, the commitment to scheduled burns and BNB’s critical role across BNB Smart Chain, opBNB Layer 2, and BNB Greenfield blockchain reaffirms the long-term strategy to drive utility, governance participation, and ecosystem growth.

The BNB community is left watching price action, balancing hope in the deflationary model with the reality of market headwinds.
Disclaimer
In adherence to the Trust Project guidelines, BeInCrypto is committed to unbiased, transparent reporting. This news article aims to provide accurate, timely information. However, readers are advised to verify facts independently and consult with a professional before making any decisions based on this content. Please note that our Terms and Conditions, Privacy Policy, and Disclaimers have been updated.

Mantra (OM) Price Pumps As Founder Reveals Massive Token Burn Plan

This Crypto Security Flaw Could Expose Seed Phrases
Mantra’s OM Token Surges 25% After Token Burn Announcement

BNB Burn Reduces Circulating Supply by $916 Million

Ethereum Breakout Imminent? Analyst Expects ETH Price Surge To $2,000

Gold Price Hits New All-Time High Above $3,300 Amid Tariff Turmoil

2.52 Million Altcoins Are Ruining Crypto’s Future

Animoca Brands Valuation Tanks 75% In Two Years, Here’s Why

Crypto exchange BingX hacked for $43 million

Are The Big Players Losing Interest?

Hong Kong’s Securities Association Tips Authorities On Crypto Self-Regulation

Coinbase cbBTC Set to go Live on Solana
2.52 Million Altcoins Are Ruining Crypto’s Future
Animoca Brands Valuation Tanks 75% In Two Years, Here’s Why
Crypto exchange BingX hacked for $43 million
Are The Big Players Losing Interest?
Hong Kong’s Securities Association Tips Authorities On Crypto Self-Regulation
Coinbase cbBTC Set to go Live on Solana
-

 Market22 hours ago
Trump Family Plans Crypto Game Inspired by Monopoly
-

 Market19 hours ago
Bitcoin Eyes $90,000, But Key Resistance Levels Loom
-

 Altcoin23 hours ago
Whispers Of Insider Selling As Mantra DAO Relocates Nearly $27 Million In OM To Binance
-

 Market21 hours ago
ETH Retail Traders Boost Demand Despite Institutional Outflows
-
 Altcoin21 hours ago
Could Tomorrow’s Canada Solana ETF Launch Push SOL Price to $200?
-

 Market23 hours ago
Forget XRP At $3, Analyst Reveals How High Price Will Be In A Few Months
-

 Market15 hours ago
Solana (SOL) Jumps 20% as DEX Volume and Fees Soar
-

 Market14 hours ago
Hedera Under Pressure as Volume Drops, Death Cross Nears
