
Market
Can XRP Price Make It Back up From Two and a Half-Month Lows?

XRP price recently struggled to regain bullish momentum, with the altcoin declining since the start of October. Initially trading well above $0.60, the altcoin has now dipped to $0.51, raising concerns among investors.
This drop indicates a potential continuation of bearish sentiment, leaving market participants cautious about XRP’s near-term outlook.
Ripple Investors Panic
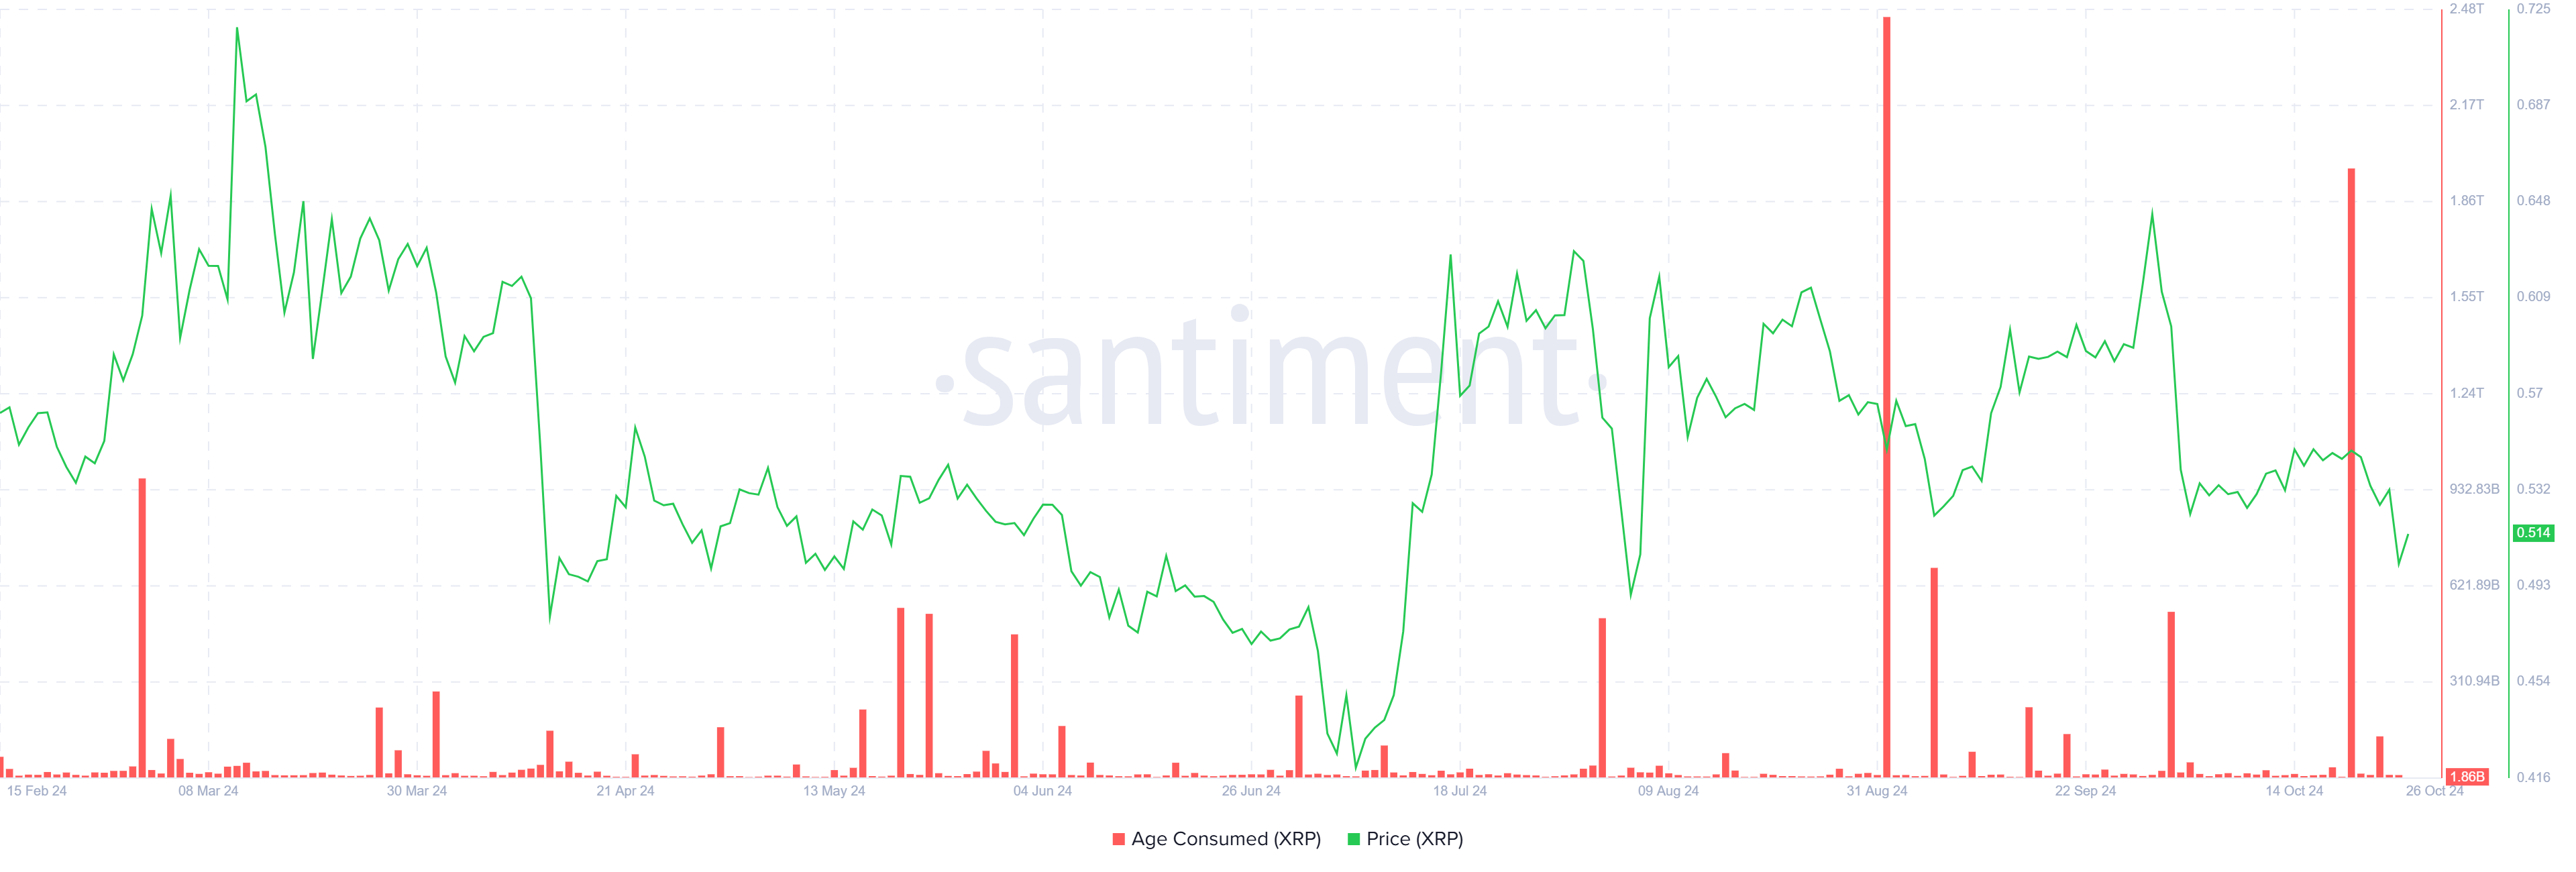
The recent decline in XRP’s price can largely be attributed to long-term holders (LTHs) who reacted with uncertainty as the asset lost ground. The spike in “age consumed” data reveals that these LTHs began moving their holdings immediately following the price drop. This indicates a level of panic among seasoned investors, suggesting they were concerned about risks.
This panic-driven movement among LTHs highlights the fragile sentiment within XRP’s investor community. With experienced holders showing signs of hesitation, XRP’s market appears to be in a delicate position. The lack of confidence among LTHs may create additional selling pressure, potentially exacerbating the downward trend if sentiment does not stabilize.
Read more: XRP ETF Explained: What It Is and How It Works
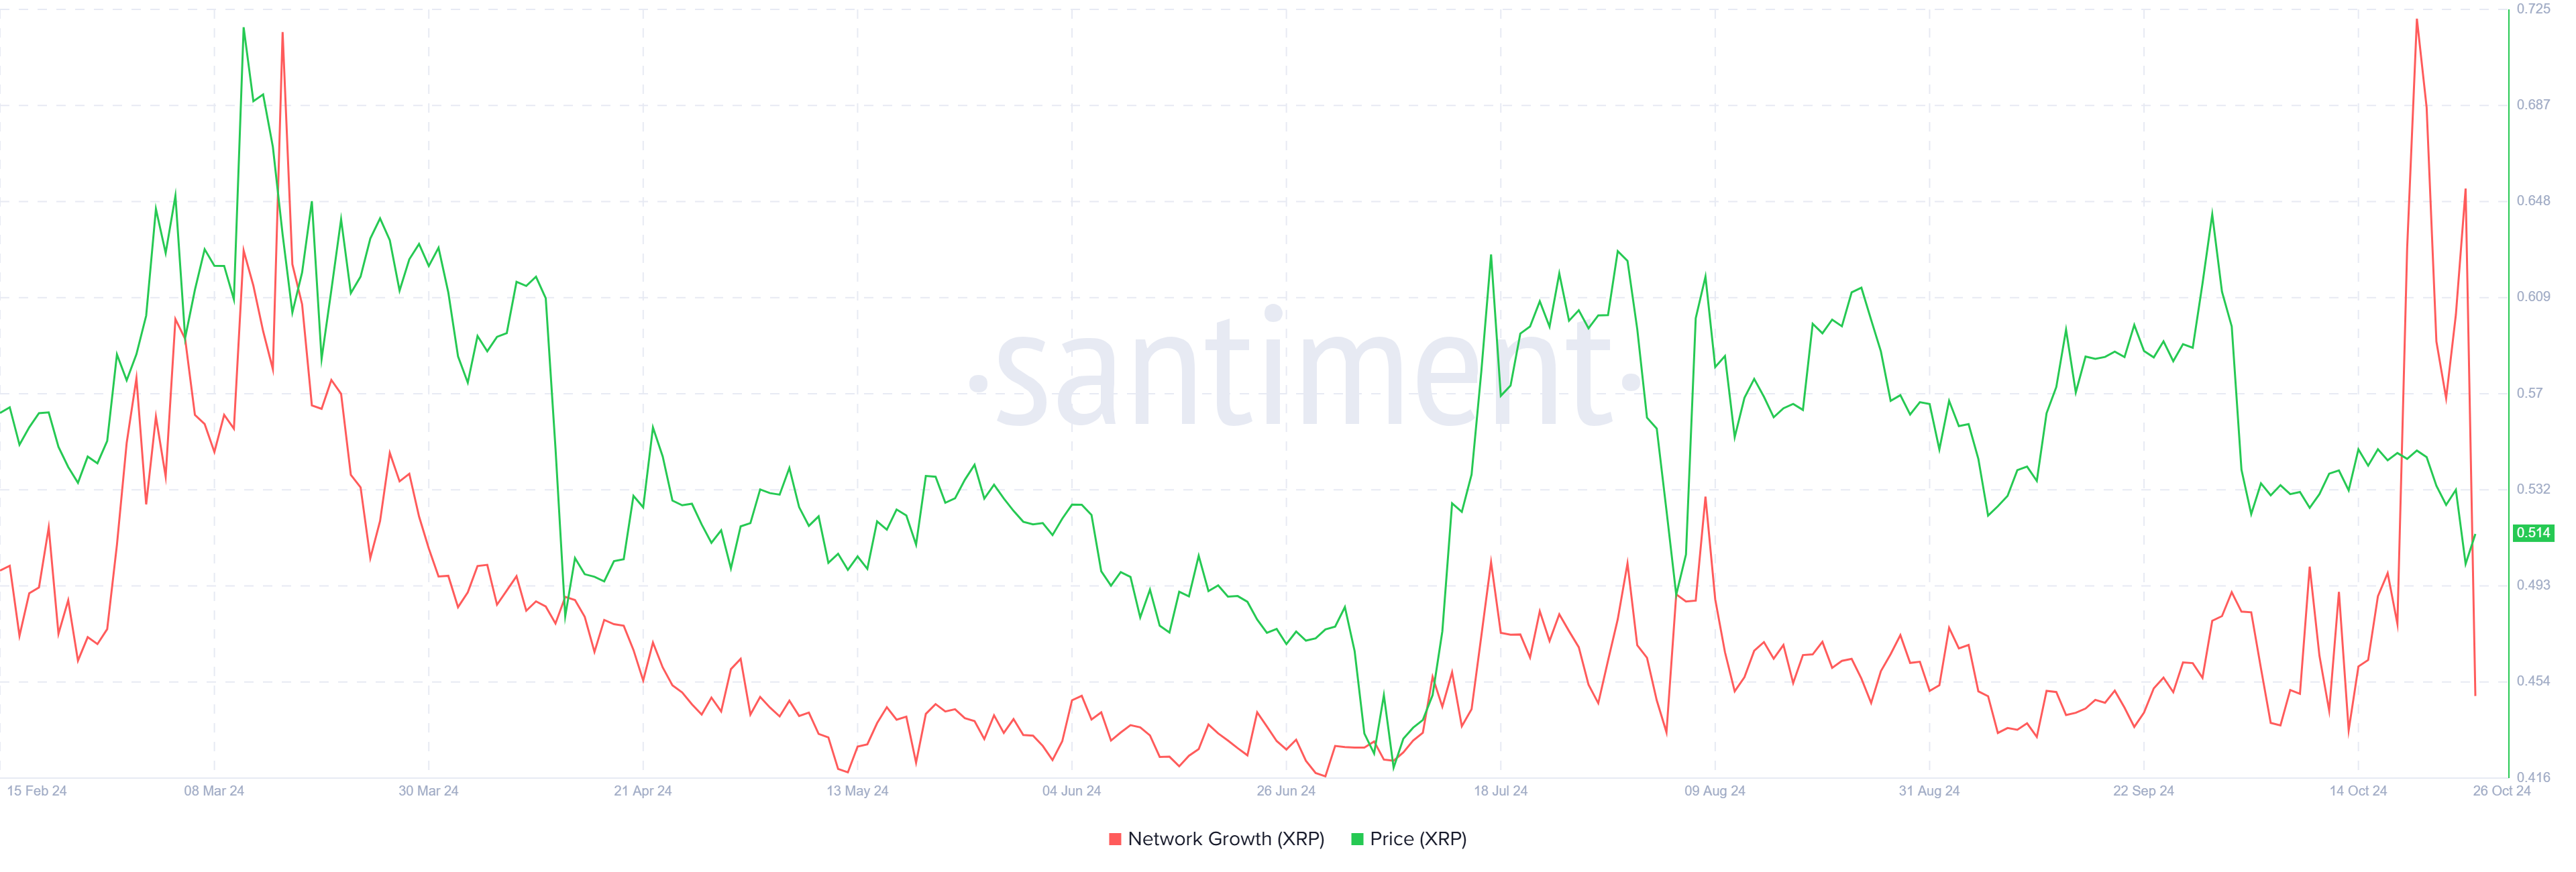
In terms of macro momentum, XRP’s network growth initially saw a boost as its price began to decline, suggesting that new investors were eager to enter the market at lower levels. However, as XRP’s price correction deepened, this initial optimism waned. Network growth has since declined, reflecting a reduction in new addresses joining the XRP network.
The decline in network growth indicates that XRP may be losing traction. While new addresses initially surged in response to lower prices, the continued drop in XRP’s value has tempered enthusiasm among potential buyers.
XRP Price Prediction: Paving Its Way
XRP fell by 5.6% on Friday and is working to reclaim $0.52 as a support level. This level aligns with the 38.2% Fibonacci Retracement line, making it a crucial marker for any potential upward movement. Securing this support could pave the way for a rise toward the $0.55 resistance, offering XRP a chance to stabilize.
Currently, XRP is holding above the 23.6% Fibonacci line at $0.47, often seen as the bear market support floor. This level provides a foundation that could prevent a further drawdown, helping XRP avoid more significant losses if market conditions remain stable.
Read more: Ripple (XRP) Price Prediction 2024/2025/2030
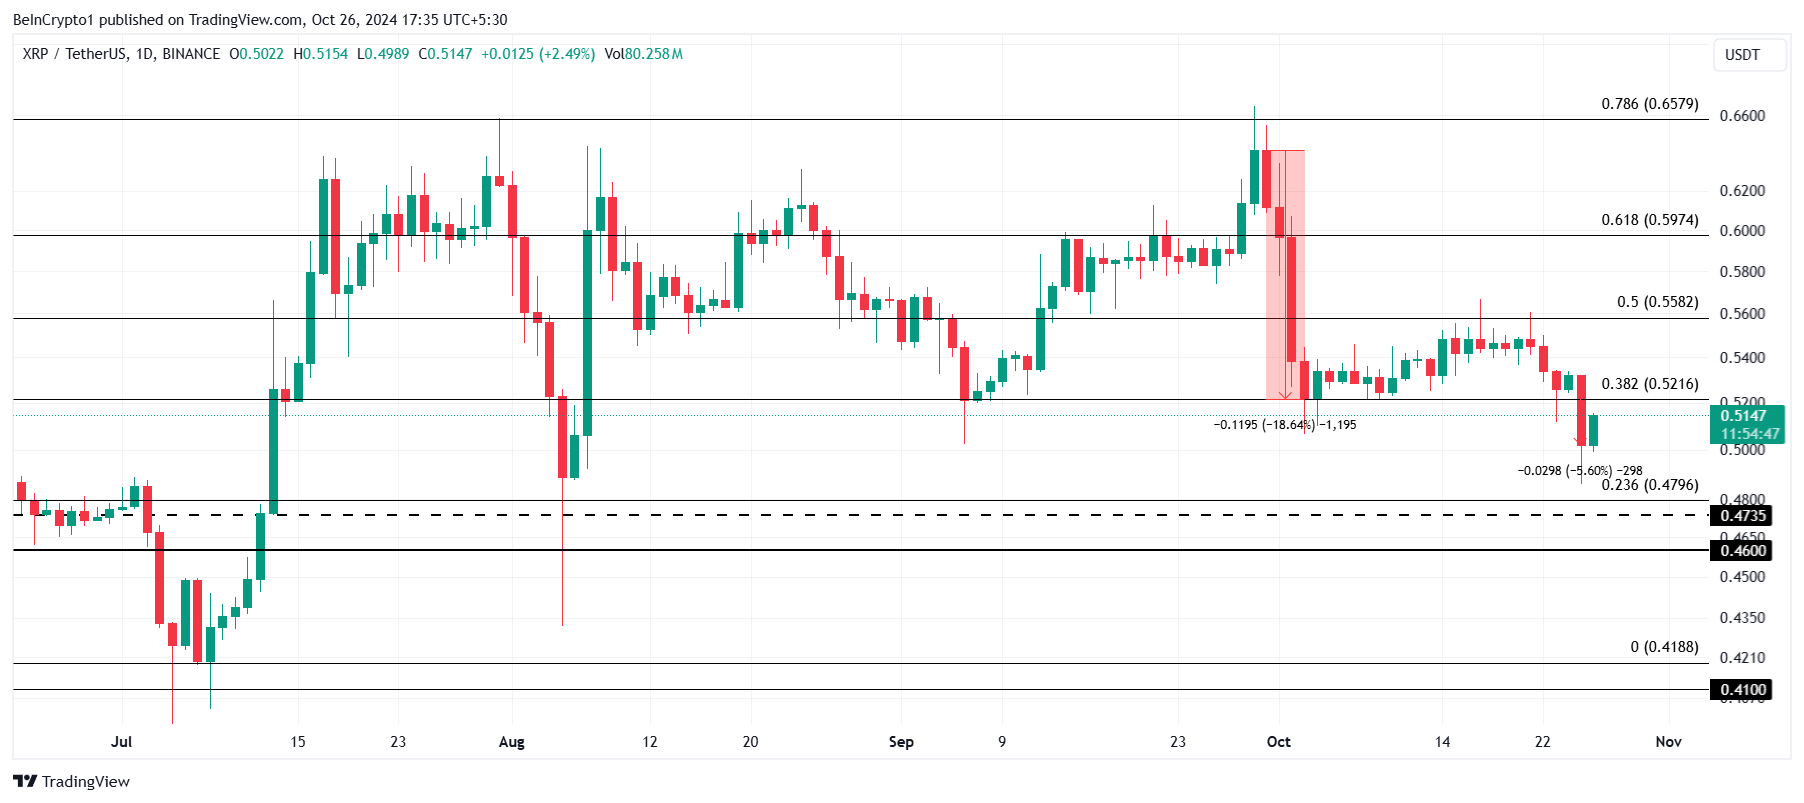
However, the lack of strong, bullish signals presents a challenge for XRP’s recovery. If XRP manages to flip $0.52 into support, it could rally back to $0.55, countering the bearish-neutral outlook.
Disclaimer
In line with the Trust Project guidelines, this price analysis article is for informational purposes only and should not be considered financial or investment advice. BeInCrypto is committed to accurate, unbiased reporting, but market conditions are subject to change without notice. Always conduct your own research and consult with a professional before making any financial decisions. Please note that our Terms and Conditions, Privacy Policy, and Disclaimers have been updated.


According to data from StakingRewards, Solana (SOL) has overtaken Ethereum (ETH) in staking market capitalization, reaching $53.15 billion compared to Ethereum’s $53.72 billion.
This milestone has sparked heated discussions across the social media platform X, raising the question: Is this a turning point for Solana, or merely a short-lived surge?
Solana Outpaces Ethereum As High Staking Yields Prove Appealing
Recent data reveals that 64.86% of Solana‘s total supply is currently staked, delivering an impressive annual percentage yield (APY) of 8.31%. In contrast, Ethereum has only 28.18% of its supply staked, with an APY of 2.98%.
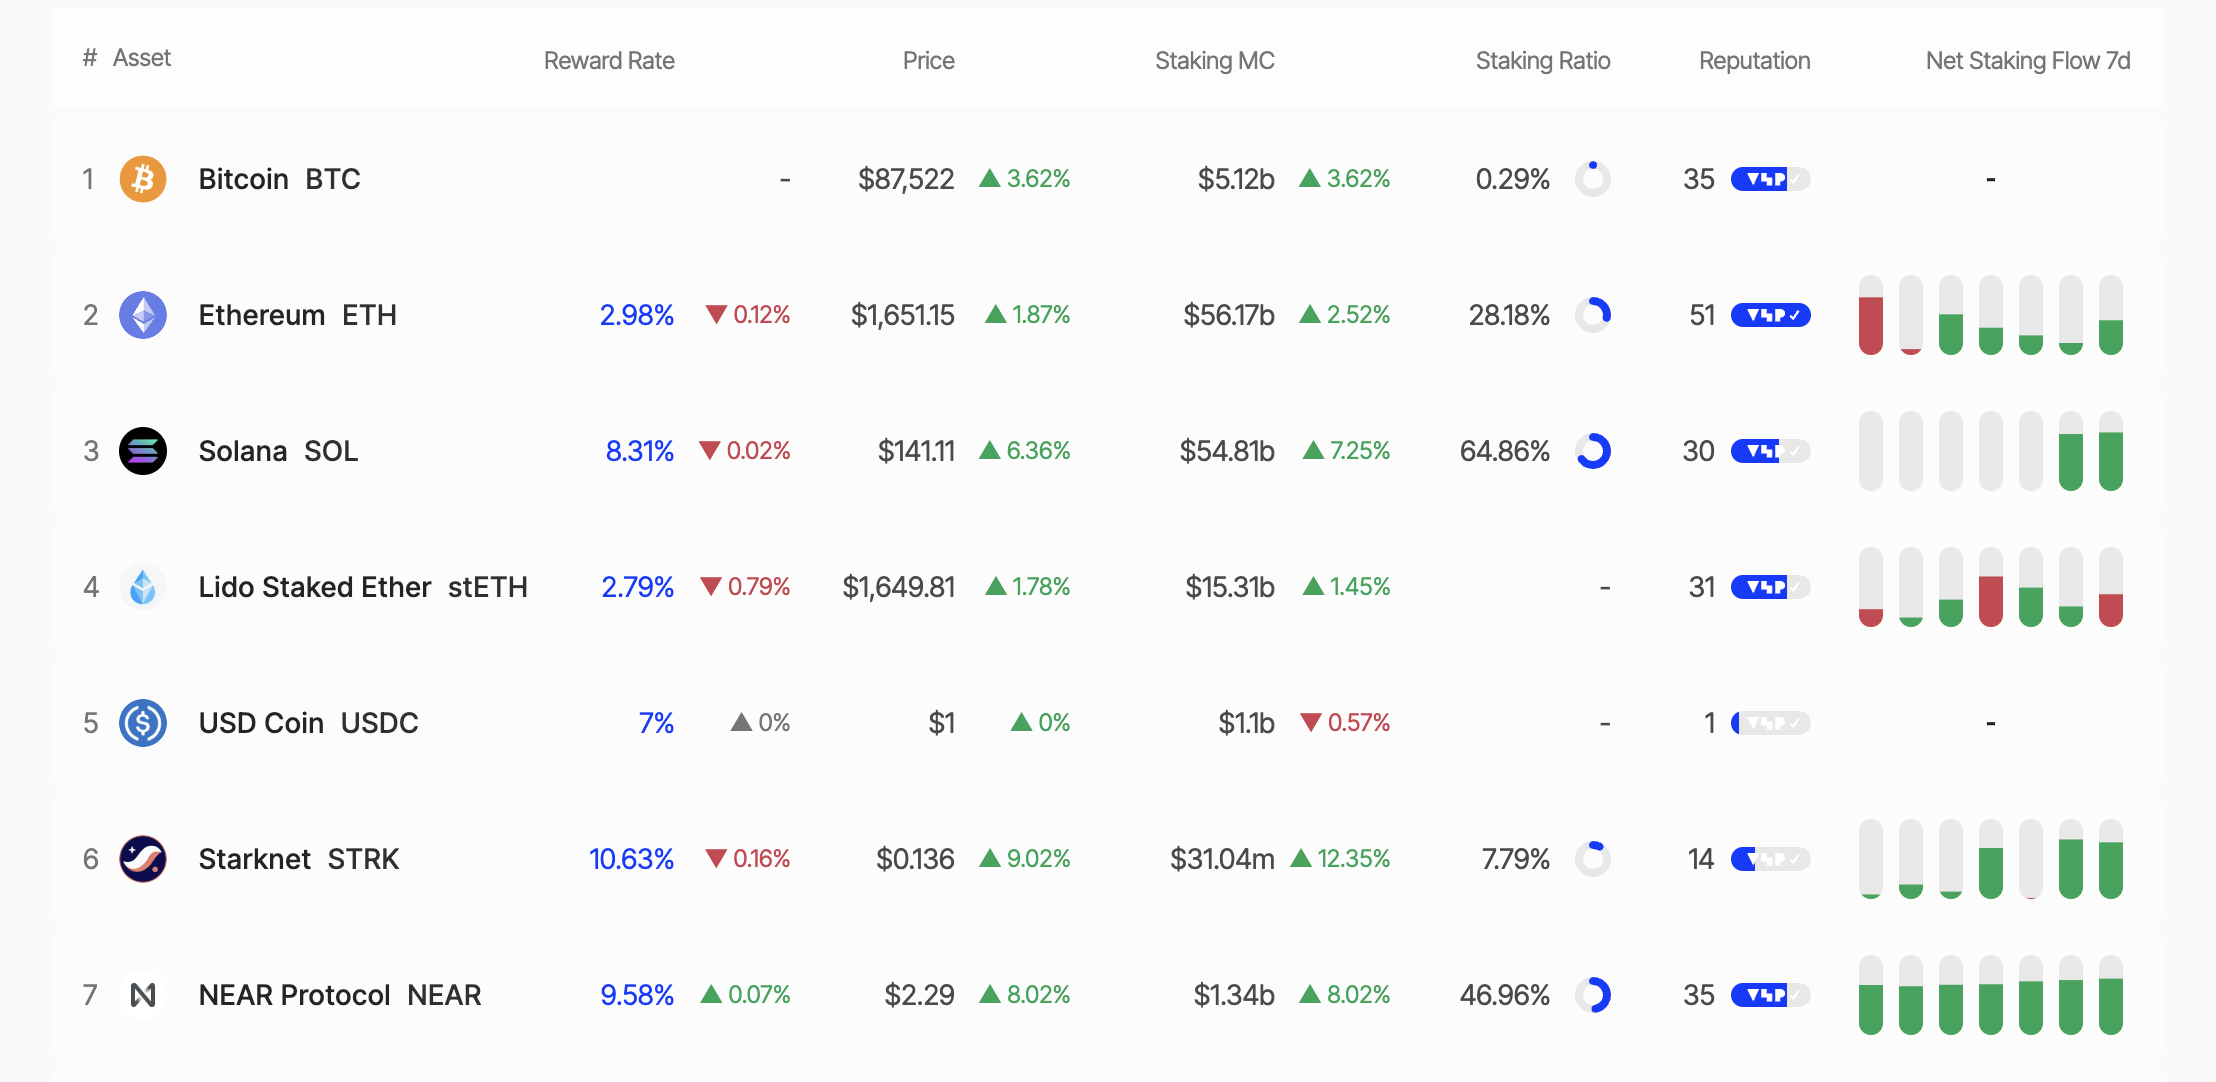
This disparity highlights Solana’s growing appeal for investors seeking passive income through staking. Staking market capitalization is calculated by multiplying the total number of staked tokens by their current price. With SOL priced at $138.91 as of this writing, Solana has officially surpassed Ethereum in this metric.
However, Solana’s high staking ratio has sparked some controversy. Critics, such as Dankrad Feist on X, argue that Solana’s lack of a slashing mechanism (or penalties for validator violations) undermines the economic security of its staking model. With its slashing mechanism, Ethereum offers greater security, despite its lower staking ratio.
“It’s very ironic to call it ‘staking’ when there is no slashing. What’s at stake? Solana has close to zero economic security at the moment,” Dankrad Feist shared.
Increased Whale Activity Signals Caution
Meanwhile, recent moves by “whales” (large investors) have further fueled interest in Solana. On April 20, 2025, a whale unstaked 37,803 SOL (worth $5.26 million). Similarly, Galaxy Digital withdrew 606,000 SOL from exchanges over four days (April 15–19, 2025), concluding with 462,000 SOL.
Additionally, on April 17, 2025, a newly created wallet withdrew approximately $5.15 million worth of SOL from the Binance exchange. In the same tone, Binance whales withdrew over 370,000 SOL tokens valued at $52.78 million.
While some whales withdrew their SOL holdings, other large holders accumulated. Janover, a US-listed company, increased its Solana holdings to 163,651.7 SOL (worth $21.2 million) and partnered with Kraken exchange for staking on April 16, 2025.
These actions signal diverging plays from institutional investors and whales, as the Solana price fluctuates around key levels.
SOL Price Analysis: Opportunities and Challenges
As of this writing, SOL was trading at $140.49, up 3.53% in the past 24 hours. Analysts highlight $129 as crucial support for the Solana price, with $144 presenting the key roadblock to overcome before Solana’s upside potential can be realized. Breaking above the aforementioned roadblock could propel SOL toward new highs.
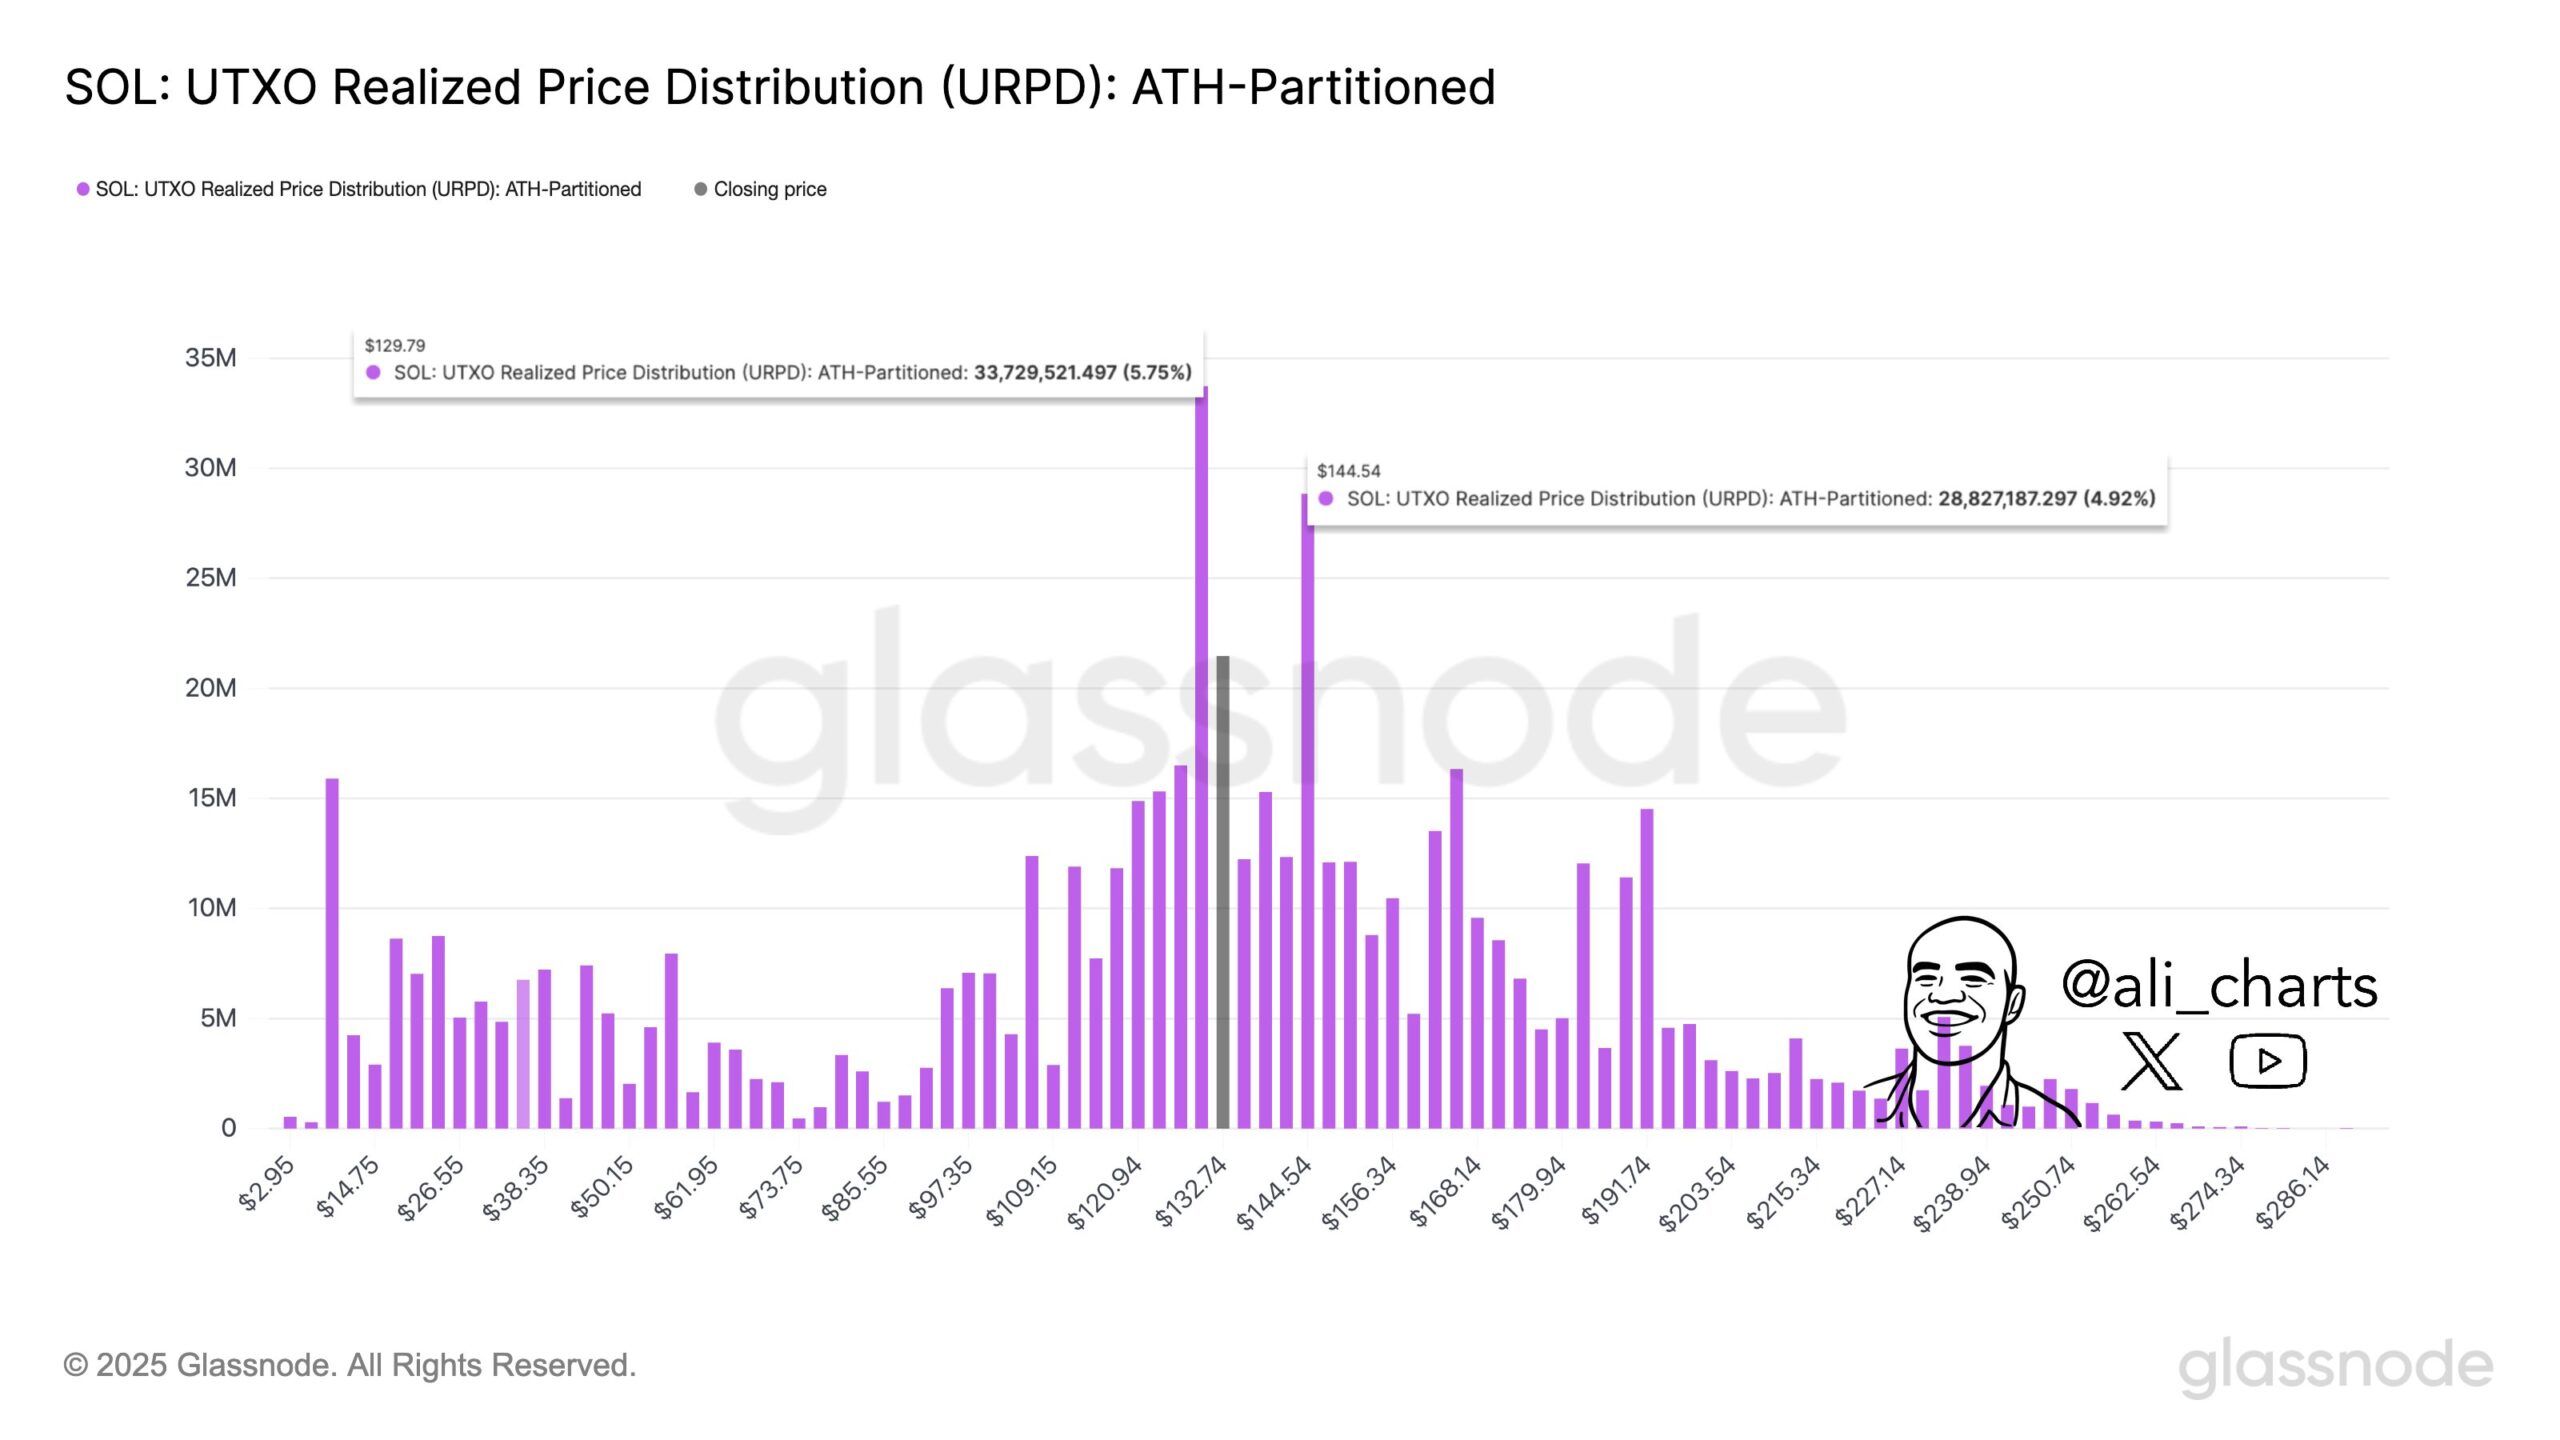
Conversely, dropping below the $129 support level could trigger increased selling pressure. Nevertheless, SOL has shown a remarkable recovery, with a 14.34% increase over the past week.
Another factor to consider is the ongoing development of the Solana ecosystem. Key innovations include the QUIC data transfer protocol, the combination of Proof-of-History (PoH) and Proof-of-Stake (PoS), and the diversification of validator clients.
With these, Solana continues to enhance its performance and decentralization. Additionally, the launch of the Solang compiler, compatible with Ethereum’s Solidity, has attracted developers from the Ethereum ecosystem.
BeInCrypto also reported on Solana’s upcoming community conference, otherwise termed Solana Breakpoint. Key announcements from this event could provide further tailwinds for the SOL price.
Nevertheless, despite surpassing Ethereum in staking market capitalization, Solana faces significant challenges. Ethereum benefits from a more mature DeFi ecosystem, greater institutional trust, and enhanced security through its slashing mechanism.
To some, Ethereum’s lower staking ratio (28%) may be a deliberate strategy to reduce network pressure and ensure liquidity for DeFi applications.
In contrast, Solana’s high staking ratio (65%) could limit liquidity within its DeFi ecosystem. This raises the question of whether Solana can strike a balance between staking and the growth of its decentralized applications.
As Solana continues challenging Ethereum’s dominance, the crypto community remains divided. Is Solana’s rise a sustainable breakthrough, or just another wave of hype?
Disclaimer
In adherence to the Trust Project guidelines, BeInCrypto is committed to unbiased, transparent reporting. This news article aims to provide accurate, timely information. However, readers are advised to verify facts independently and consult with a professional before making any decisions based on this content. Please note that our Terms and Conditions, Privacy Policy, and Disclaimers have been updated.

Reason to trust
![]()
Strict editorial policy that focuses on accuracy, relevance, and impartiality
Created by industry experts and meticulously reviewed
The highest standards in reporting and publishing
Strict editorial policy that focuses on accuracy, relevance, and impartiality
Morbi pretium leo et nisl aliquam mollis. Quisque arcu lorem, ultricies quis pellentesque nec, ullamcorper eu odio.
Ethereum price started a increase from the $1,550 zone. ETH is now rising and might attempt to recover above the $1,650 resistance.
- Ethereum started a fresh increase above the $1,580 and $1,600 levels.
- The price is trading above $1,600 and the 100-hourly Simple Moving Average.
- There was a break above a connecting bearish trend line with resistance at $1,590 on the hourly chart of ETH/USD (data feed via Kraken).
- The pair could start a fresh increase if it clears the $1,650 resistance zone.
Ethereum Price Eyes Upside Break
Ethereum price remained stable above the $1,500 level and started a fresh increase, like Bitcoin. ETH traded above the $1,550 and $1,600 levels to enter a short-term positive zone.
There was a break above a connecting bearish trend line with resistance at $1,590 on the hourly chart of ETH/USD. The pair even cleared the $1,620 resistance. A high was formed at $1,644 and the price is stable above the 23.6% Fib retracement level of the upward move from the $1,566 swing low to the $1,644 high.
Ethereum price is now trading above $1,600 and the 100-hourly Simple Moving Average. On the upside, the price seems to be facing hurdles near the $1,640 level. The next key resistance is near the $1,650 level. The first major resistance is near the $1,680 level.

A clear move above the $1,680 resistance might send the price toward the $1,720 resistance. An upside break above the $1,720 resistance might call for more gains in the coming sessions. In the stated case, Ether could rise toward the $1,800 resistance zone or even $1,840 in the near term.
Downside Correction In ETH?
If Ethereum fails to clear the $1,650 resistance, it could start a downside correction. Initial support on the downside is near the $1,620 level. The first major support sits near the $1,605 zone and the 50% Fib retracement level of the upward move from the $1,566 swing low to the $1,644 high.
A clear move below the $1,605 support might push the price toward the $1,580 support. Any more losses might send the price toward the $1,550 support level in the near term. The next key support sits at $1,500.
Technical Indicators
Hourly MACD – The MACD for ETH/USD is gaining momentum in the bullish zone.
Hourly RSI – The RSI for ETH/USD is now above the 50 zone.
Major Support Level – $1,600
Major Resistance Level – $1,650
Barry Silbert, CEO of Digital Currency Group, has stated that Bittensor (TAO) has the potential to outperform Bitcoin (BTC) as a global store of value.
His comments come amid notable growth in the Bittensor network, with its subnet ecosystem market capitalization and the TAO token’s price on the rise.
Will Bittensor’s Decentralized AI Model Outperform Bitcoin’s Legacy?
In a recent interview with Raoul Pal, Silbert highlighted the growing influence of artificial intelligence (AI) in the crypto sector. According to him, Bittensor is at the forefront of this revolution, representing the “next big era for crypto.”
“You had the Bitcoin and the Ethereum and the NFTs, and you had the layer 2s and DeFi. I think this is the next big investment theme for crypto,” Silbert stated.
He went on to explain that Bittensor shares the same pioneering spirit as early Bitcoin. Still, its purpose extends beyond financial sovereignty.
“The boldest prediction that I could make for Bittensor is it could be a better version of Bitcoin as a global store of value,” he claimed.
He argued that instead of the $10 to $12 billion spent annually to secure the Bitcoin network, that same amount could be redirected toward incentivizing a global network of individuals working to solve major world problems. He envisions this money fostering innovation on a massive scale, with the potential to grow into a multi-billion-dollar ecosystem.
While acknowledging the value of securing the Bitcoin network, Silbert emphasized that Bittensor’s potential lies in its ability to harness this vast financial backing to address real-world challenges.
He noted that Bittensor operates on a similar economic model to Bitcoin, with halving mechanisms and decentralization, positioning it as a powerful contender in the quest for a more impactful and value-driven global network.
Silbert also noted that while plenty of decentralized AI projects have emerged, Bittensor has set itself apart. He referred to it as having reached “escape velocity.” This term is used to convey a project’s rapid growth and increasing market influence.
“99.9% of crypto tokens that are out there have no reason to exist and are worthless,” he added.
Market data reflects the growing enthusiasm for Bittensor. Notably, amid the ongoing volatility, TAO has fared well in comparison to the broader market, rising 32.1% in the last week. At press time, the altcoin was trading at $328, up 7.2% over the past day.

Additionally, TAO is currently the top trending cryptocurrency on CoinGecko, underlining its rising popularity among investors. Google Trends data further proves the growing interest in Bittensor. The search volume peaked at 100 at the time of writing.
Meanwhile, the Bittensor ecosystem is also seeing notable progress. The latest data indicated that the market capitalization of Bittensor’s subnet tokens more than doubled in April 2025.

It increased by 166%, rising from $181 million at the beginning of April to $481 million at press time. As reported by BeInCrypto, this growth follows a tripling of active subnets over the past year.
Disclaimer
In adherence to the Trust Project guidelines, BeInCrypto is committed to unbiased, transparent reporting. This news article aims to provide accurate, timely information. However, readers are advised to verify facts independently and consult with a professional before making any decisions based on this content. Please note that our Terms and Conditions, Privacy Policy, and Disclaimers have been updated.

Solana Staking Cap Surpasses Ethereum, But Is This Sustainable?

Dollar Dips While Bitcoin Hits New Heights

Ethereum Price Clings to Support—Upside Break Could Trigger Rally

Expert Reveals Why BlackRock Hasn’t Pushed for an XRP ETF
Will Bittensor Surpass Bitcoin as a Store of Value? Expert Predicts

Solana, Bitcoin in Texas, and Initia

2.52 Million Altcoins Are Ruining Crypto’s Future

Animoca Brands Valuation Tanks 75% In Two Years, Here’s Why

Crypto exchange BingX hacked for $43 million

Are The Big Players Losing Interest?

Hong Kong’s Securities Association Tips Authorities On Crypto Self-Regulation

Coinbase cbBTC Set to go Live on Solana
2.52 Million Altcoins Are Ruining Crypto’s Future
Animoca Brands Valuation Tanks 75% In Two Years, Here’s Why
Crypto exchange BingX hacked for $43 million
Are The Big Players Losing Interest?
Hong Kong’s Securities Association Tips Authorities On Crypto Self-Regulation
Coinbase cbBTC Set to go Live on Solana
-
 Market19 hours ago
1 Year After Bitcoin Halving: What’s Different This Time?
-

 Market23 hours ago
MELANIA Crashes to All-Time Low Amid Insiders Continued Sales
-

 Market20 hours ago
VOXEL Climbs 200% After Suspected Bitget Bot Glitch
-

 Market18 hours ago
Tokens Big Players Are Buying
-

 Market24 hours ago
Charles Schwab Plans Spot Crypto Trading Rollout in 2026
-

 Market17 hours ago
Dogecoin Defies Bullish Bets During Dogeday Celebration
-

 Market14 hours ago
Will XRP Break Support and Drop Below $2?
-

 Altcoin22 hours ago
XRP Leads Crypto Shopping List For Latin America Ahead Of ETH, SOL—Report