
Market
Can Tellor (TRB) Reach $232 Despite $5.46 Million Whale Sell-Off?

In a noteworthy series of moves by crypto whales, a total of $5.46 million worth of Tellor (TRB) tokens were recently moved to centralized exchanges.
This indicates potential sales impacting the token’s market dynamics. The Tellor whales’ activities coincide with TRB’s significant price volatility, suggesting potential profit-taking.
Can TRB Hit $232 Despite Crypto Whales Selling?
Spot On Chain, an on-chain analysis platform, tracked a significant transaction where a crypto whale wallet 0xf2b deposited 10,582 TRB (approximately $1.32 million) to Coinbase. The crypto whale made the transaction at a price of around $124.
Previously, this wallet withdrew the tokens at an average price of $57.7. Hence, he will realize an estimated profit of $706,000—a 116% gain in nearly two months.
Read more: A Comprehensive Guide on Tracking Smart Money in the Crypto Market
Additionally, several other crypto whales replicated this pattern of buying low and selling high between early March and May 2024.
“Lastly, please note that this is the sixth whale that withdrew TRB from Coinbase between early March and May and then deposited all tokens back to the CEX for profits in the past 3 days after the price surged up to 108%,” Spot On Chain said.
For instance, another crypto whale wallet, 0xeb1, deposited 10,486 TRB (valued at about $1.38 million) to Coinbase. The crypto whale withdrew TRB at an average price of $76.59. He held the tokens for over two months, securing a profit of $581,000, representing a 72.4% return.
Moreover, a third crypto whale wallet, 0xb4b, engaged in a similar strategy, selling TRB tokens worth approximately $1.4 million to achieve a profit of $488,000 (54.5%). Also, another crypto whale – 0xfac, deposited 10,375 TRB ( ~ 1.36 million) to Coinbase to realize an estimated profit of $461,000.
These strategic trades underscore a common approach among crypto whales to maximize returns within relatively short trading periods.
Despite these substantial sales, TRB’s market performance has demonstrated resilience. The token recently experienced a breakout from a bull flag pattern, a bullish continuation pattern characterized by a swift price movement followed by a consolidation phase resembling a flag.
This breakout indicates that TRB might extend its uptrend, with crypto analysts like Emre suggesting a potential target of $232.
Read more: Everything You Need To Know About Bull Flag Patterns
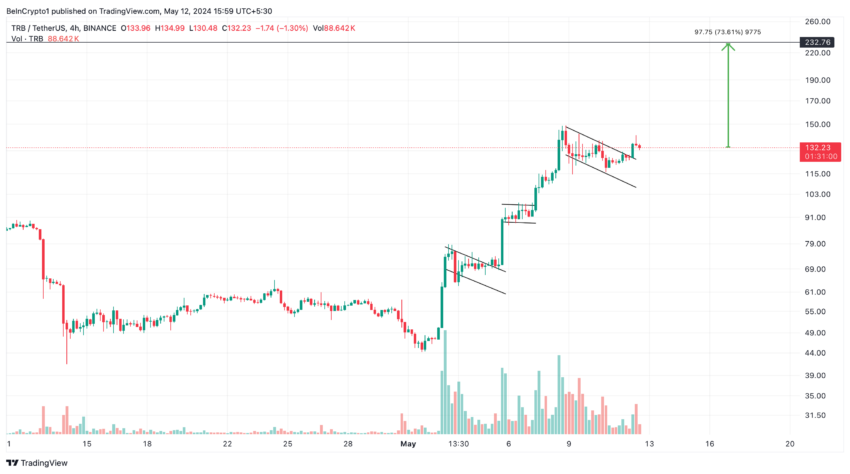
However, this bullish forecast would be invalidated if TRB falls below a critical support level of $115.As TRB continues to show robust market movements, stakeholders should closely monitor these developments.
Disclaimer
In line with the Trust Project guidelines, this price analysis article is for informational purposes only and should not be considered financial or investment advice. BeInCrypto is committed to accurate, unbiased reporting, but market conditions are subject to change without notice. Always conduct your own research and consult with a professional before making any financial decisions. Please note that our Terms and Conditions, Privacy Policy, and Disclaimers have been updated.


Coinbase filed with the US Commodity Futures Trading Commission (CFTC) to launch futures contracts for Ripple’s XRP token.
The move comes after a positive development for the crypto derivatives market in the US, reflecting shifting regulatory ties in the country.
Coinbase Files for XRP Futures Trading With CFTC
Coinbase Derivatives has submitted a filing to self-certify XRP futures. It will provide a regulated, capital-efficient means for market participants to gain exposure to XRP. The new contract could go live as soon as April 21.
“We’re excited to announce that Coinbase Derivatives has filed with the CFTC to self-certify XRP futures – bringing a regulated, capital-efficient way to gain exposure to one of the most liquid digital assets. We anticipate the contract going live on April 21, 2025,” read the announcement.
Meanwhile, the official filing indicates that the XRP futures contract will be a monthly cash-settled and margined contract trading under the symbol XRL.
Each contract represents 10,000 XRP and will be settled in US dollars. Trading will be available for the current month and two subsequent months. As a protective measure, trading will be temporarily halted if the spot XRP price moves more than 10% within an hour.
The Coinbase Exchange also confirmed that it has engaged with Futures Commission Merchants (FCMs) and other market participants. Both references reportedly expressed support for the launch.
However, Coinbase is not the first US-based exchange to introduce regulated XRP futures. In March, Chicago-based Bitnomial launched what it advertised as the country’s first CFTC-regulated XRP futures contract.
For Coinbase, however, the boldness comes after the CFTC eased key regulatory hurdles for crypto derivatives trading. As BeInCrypto reported, this signaled a more accommodating stance towards the sector.
“Pursuant to Commodity Futures Trading Commission (“CFTC” or “Commission”) Regulation 40.2(a), Coinbase Derivatives, LLC (the “Exchange” or “COIN”) hereby submits for self-certification its initial listing of the XRP Futures contract to be offered for trading on the Exchange…,” an excerpt in the filing indicated.
This suggests that the commodities regulator’s shift, revoking previous crypto-related guidelines, may boost institutional confidence. For XRP, this development bolsters confidence in the asset’s previously contentious status following Ripple’s recent regulatory breakthrough.
“Coinbase Derivatives’ filing with the CFTC to self-certify XRP futures aims to legitimize XRP trading by offering a regulated, capital-efficient product for investors,” one user remarked.
The futures contract might also help the odds of XRP ETF approval. Recently, the SEC delayed several applications to create one, and its status is in limbo.
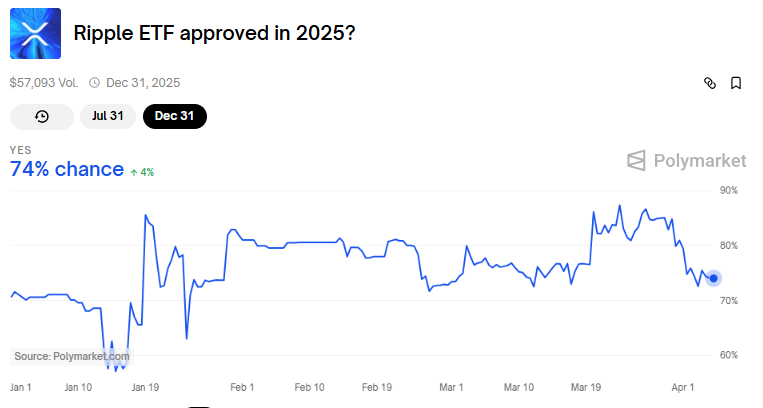
Data on Polymarket shows bettors see a 74% chance for XRP ETF approval in 2025 and a more modest 34% by July 31.
Regulatory and Legal Developments Favor Coinbase
Elsewhere, the timing of this filing aligns with recent favorable regulatory developments for Coinbase. Reports suggest Illinois intends to drop its lawsuit against the exchange over its staking services.
Up to 10 states filed a lawsuit against Coinbase in June 2023 alleging that its staking program constituted unregistered securities offerings.
This recent development makes Illinois the fourth state to withdraw legal action against Coinbase. Vermont, South Carolina, and Kentucky also dismissed their cases on March 13, 27, and 31, respectively.
However, the cases remain active in Alabama, California, Maryland, New Jersey, Washington and Wisconsin.
These legal retreats coincide with the US SEC’s (Securities and Exchange Commission) February decision to abandon its federal lawsuit against Coinbase. BeInCrypto reported that this development marked a broader shift in the regulatory approach under the current administration.
“Regulators are losing steam, and Coinbase is stacking quiet courtroom wins. Staking’s future in the US might just be back on track,” a user commented.
Illinois’ decision to drop its lawsuit comes as the state advances a Bitcoin strategic reserve bill. Specifically, Illinois State Representative John M. Cabello introduced House Bill 1844 (HB1844), highlighting Bitcoin’s potential as a decentralized, finite digital asset.
“A strategic bitcoin reserve aligns with Illinois’ commitment to fostering innovation in digital assets and providing Illinoisans with enhanced financial security,” the bill read.
Disclaimer
In adherence to the Trust Project guidelines, BeInCrypto is committed to unbiased, transparent reporting. This news article aims to provide accurate, timely information. However, readers are advised to verify facts independently and consult with a professional before making any decisions based on this content. Please note that our Terms and Conditions, Privacy Policy, and Disclaimers have been updated.

Dogecoin started a fresh decline from the $0.180 zone against the US Dollar. DOGE is consolidating and might struggle to recover above $0.1680.
- DOGE price started a fresh decline below the $0.1750 and $0.170 levels.
- The price is trading below the $0.1680 level and the 100-hourly simple moving average.
- There was a break below a key bullish trend line forming with support at $0.170 on the hourly chart of the DOGE/USD pair (data source from Kraken).
- The price could extend losses if it breaks the $0.1550 support zone.
Dogecoin Price Dips Again
Dogecoin price started a fresh decline after it failed to clear $0.180, like Bitcoin and Ethereum. DOGE dipped below the $0.1750 and $0.1720 support levels.
There was a break below a key bullish trend line forming with support at $0.170 on the hourly chart of the DOGE/USD pair. The bears were able to push the price below the $0.1620 support level. It even traded close to the $0.1550 support.
A low was formed at $0.1555 and the price is now consolidating losses. There was a minor move above the 23.6% Fib retracement level of the downward move from the $0.180 swing high to the $0.1555 low.
Dogecoin price is now trading below the $0.170 level and the 100-hourly simple moving average. Immediate resistance on the upside is near the $0.1650 level. The first major resistance for the bulls could be near the $0.1680 level. It is near the 50% Fib retracement level of the downward move from the $0.180 swing high to the $0.1555 low.

The next major resistance is near the $0.1740 level. A close above the $0.1740 resistance might send the price toward the $0.180 resistance. Any more gains might send the price toward the $0.1880 level. The next major stop for the bulls might be $0.1950.
Another Decline In DOGE?
If DOGE’s price fails to climb above the $0.170 level, it could start another decline. Initial support on the downside is near the $0.160 level. The next major support is near the $0.1550 level.
The main support sits at $0.150. If there is a downside break below the $0.150 support, the price could decline further. In the stated case, the price might decline toward the $0.1320 level or even $0.120 in the near term.
Technical Indicators
Hourly MACD – The MACD for DOGE/USD is now losing momentum in the bearish zone.
Hourly RSI (Relative Strength Index) – The RSI for DOGE/USD is now above the 50 level.
Major Support Levels – $0.1600 and $0.1550.
Major Resistance Levels – $0.1680 and $0.1740.

The crypto market is set to see $2.58 billion in Bitcoin and Ethereum options expire today, a development that could trigger short-term price volatility and impact traders’ profitability.
Of this total, Bitcoin (BTC) options account for $2.18 billion, while Ethereum (ETH) options represent $396.16 million.
Bitcoin and Ethereum Holders Brace For Volatility
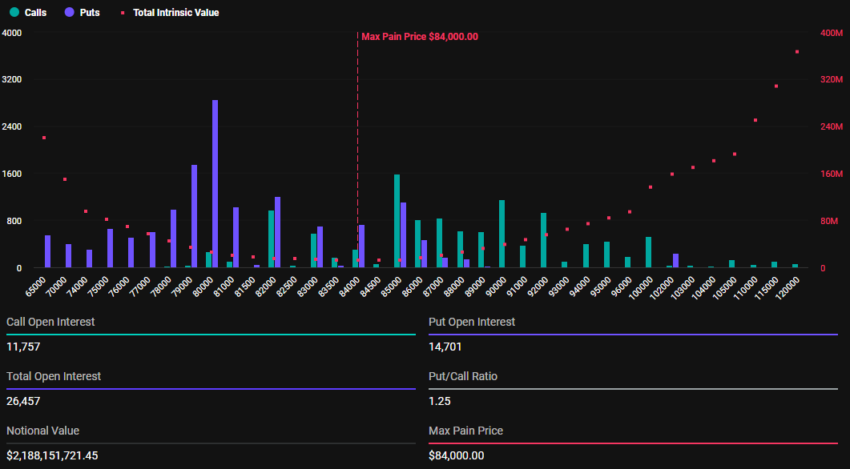
According to data on Deribit, 26,457 Bitcoin options will expire today, significantly lower than the first quarter (Q1) closer, where 139,260 BTC contracts went bust last week. The options contracts due for expiry today have a put-to-call ratio 1.25 and a maximum pain point of $84,000.
The put-to-call ratio indicates a higher volume of puts (sales) relative to calls (purchases), indicating a bearish sentiment. More traders or investors are betting on or protecting against a potential market drop.
On the other hand, 221,303 Ethereum options will also expire today, down from 1,068,519 on the last Friday of March. With a put-to-call ratio of 1.41 and a max pain point of $1,850, the expirations could influence ETH’s short-term price movement.
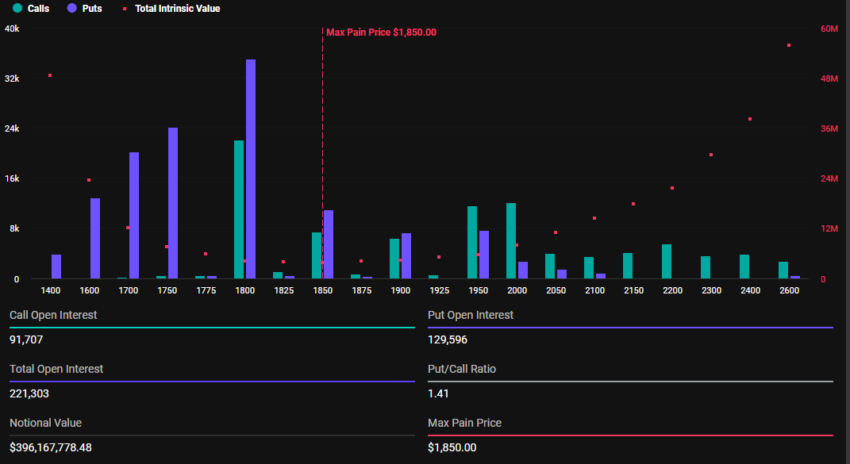
As the options contracts near expiration at 8:00 UTC today, Bitcoin and Ethereum prices are expected to approach their respective maximum pain points. According to BeInCrypto data, BTC was trading at $82,895 as of this writing, whereas ETH was exchanging hands for $1,790.
This suggests that prices might rise as smart money aims to move them toward the “max pain” level. Based on the Max Pain theory, options prices tend to gravitate toward strike prices where the highest number of contracts, both calls and puts, expire worthless.
Nevertheless, price pressure on BTC and ETH will likely ease after 08:00 UTC on Friday when Deribit settles the contracts. However, the sheer scale of these expirations could still fuel heightened volatility in the crypto markets.
“Where do you see the market going next? Deribit posed.
Elsewhere, analysts at Greeks.live explain the current market sentiment, highlighting a bearish outlook. This adds credence to why more traders are betting on or protecting against a potential market drop.
Bearish Sentiment Grips Markets
In a post on X (Twitter), Greeks.live reported a predominantly bearish sentiment in the options market. This follows US President Donald Trump’s tariff announcement.
BeInCrypto reported that the new tariffs constituted a 10% blanket rate and 25% on autos. While this fell short of market expectations, it was still perceived as a negative development, sparking widespread concern among traders.
According to the analysts, options flow reflected this pessimism, with heavy put buying dominating trades.
“Trump’s tariffs are viewed as severe trade disruption… The market’s initial positive reaction with a price spike to $88 was seen as gambling/short covering, followed by a sharp reversal as reality set in about economic impacts. Options flow remains heavily bearish, with traders noting significant put buying, including “700 79k puts for end of April,” wrote Greeks.live analysts.
Traders snapping up 700 $79,000 puts for the end of April signals expectations of a sustained downturn. According to the analysts, the consensus among traders points to continued volatility, with a potential “bad close” below $83,000 today, Friday, April 4. Such an action would erase the earlier pump entirely.
Meanwhile, many traders are adopting bearish strategies, favoring short calls or put calendars. Shorting calls is reportedly deemed the most effective approach in the current climate.
Therefore, while the market’s initial reaction to Trump’s tariffs was a mix of hope and reality, the reversal reflects the broader economic fallout from Trump’s policies. As traders brace for choppy conditions, the bearish outlook in options trading paints a cautious picture for the days ahead.
Global supply chain disruptions and economic uncertainty remain at the forefront of market concerns.
Disclaimer
In adherence to the Trust Project guidelines, BeInCrypto is committed to unbiased, transparent reporting. This news article aims to provide accurate, timely information. However, readers are advised to verify facts independently and consult with a professional before making any decisions based on this content. Please note that our Terms and Conditions, Privacy Policy, and Disclaimers have been updated.

XRP Futures and Illinois Lawsuit Relief

Why Are Retail Investors Turning to XRP Over Bitcoin?

Dogecoin (DOGE) Bleeds Further—Fresh Weekly Lows Test Investor Patience
Solana Price Drops 15% Amid $46M Whale Dump, Will SOL Recover Anytime Soon?

Bitcoin & Ethereum Options Expiry: Can Prices Stay Stable?

Why Recency Bias Is Amplifying Fear Around Bitcoin’s Price

2.52 Million Altcoins Are Ruining Crypto’s Future

Animoca Brands Valuation Tanks 75% In Two Years, Here’s Why

Crypto exchange BingX hacked for $43 million

Are The Big Players Losing Interest?

Hong Kong’s Securities Association Tips Authorities On Crypto Self-Regulation

Coinbase cbBTC Set to go Live on Solana
2.52 Million Altcoins Are Ruining Crypto’s Future
Animoca Brands Valuation Tanks 75% In Two Years, Here’s Why
Crypto exchange BingX hacked for $43 million
Are The Big Players Losing Interest?
Hong Kong’s Securities Association Tips Authorities On Crypto Self-Regulation
Coinbase cbBTC Set to go Live on Solana
-

 Market22 hours ago
IP Token Price Surges, but Weak Demand Hints at Reversal
-

 Market18 hours ago
Bitcoin’s Future After Trump Tariffs
-

 Altcoin22 hours ago
Movimiento millonario de Solana, SOLX es la mejor opción
-

 Ethereum22 hours ago
Ethereum Trading In ‘No Man’s Land’, Breakout A ‘Matter Of Time’?
-

 Bitcoin22 hours ago
BlackRock Approved by FCA to Operate as UK Crypto Asset Firm
-

 Market21 hours ago
HBAR Foundation Eyes TikTok, Price Rally To $0.20 Possible
-
 Altcoin21 hours ago
John Squire Says XRP Could Spark A Wave of Early Retirements
-
 Market20 hours ago
10 Altcoins at Risk of Binance Delisting