
Market
Can SUI Price Reclaim All-Time High?

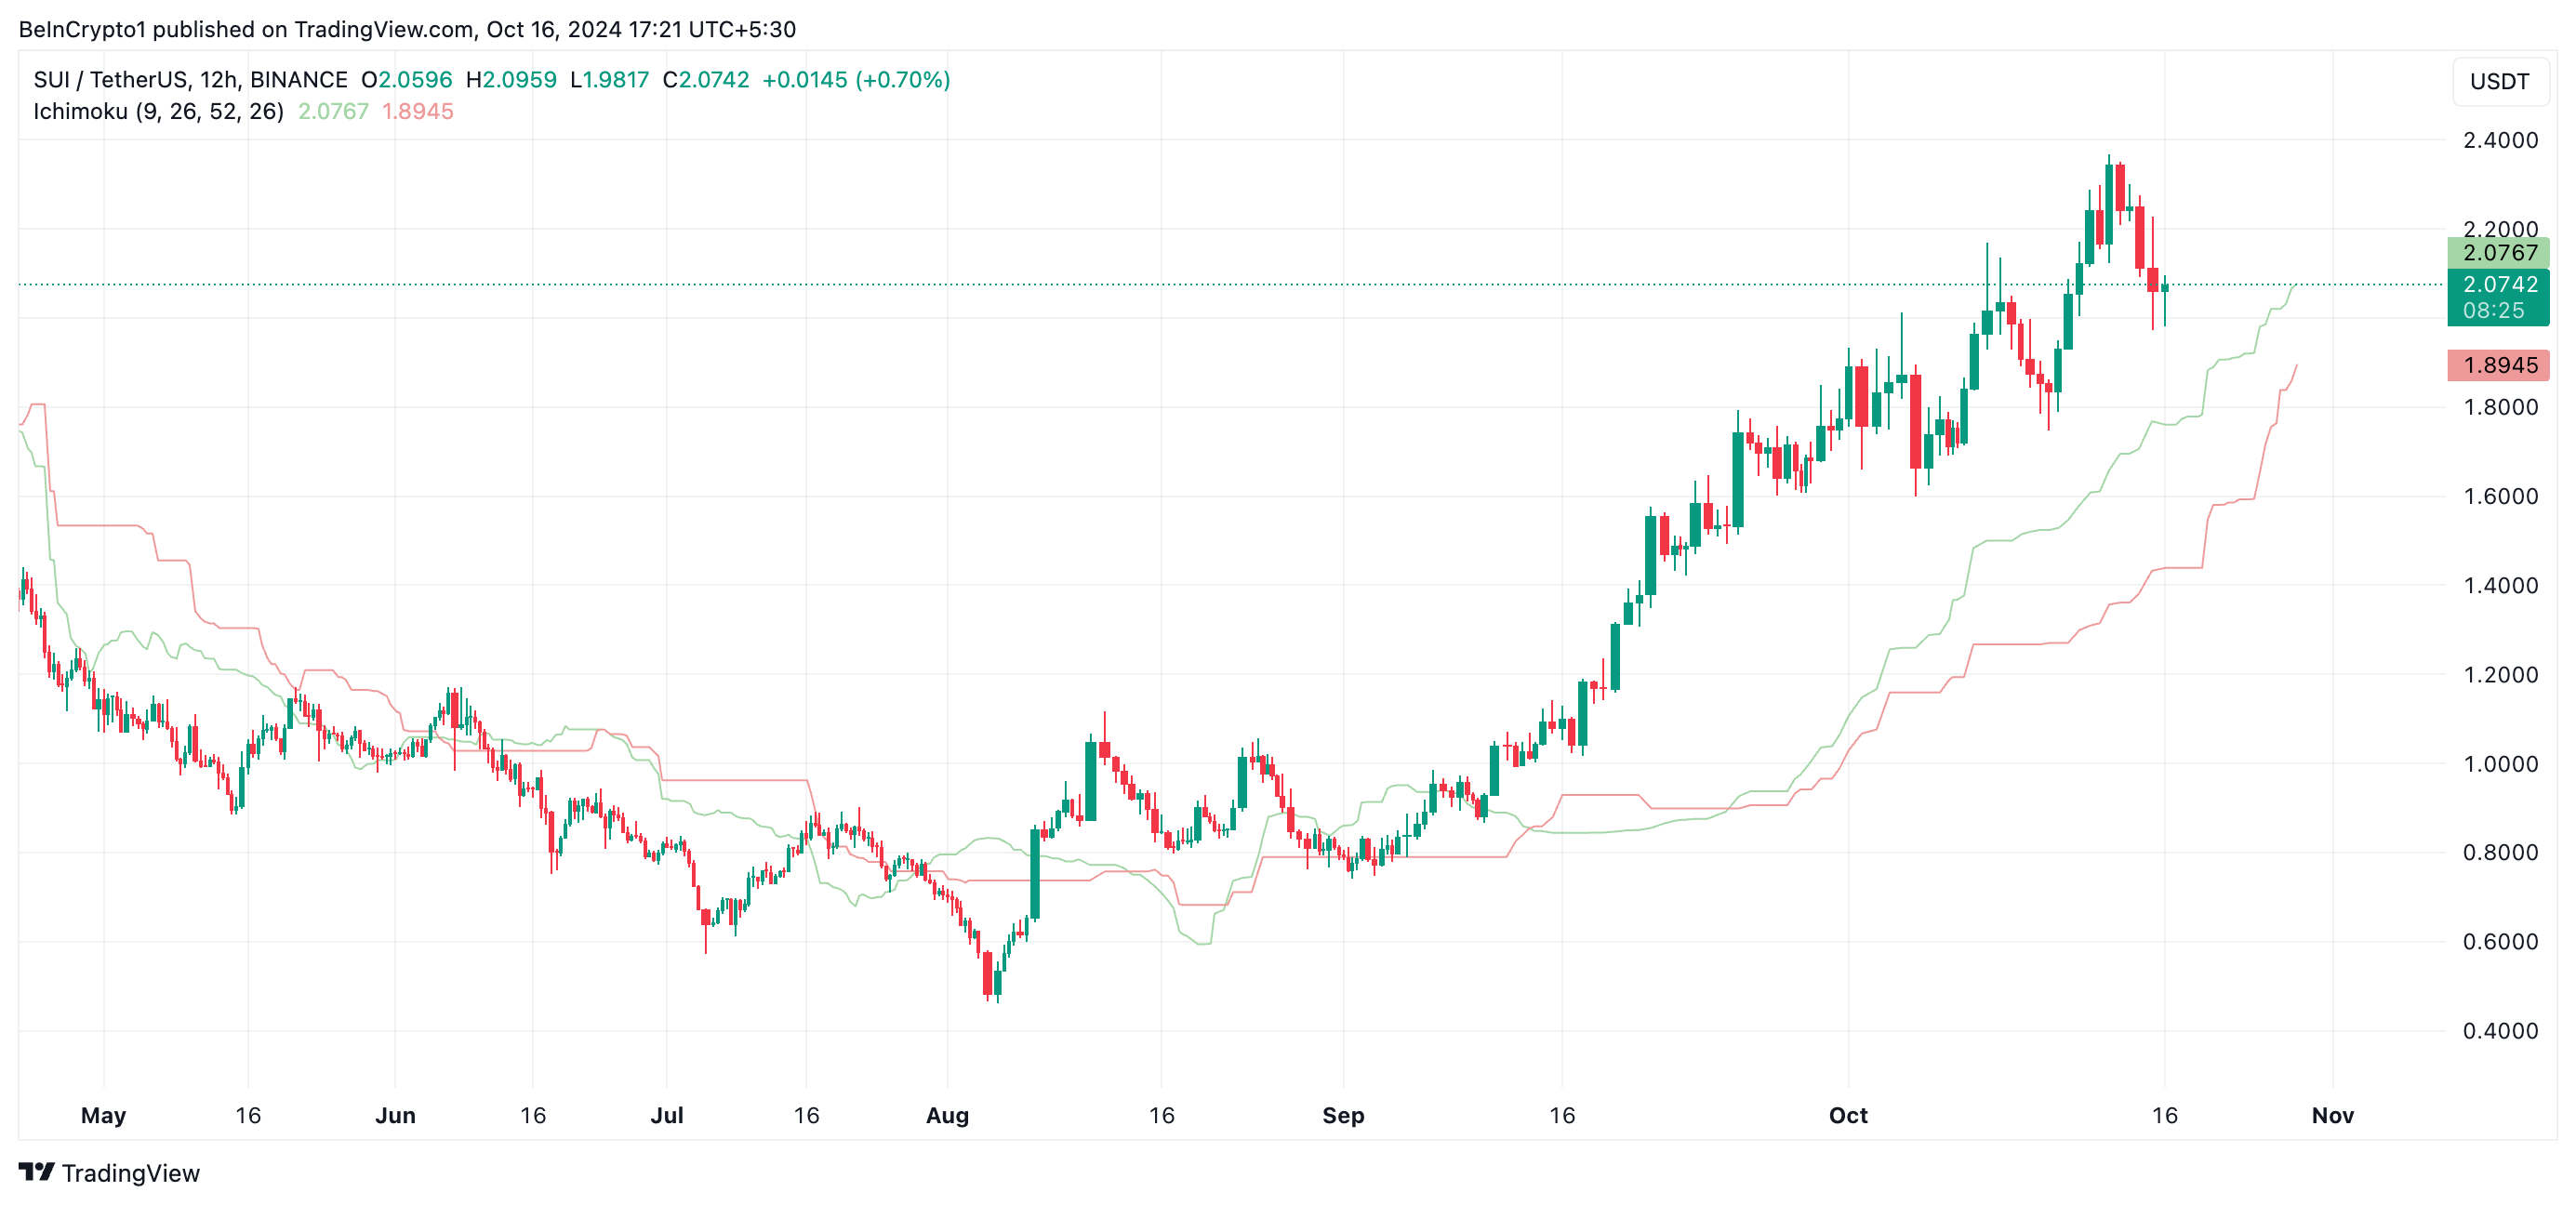
SUI, the native coin of Layer-1 (L1) blockchain Sui Network, rallied to an all-time high of $2.36 on October 14. However, as profit-taking activity gains momentum, SUI has initiated a downward trend.
The altcoin trades at $2.04 as of this writing, noting a 14% decline in the past two days. Its technical setup suggests that SUI is poised to extend this fall. The question remains: how low will SUI go?
Sui Traders Sell For Profits
At its current price, SUI trades just above the resistance formed at $1.97. If rising selling pressure causes this level to fail to hold, SUI’s price will seek support at its Ichimoku Cloud, which tracks its market trends and momentum and acts as support/resistance levels.
As in SUI’s case, the Ichimoku Cloud can act as a support level if the price approaches from above. If its price enters or breaks below the cloud, it indicates a trend reversal from bullish to bearish. The cloud often acts as a transition zone; falling into or below it shows weakening momentum and could signal a potential bearish phase.
Read more: Everything You Need to Know About the Sui Blockchain
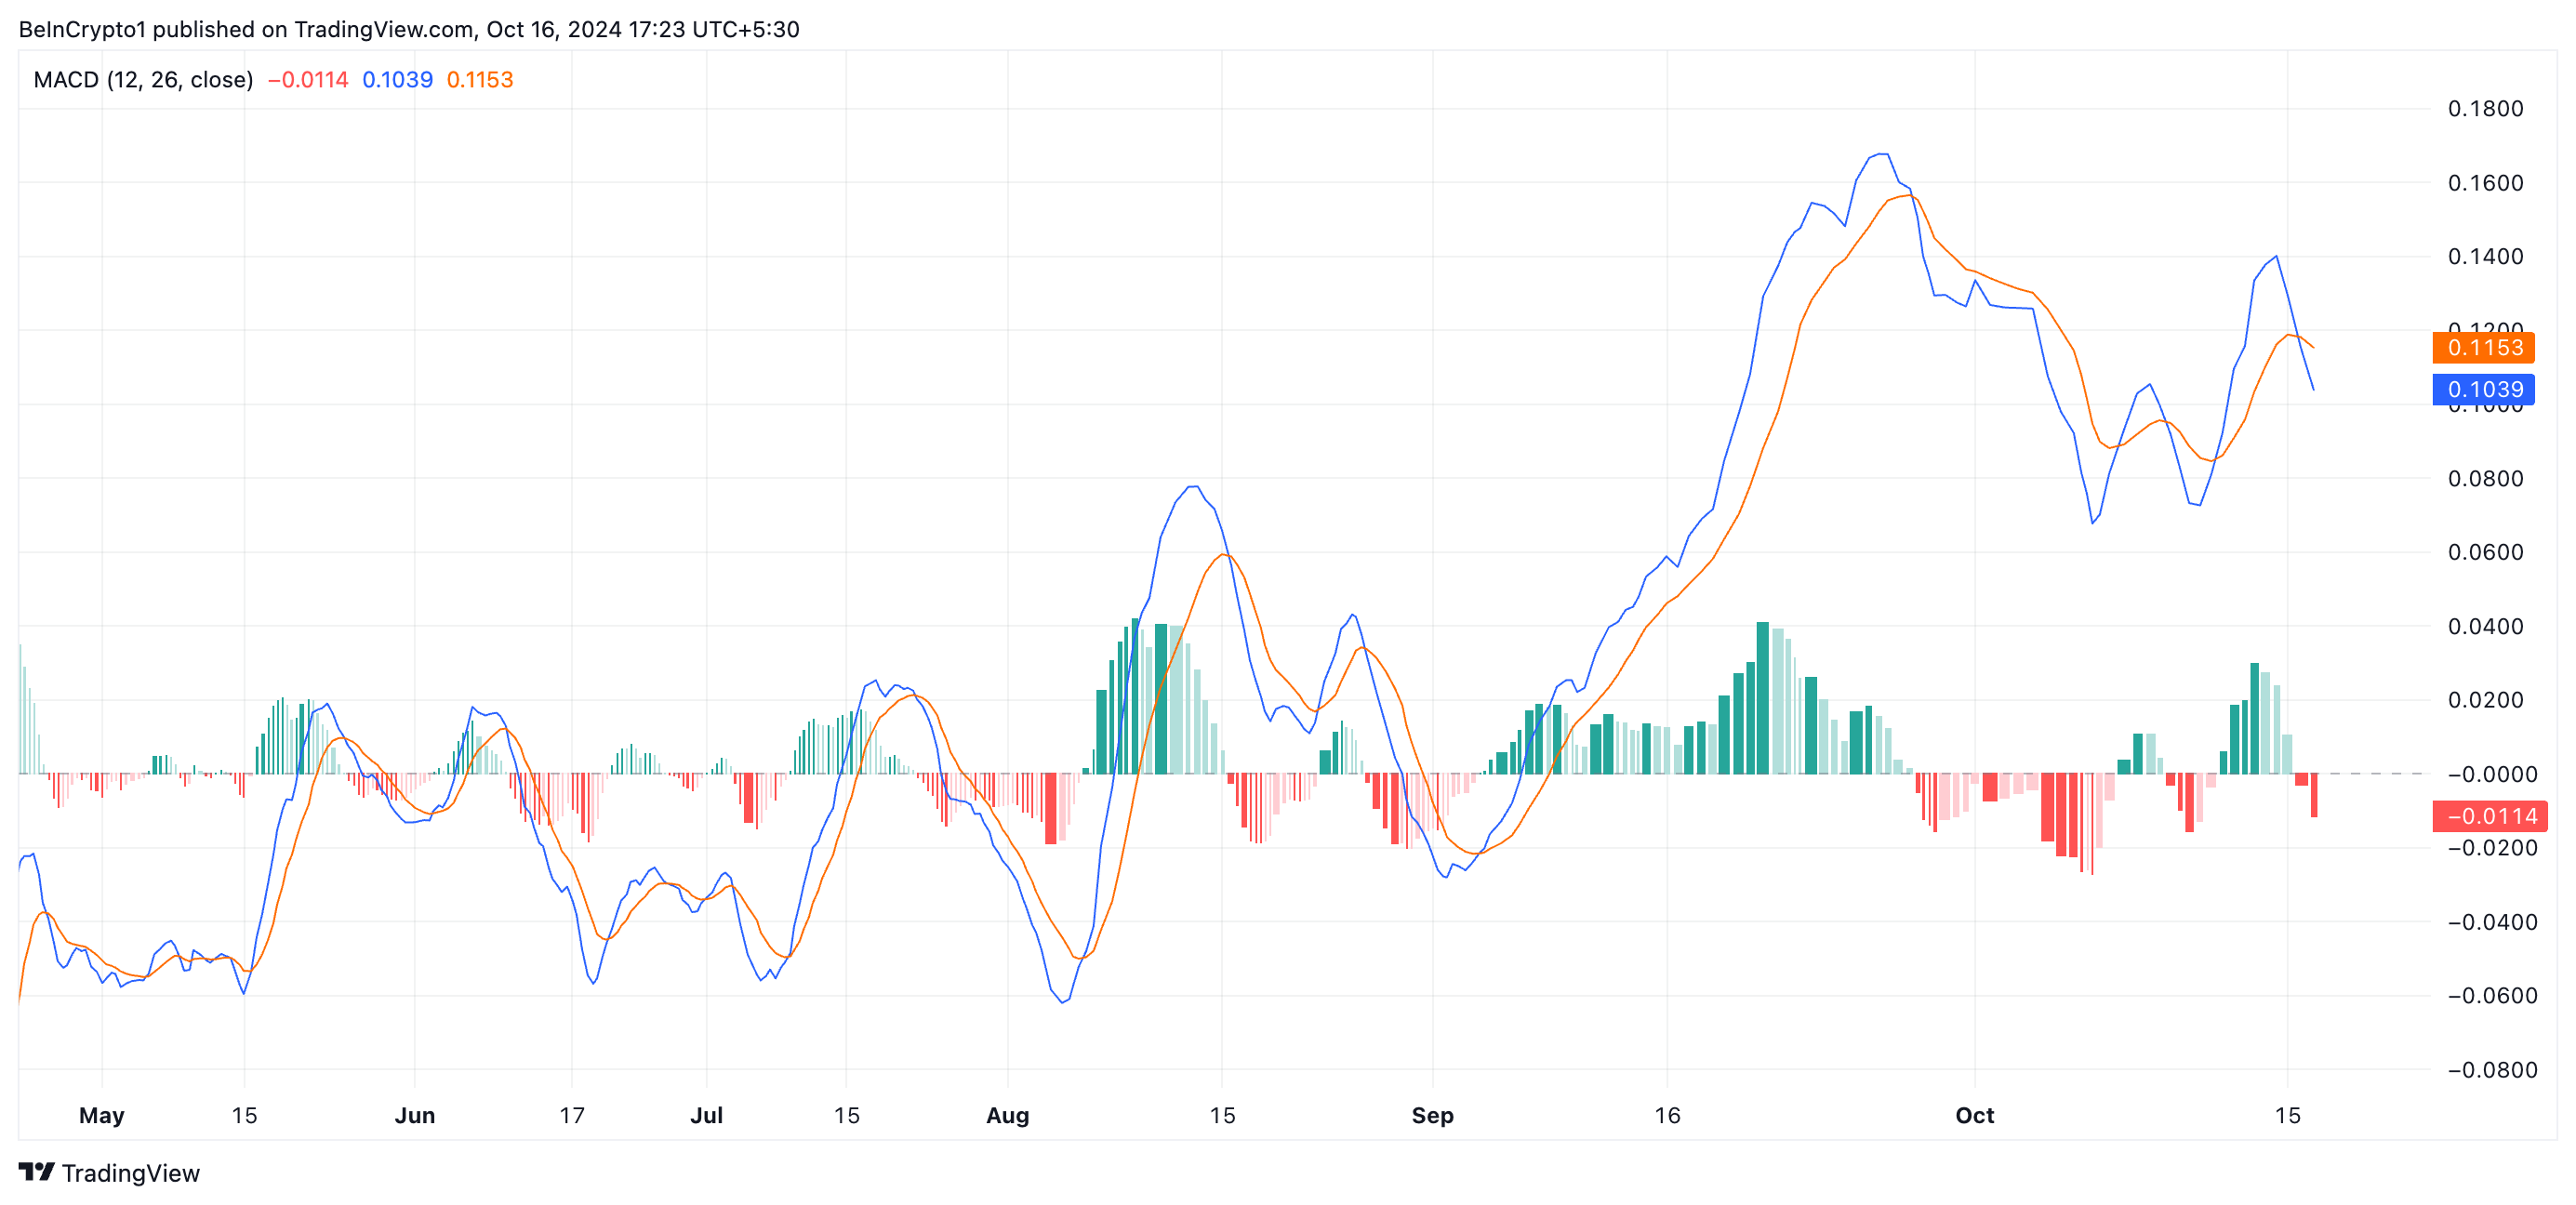
Readings from SUI’s moving average convergence/divergence (MACD) confirm this bearish outlook. Its MACD line (blue) recently crossed below its signal line (orange), signaling a shift in the market’s sentiment from bullish to bearish.
The cross below the signal line shows that an asset’s shorter-term moving average (represented by the MACD line) is falling faster than the longer-term average (signal line). This typically reflects increased selling pressure in the market, which many traders view as a sign to sell or exit long positions.
SUI Price Prediction: Interest in Coin Has Dropped
SUI’s declining open interest is another strong indicator of reduced interest in the altcoin. After reaching an all-time high of $709 million on October 14, open interest has steadily trended downward, signaling that fewer traders are maintaining active positions in SUI. It has fallen by 24% in just two days, now at $538 million.
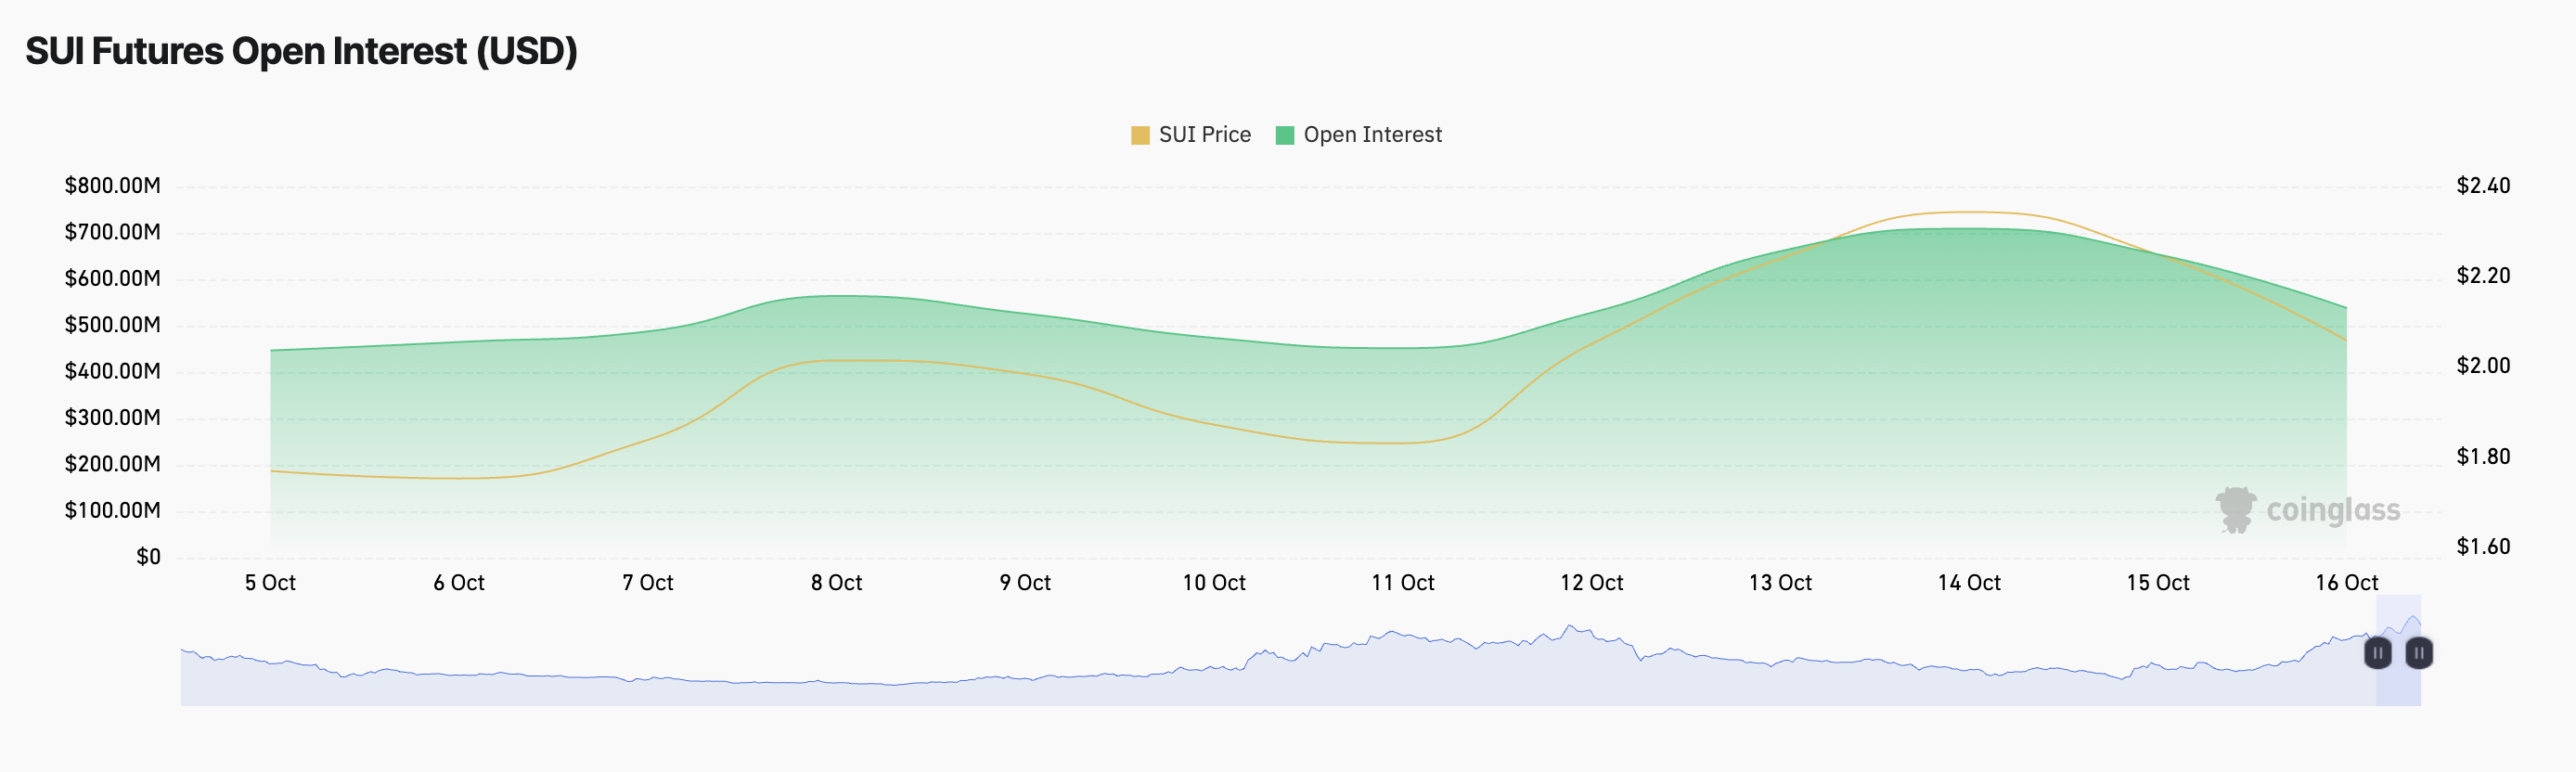
This drop suggests a reduction in market participation and could indicate that investors are closing out positions, potentially expecting further price declines. If the selling pressure increases, SUI’s price may fall by 55% to trade at $0.91.
Read more: A Guide to the 10 Best Sui (SUI) Wallets in 2024
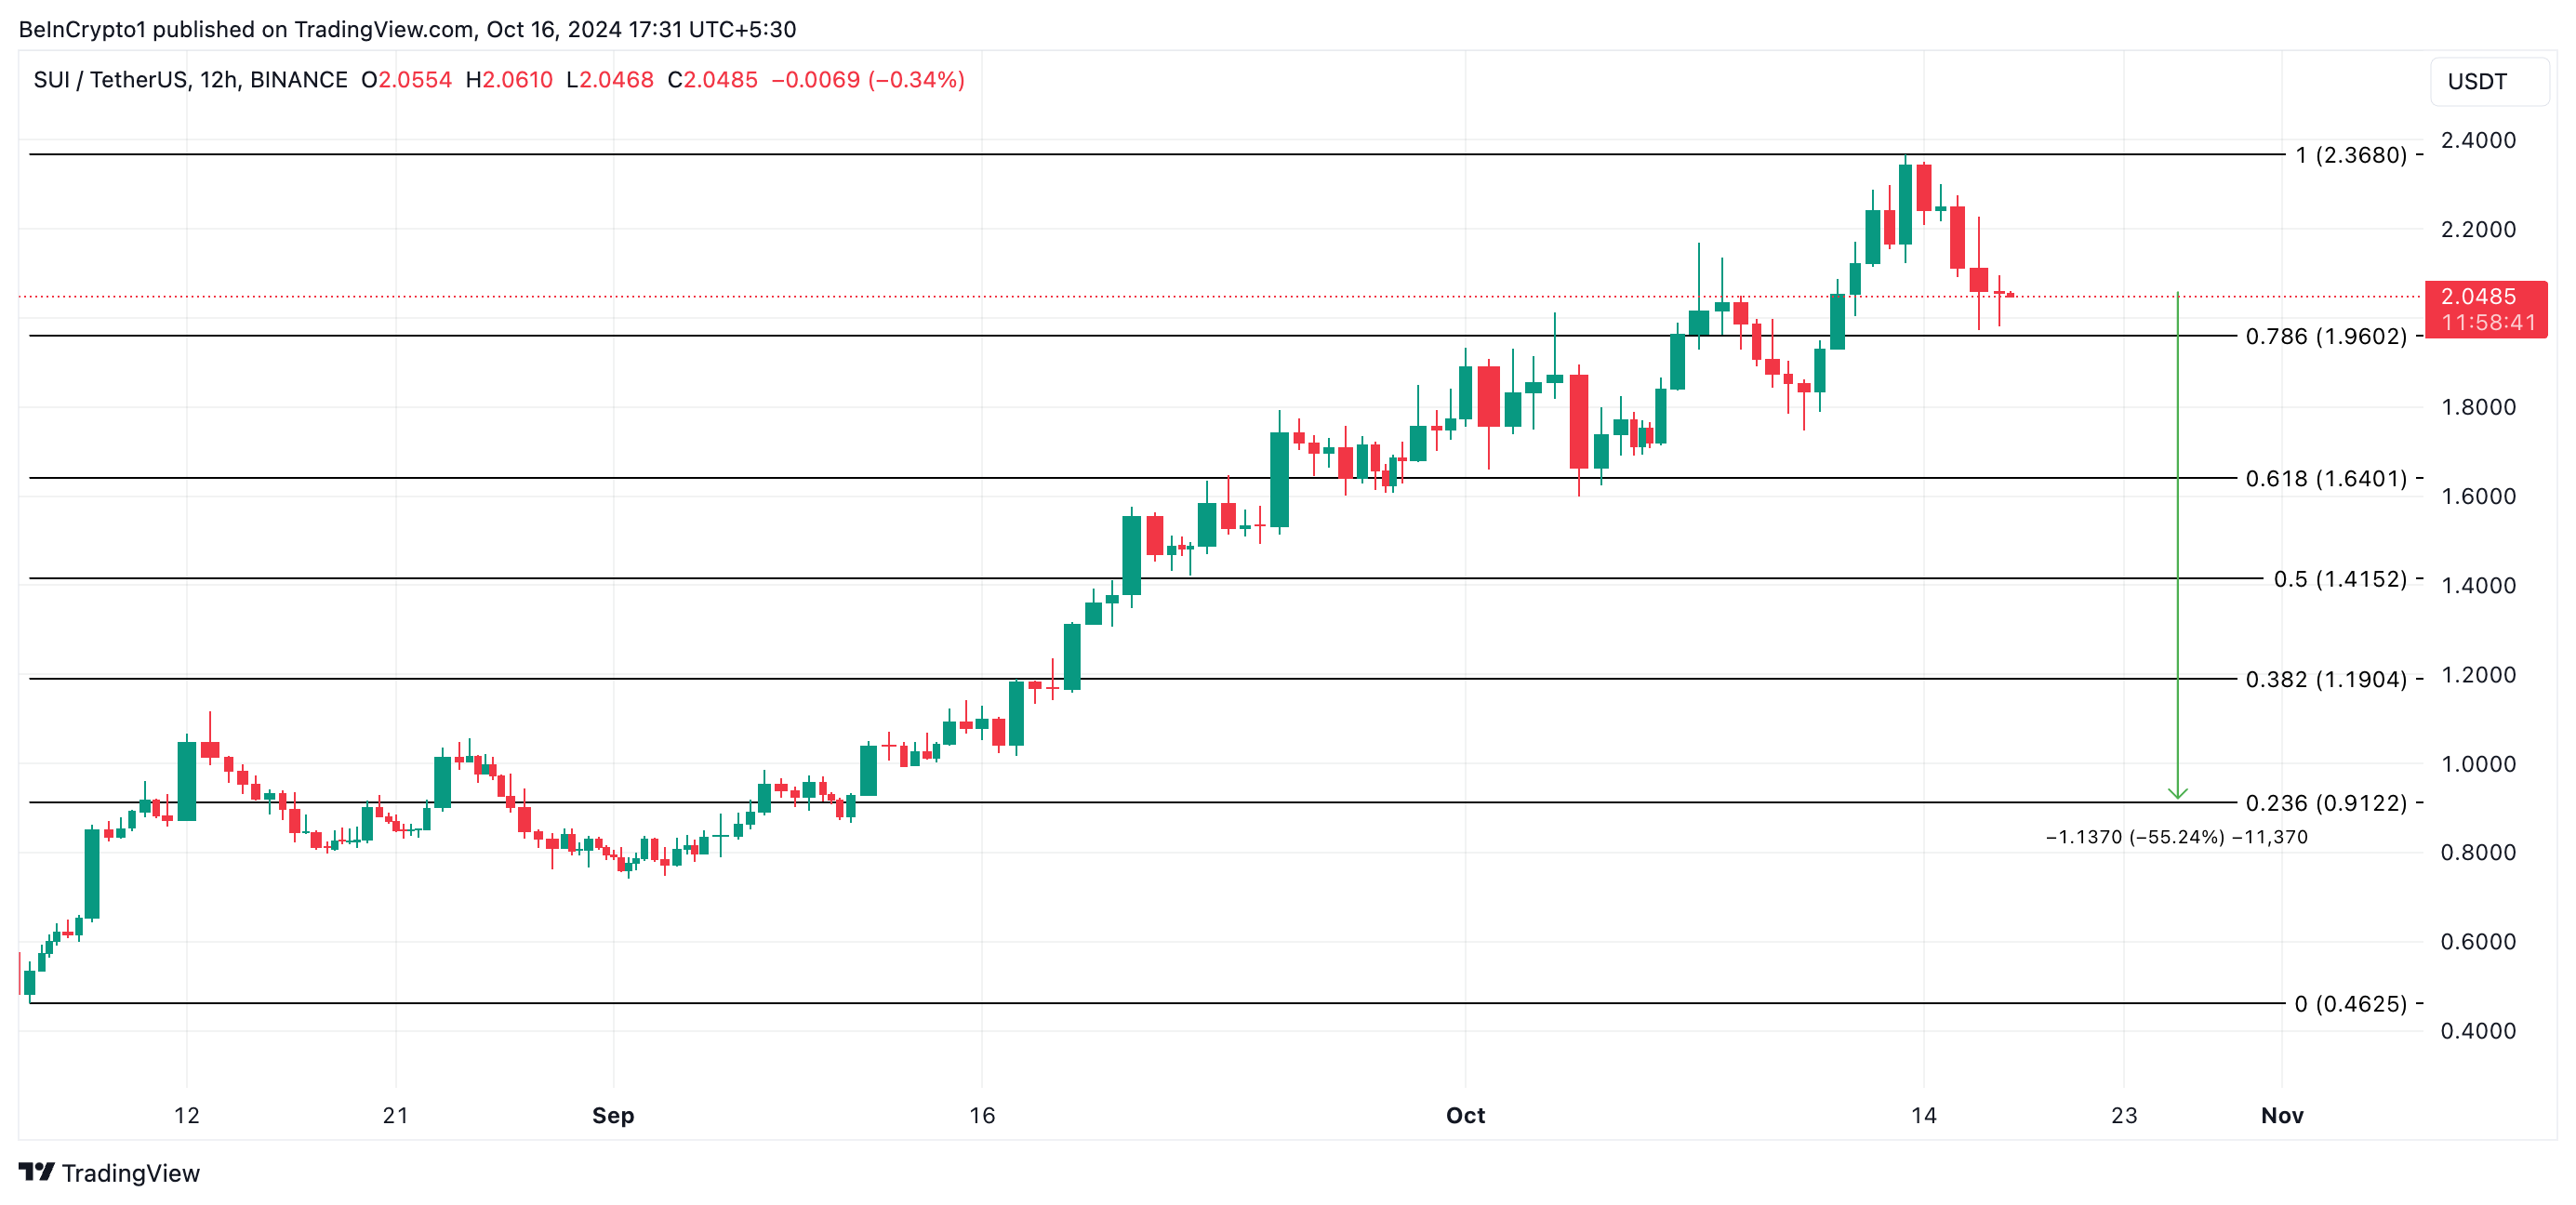
However, this bearish outlook could be invalidated if new demand enters the market. SUI may reclaim its all-time high of $2.36 and potentially surge beyond it.
Disclaimer
In line with the Trust Project guidelines, this price analysis article is for informational purposes only and should not be considered financial or investment advice. BeInCrypto is committed to accurate, unbiased reporting, but market conditions are subject to change without notice. Always conduct your own research and consult with a professional before making any financial decisions. Please note that our Terms and Conditions, Privacy Policy, and Disclaimers have been updated.


Several major developments across various ecosystems are expected this week, suggesting imminent volatility for tokens within the respective niches. From Aave buybacks to Trump’s reciprocal tariffs, some very interesting updates are in the pipeline.
Traders and investors can front-run the following developments and position their portfolios strategically ahead of the following events.
AAVE Buybacks
AAVE, the native token of the Aave lending protocol, will see buybacks commence on Wednesday, April 9. This follows approval from the Aave DAO.
This move involves allocating $4 million in aEthUSDT to repurchase AAVE tokens from the open market. The goal is to reduce circulating supply and potentially boost token value.
“Buybacks will reduce AAVE’s circulating supply, making tokens scarcer and more valuable. Activating fee mechanism will create a new revenue stream for protocol; increasing demand,” noted Langerius, founder of Hunters of Web3.
The repurchased tokens will be moved to the Ecosystem Reserve, signaling a long-term strategy to enhance scarcity and reward holders. This could see the AAVE token price surge, especially if demand remains steady or increases.
The buybacks follow a tokenomics update that activates a fee switch, introducing a new revenue stream for the protocol.
“New Aavenomics update. This is Fee Switch on steroids,” wrote Stani Kulechov, CEO and founder of Aave.
This dual approach, which reduces supply and generates revenue, could make AAVE a more attractive investment.
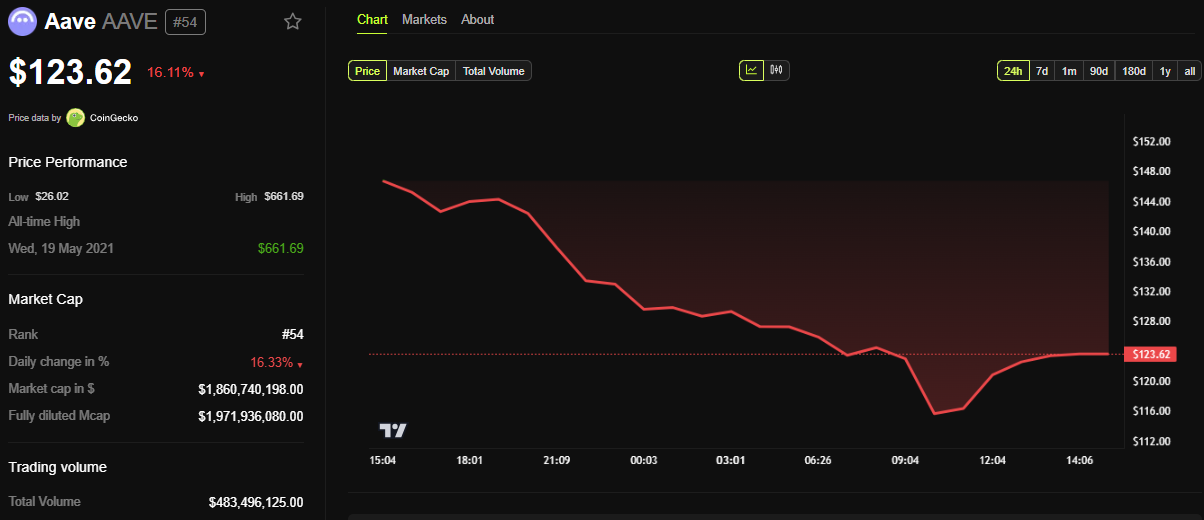
BeInCrypto data shows the AAVE token was trading for $123.62 as of this writing, down by over 16% in the last 24 hours.
Trump’s Reciprocal Tariffs
Another crypto headline to watch this week concerns President Trump’s reciprocal tariffs, which are expected to take effect on April 9. The president will introduce a tiered levy system (10%, 15%, 20%) targeting countries like China, Vietnam, and the EU. The UK faces the lowest band.
While these tariffs bolster US economic independence, they could ripple through crypto markets. In the recent past, tariffs spooked investors, driving sell-offs in risk assets, evidenced by Bitcoin’s volatility after past tariff announcements.
Traders should brace for short-term dips, particularly in Bitcoin and altcoins tied to global trade dynamics. However, Trump’s pro-crypto stance, including his strategic Bitcoin reserve, might mitigate some losses, as could a decision to delay the tariffs.
“As soon as he delays or cancels the “reciprocal” tariffs the market will bounce 10%+ immediately. That is want everyone is waiting and hoping for,” one user highlighted.
Such an outcome, however, is contingent on investors viewing digital assets as a hedge against tariff-induced inflation or currency devaluation.
$47 Million Aptos Unlocks
On April 12, the Aptos network will unlock 11.31 million APT tokens worth approximately $47.73 million and comprising 1.87% of the circulating supply. The tokens will be allocated to the community, core contributors, the foundation, and investors.
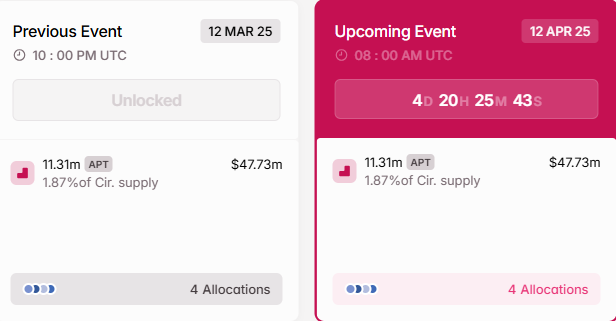
Token unlocks often lead to selling pressure as early investors or team members liquidate holdings. As such, the Saturday event could drive APT’s price down.
“Aptos is struggling with a strong downtrend and upcoming token unlocks, which could further dilute its value,” one user noted.
Neutron’s Mercury Upgrade
Neutron’s Mercury upgrade, its most significant to date, launches on April 9. The event promises enhanced functionality for this Cosmos-based blockchain. Such upgrades improve scalability, security, or interoperability—key for Neutron’s DeFi and cross-chain ambitions.
“Neutron’s upcoming Mercury upgrade will 11x network throughput,” the network shared.
It follows proposal #993, supported by Stakecito, and aims to transition Neutron from Cosmos Hub’s Interchain Security to full sovereignty via the Mercury upgrade. The move would enhance Neutron’s role as a smart contract platform while maintaining ties with Cosmos Hub.
A successful rollout could bolster Neutron’s position in the Cosmos ecosystem, attracting more projects and capital.
Disclaimer
In adherence to the Trust Project guidelines, BeInCrypto is committed to unbiased, transparent reporting. This news article aims to provide accurate, timely information. However, readers are advised to verify facts independently and consult with a professional before making any decisions based on this content. Please note that our Terms and Conditions, Privacy Policy, and Disclaimers have been updated.

Layer-1 (L1) coin KAVA has emerged as the day’s top performer with a modest 0.10% gain over the past 24 hours. The coin remains range-bound despite this lead, signaling a relative balance between buying and selling pressure.
Still, the sentiment around KAVA is quietly bullish. With technical and on-chain indicators pointing to a surging positive bias, the altcoin might be poised for a breakout above its narrow range.
Buyers Dominate as KAVA Teases Break Above Resistance
Since the beginning of April, KAVA’s price has oscillated within a range. The 98th largest crypto by market capitalization has faced resistance at $0.415 and has found support at $0.392.
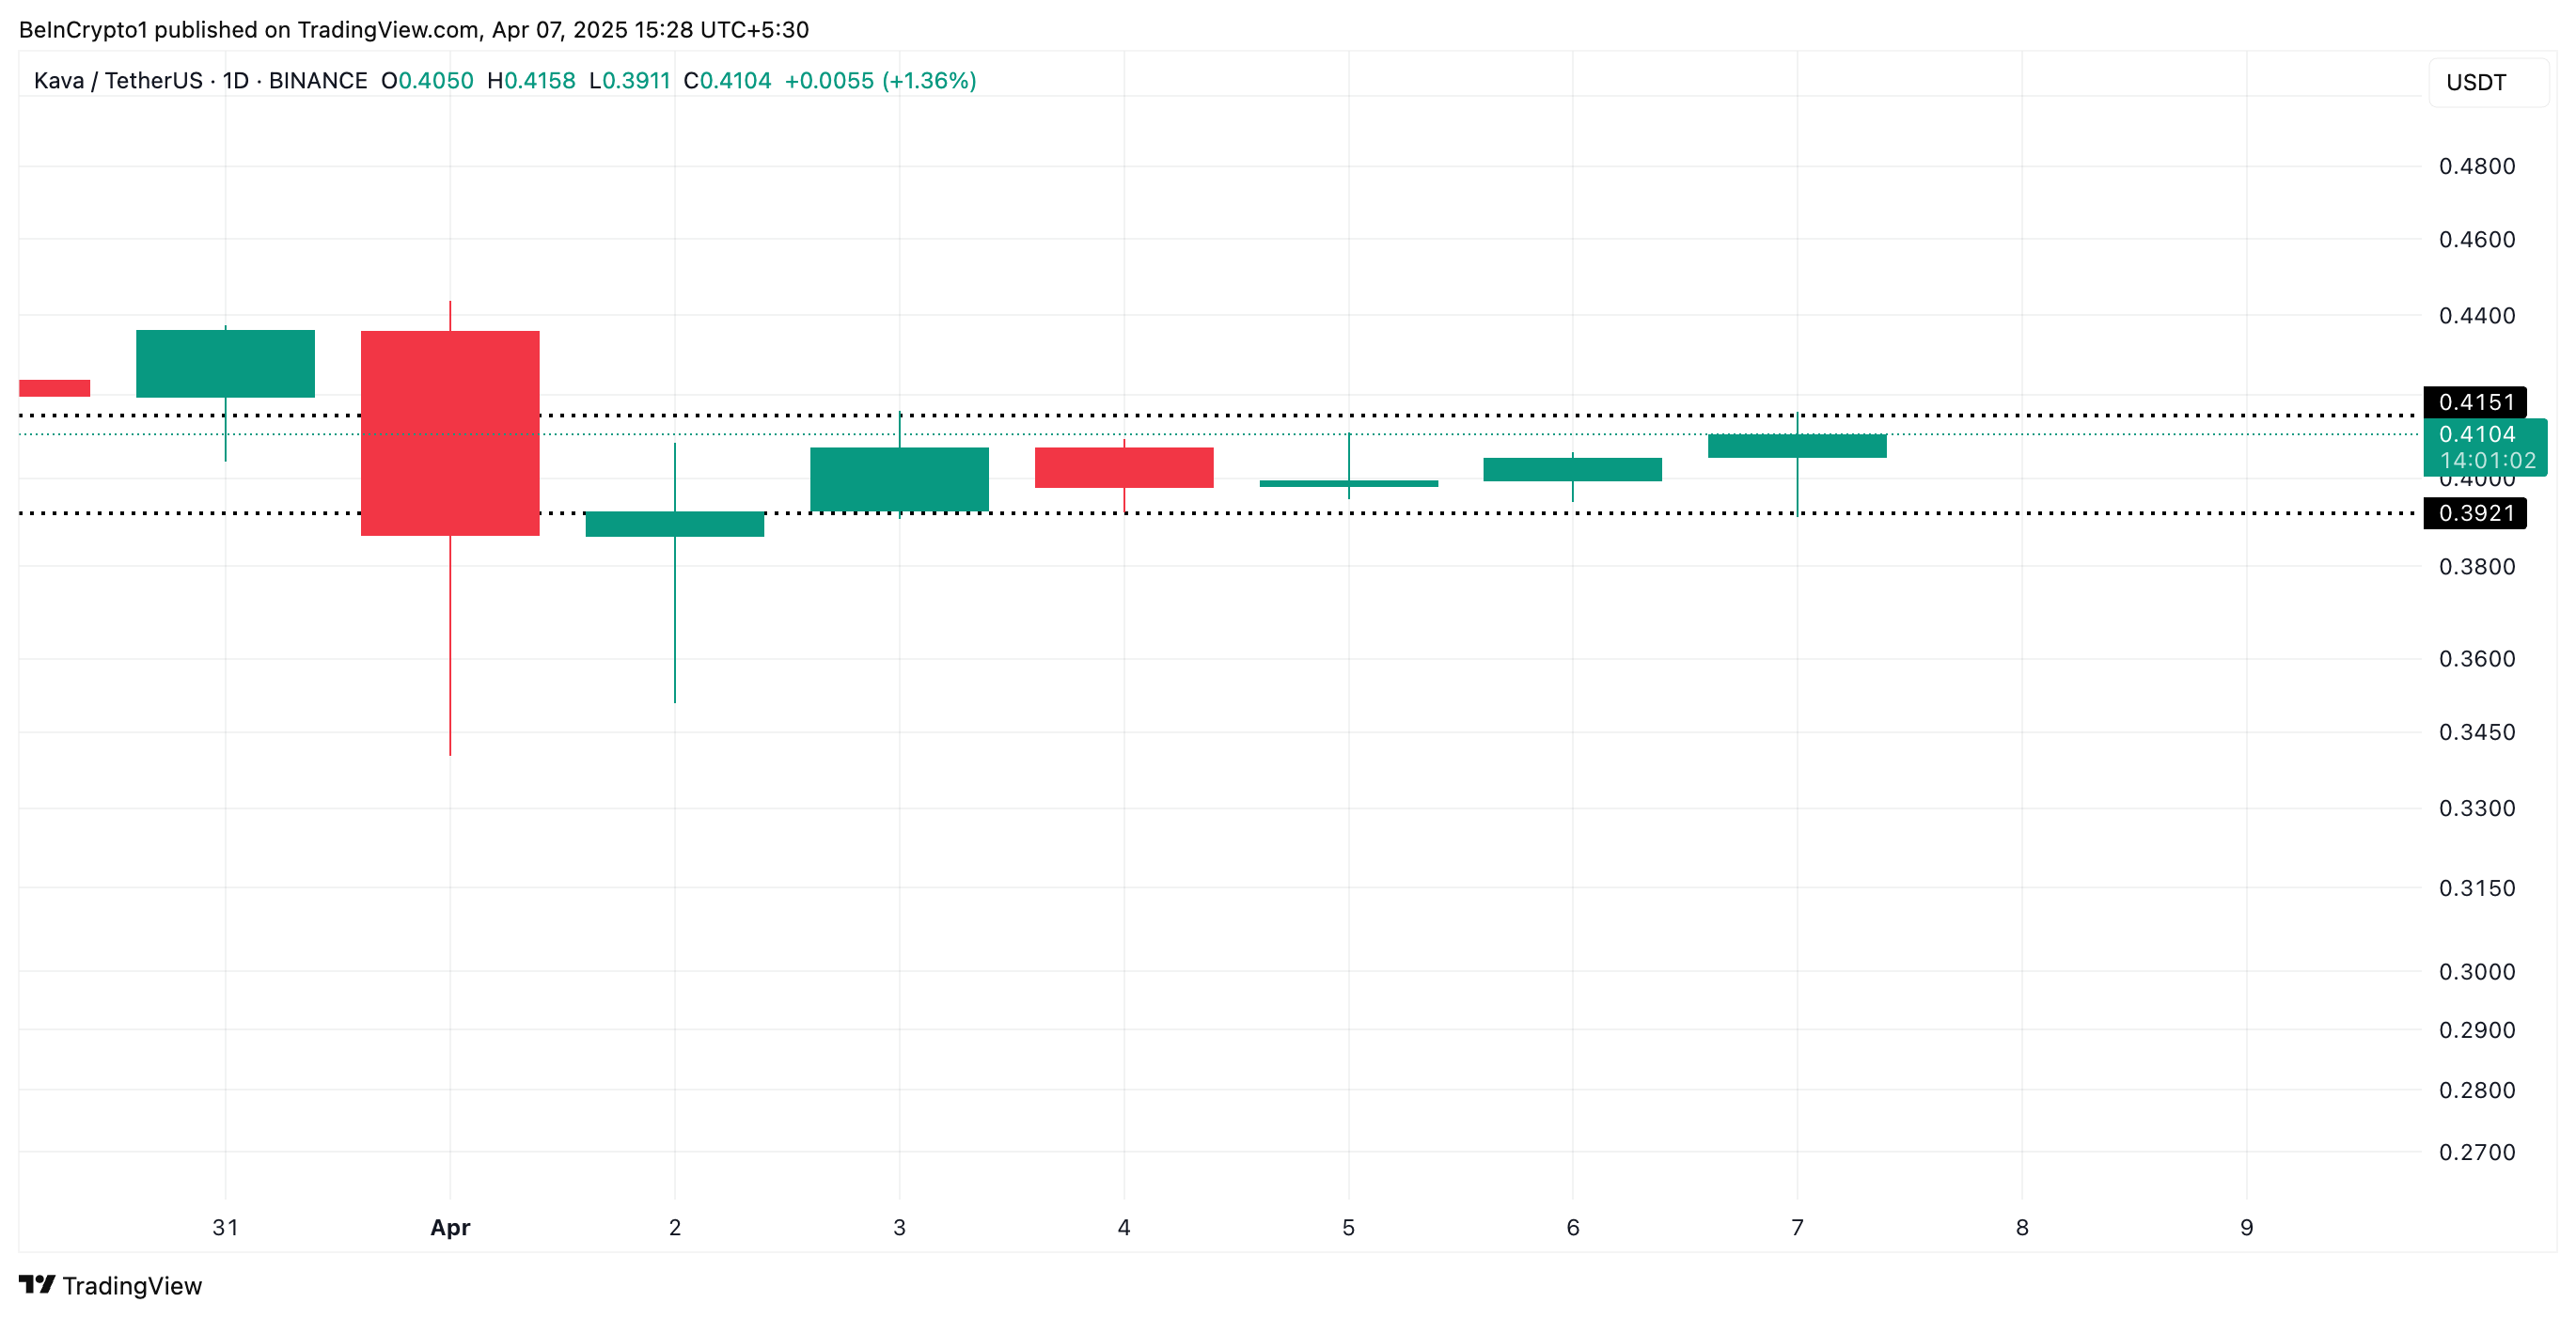
With the gradual resurgence in bullish bias toward the altcoin, KAVA could see a break above the $0.415 resistance level in the near term.
Its positive Balance of Power (BoP) on the daily chart confirms this outlook. At press time, this momentum indicator is at 0.20.
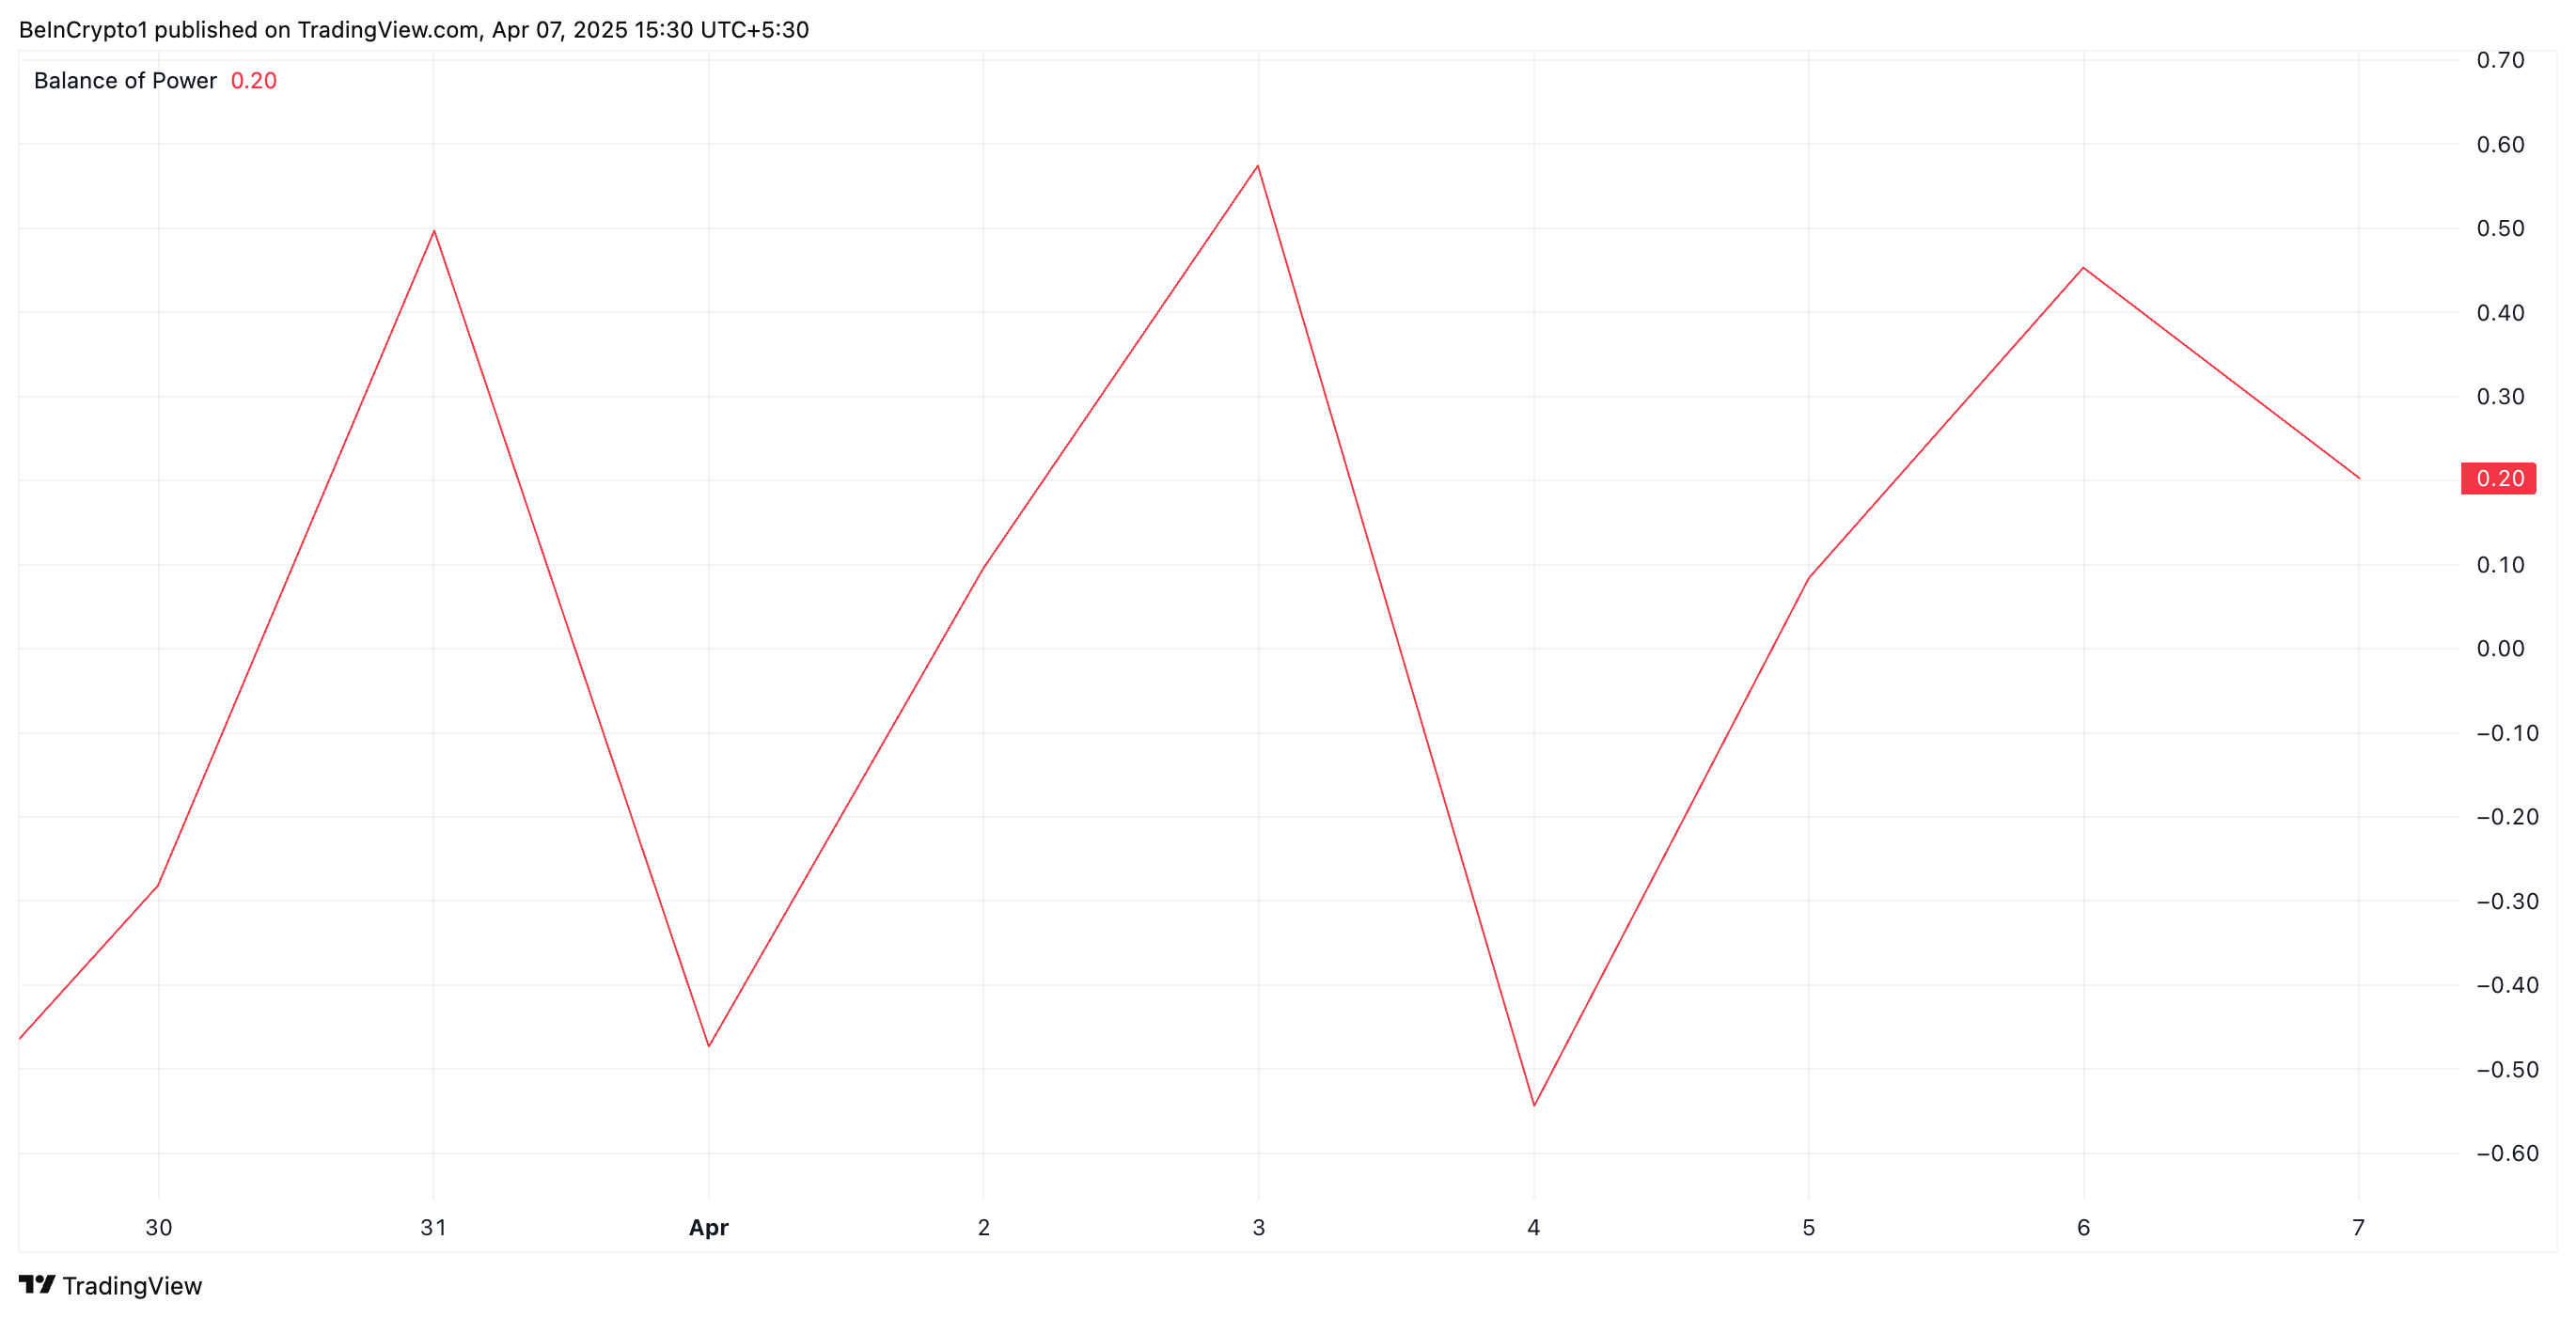
The BoP indicator measures the strength of buyers versus sellers in the market, helping to identify momentum shifts. When its value is negative, sellers are dominating the market over buyers.
Converesly, a positive BoP like this suggests that buying activity outweighs selling pressure. This reflects KAVA’s growing demand and potential for its price to appreciate further.
Moreover, the coin’s positive funding rate highlights the bullish sentiment among KAVA’s futures traders. As of this writing, the metric stands at 0.0097%.
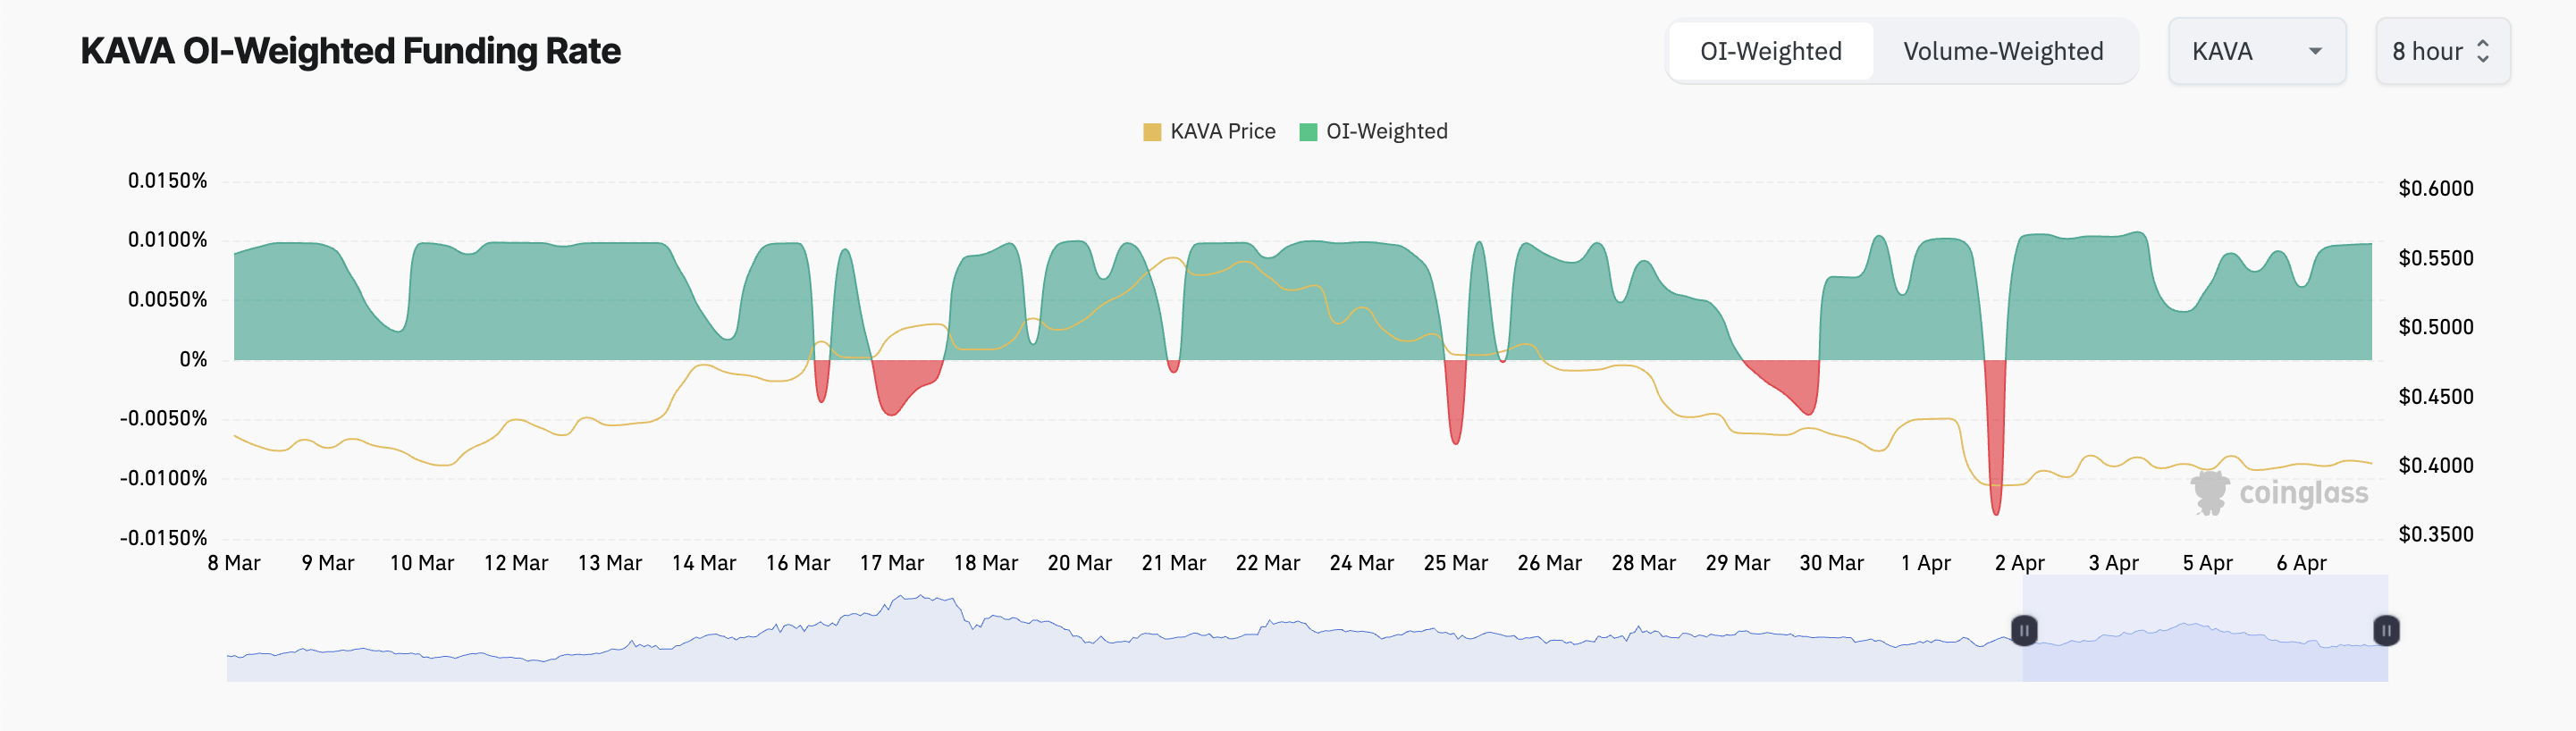
The funding rate is a periodic payment between traders in perpetual futures contracts to keep prices aligned with the spot market. KAVA’s positive funding rate means long positions are paying short. This trend indicates that more KAVA traders are betting on its price to increase.
KAVA Approaches Breakout—Can It Flip $0.41 Into Support?
KAVA’s strengthening buying pressure could trigger a break above the resistance at $0.415. If this price level is successfully flipped into a support floor, KAVA’s uptrend will gain momentum and could reach $0.44.
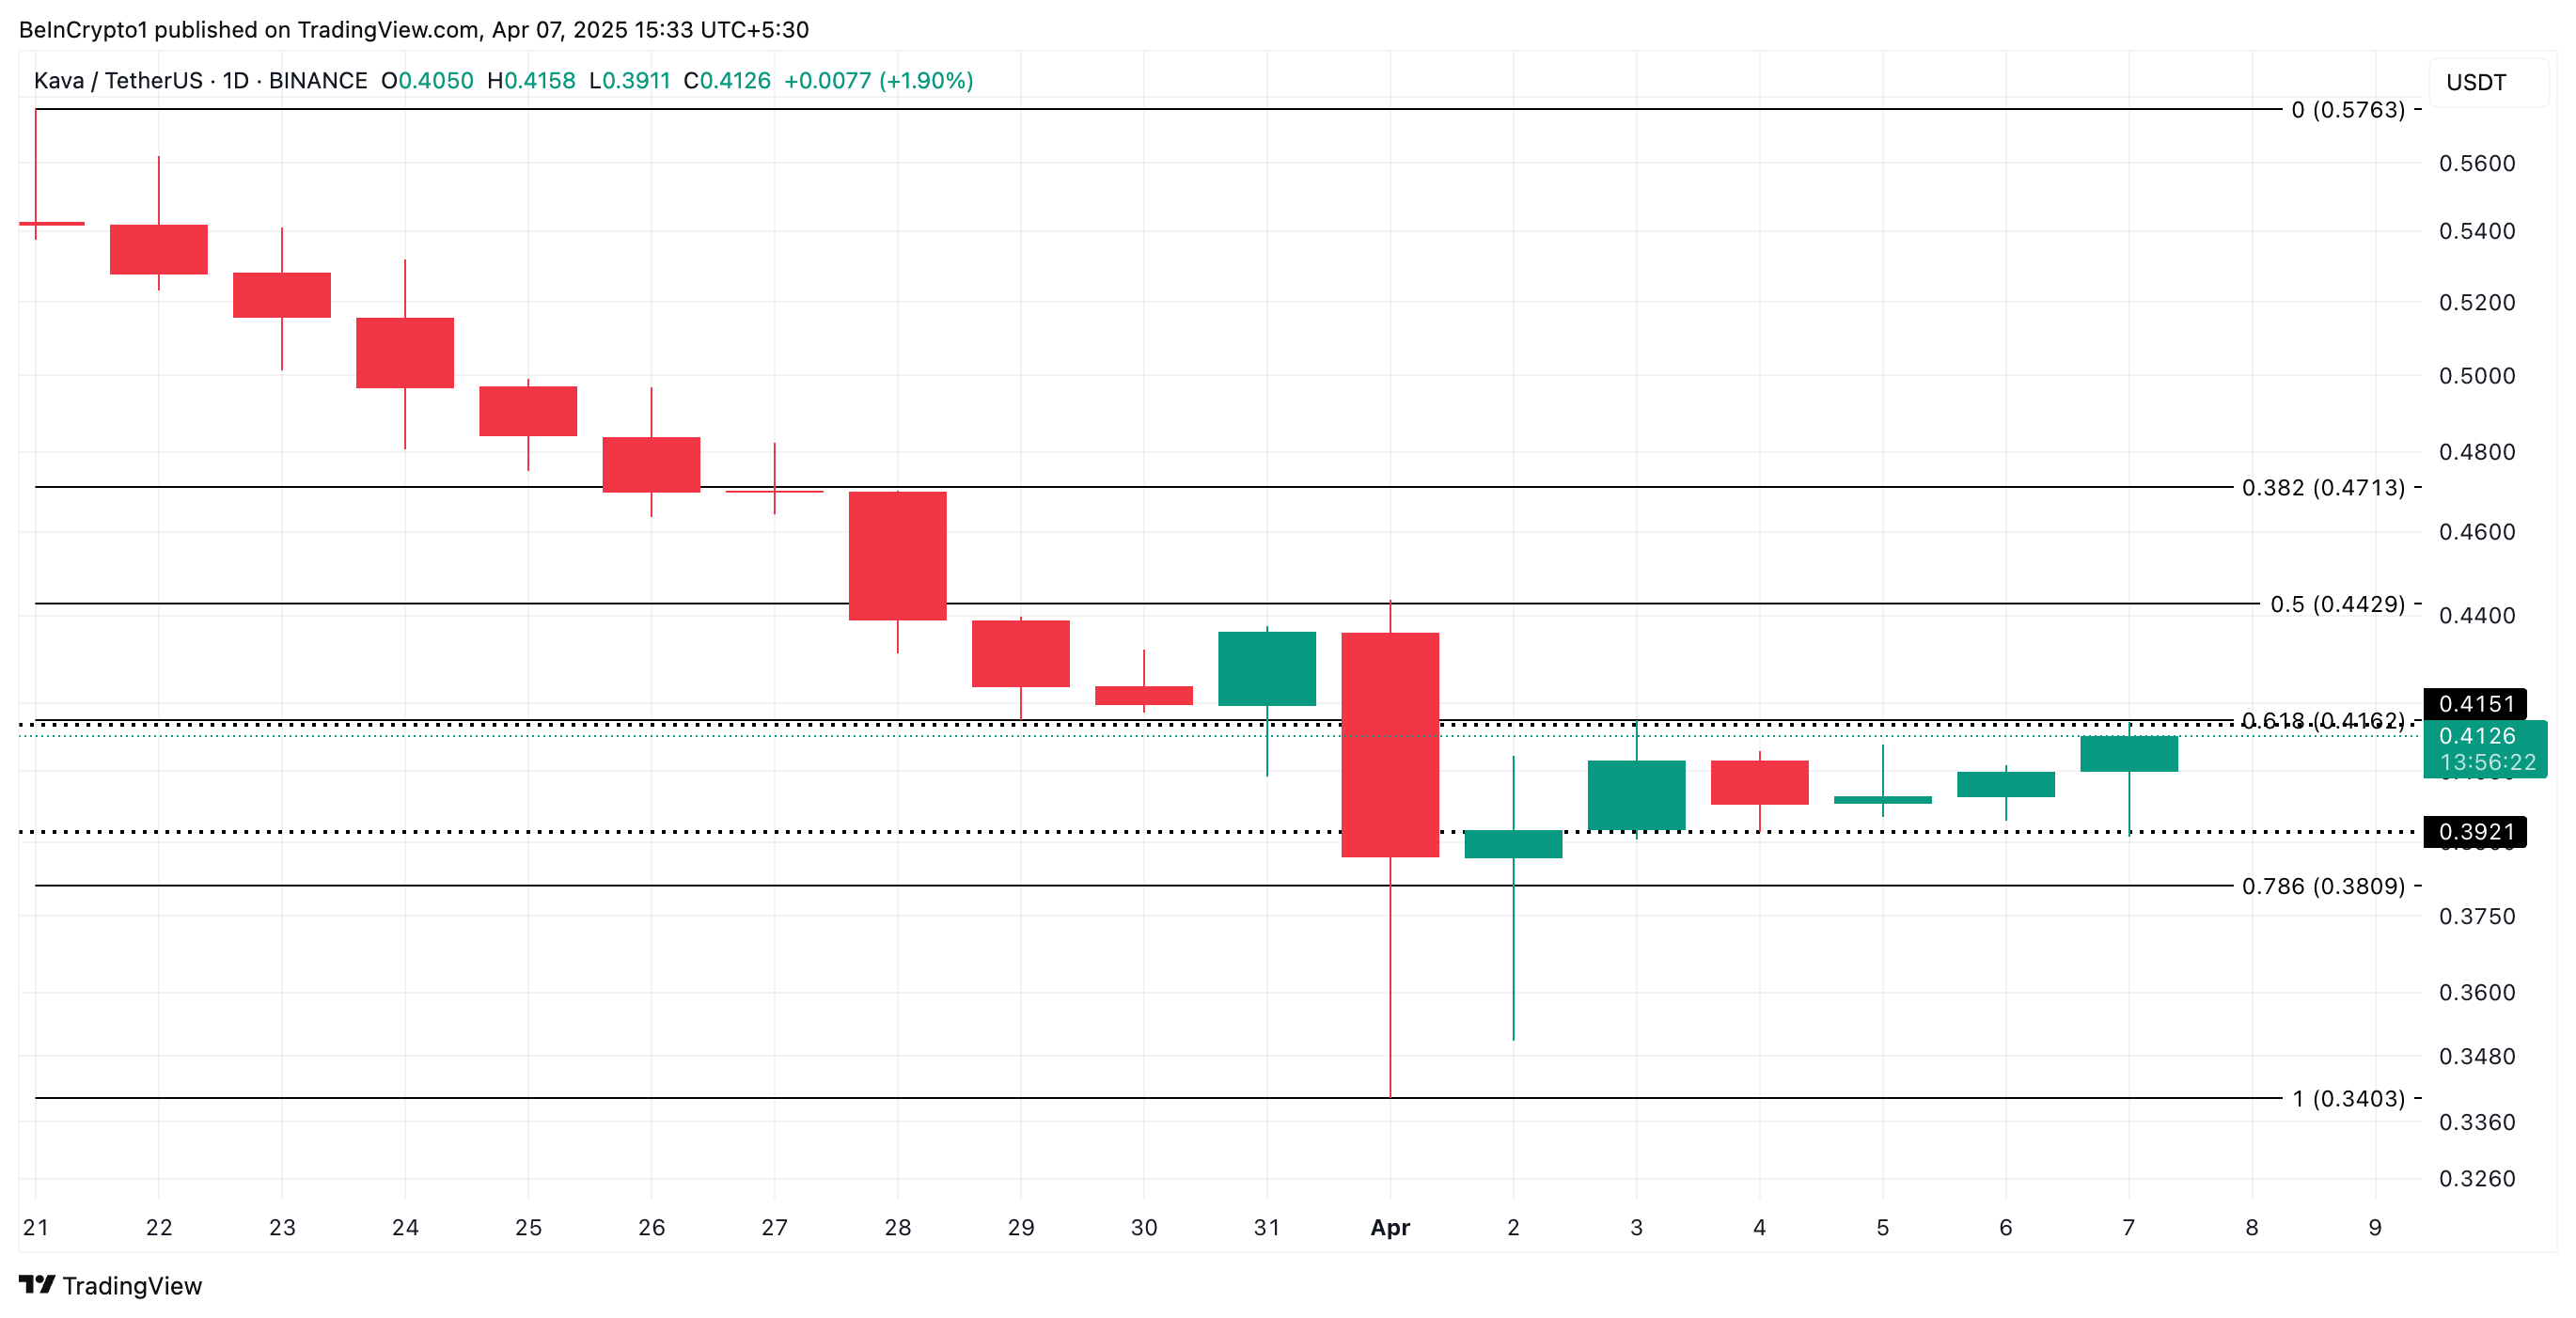
Conversely, if profit-taking spikes, the coin could slip below support at $0.392. In this scenario, KAVA’s price could fall further to $0.38.
Disclaimer
In line with the Trust Project guidelines, this price analysis article is for informational purposes only and should not be considered financial or investment advice. BeInCrypto is committed to accurate, unbiased reporting, but market conditions are subject to change without notice. Always conduct your own research and consult with a professional before making any financial decisions. Please note that our Terms and Conditions, Privacy Policy, and Disclaimers have been updated.

The brief rumor of a 90-day pause from Trump’s tariffs caused the markets to rally significantly. However, the White House squashed these rumors, fueling further crashes.
This highlights a genuine desperation in the markets as traders try to regain some bullish momentum and prevent a recession.
Trump Tariff Fakeout
The threat of Trump’s tariffs is closer than ever, and it’s causing a “Black Monday” event in the crypto markets. Bitcoin dipped below $80,000, and over $1 billion was liquidated from crypto.
However, one of the President’s advisors, Kevin Hassett, suggested this morning that he might be having second thoughts:
“Would Trump consider a 90-day pause in tariffs?’ ‘I think the president is gonna decide what the president is gonna decide … even if you think there will be some negative effect from the trade side, that’s still a small share of GDP,’” Hassett said in an interview.
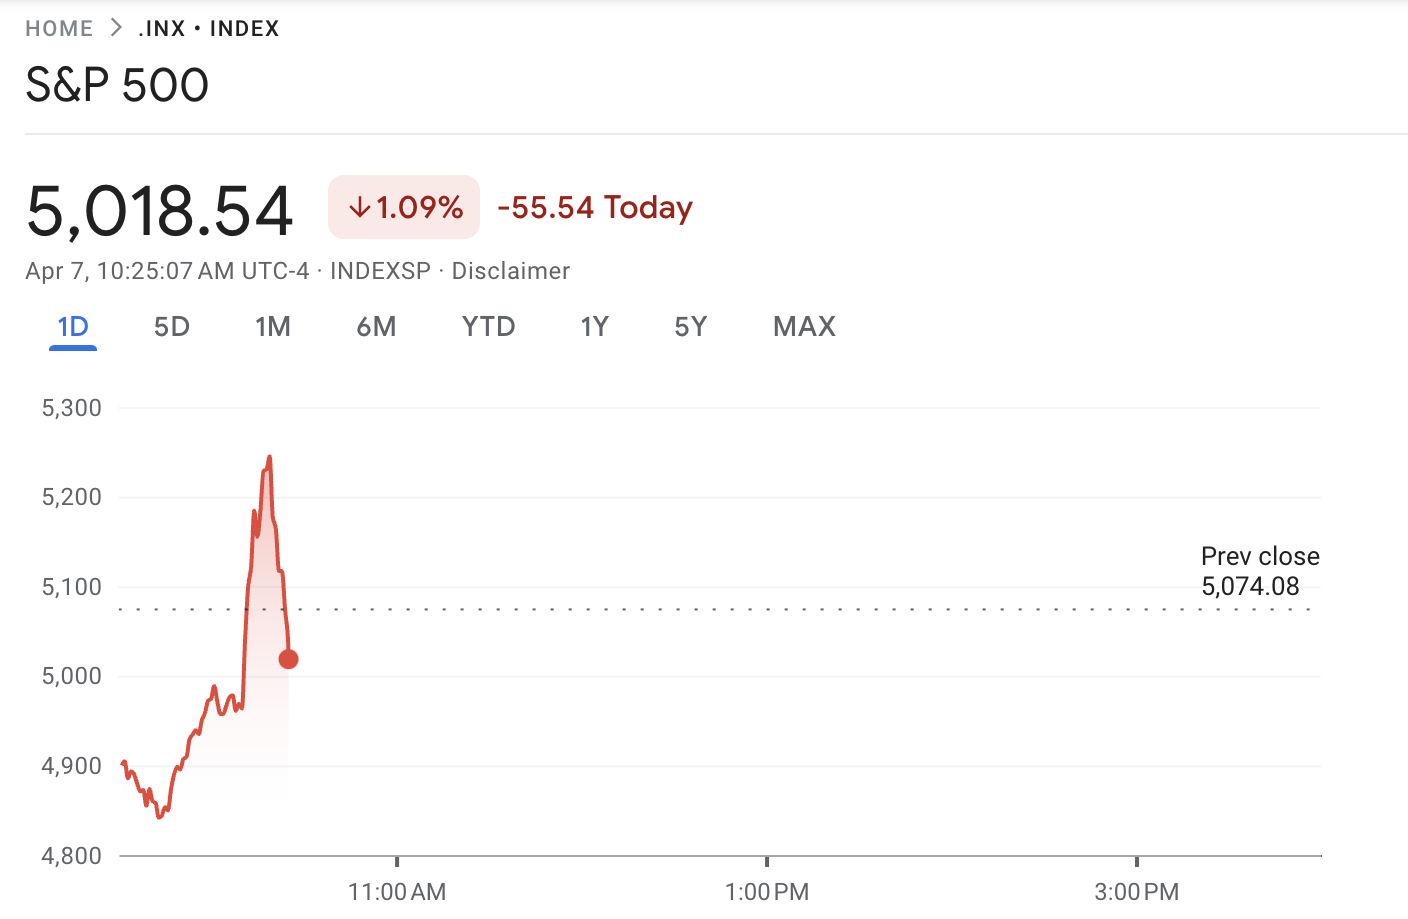
This news quickly began recirculating, claiming that Trump was seriously considering a 90-day pause in tariffs. This created a huge rally in traditional markets, with the S&P 500 shooting up 6% in seconds. This rally turned on a dime to a certain extent, falling again quickly.
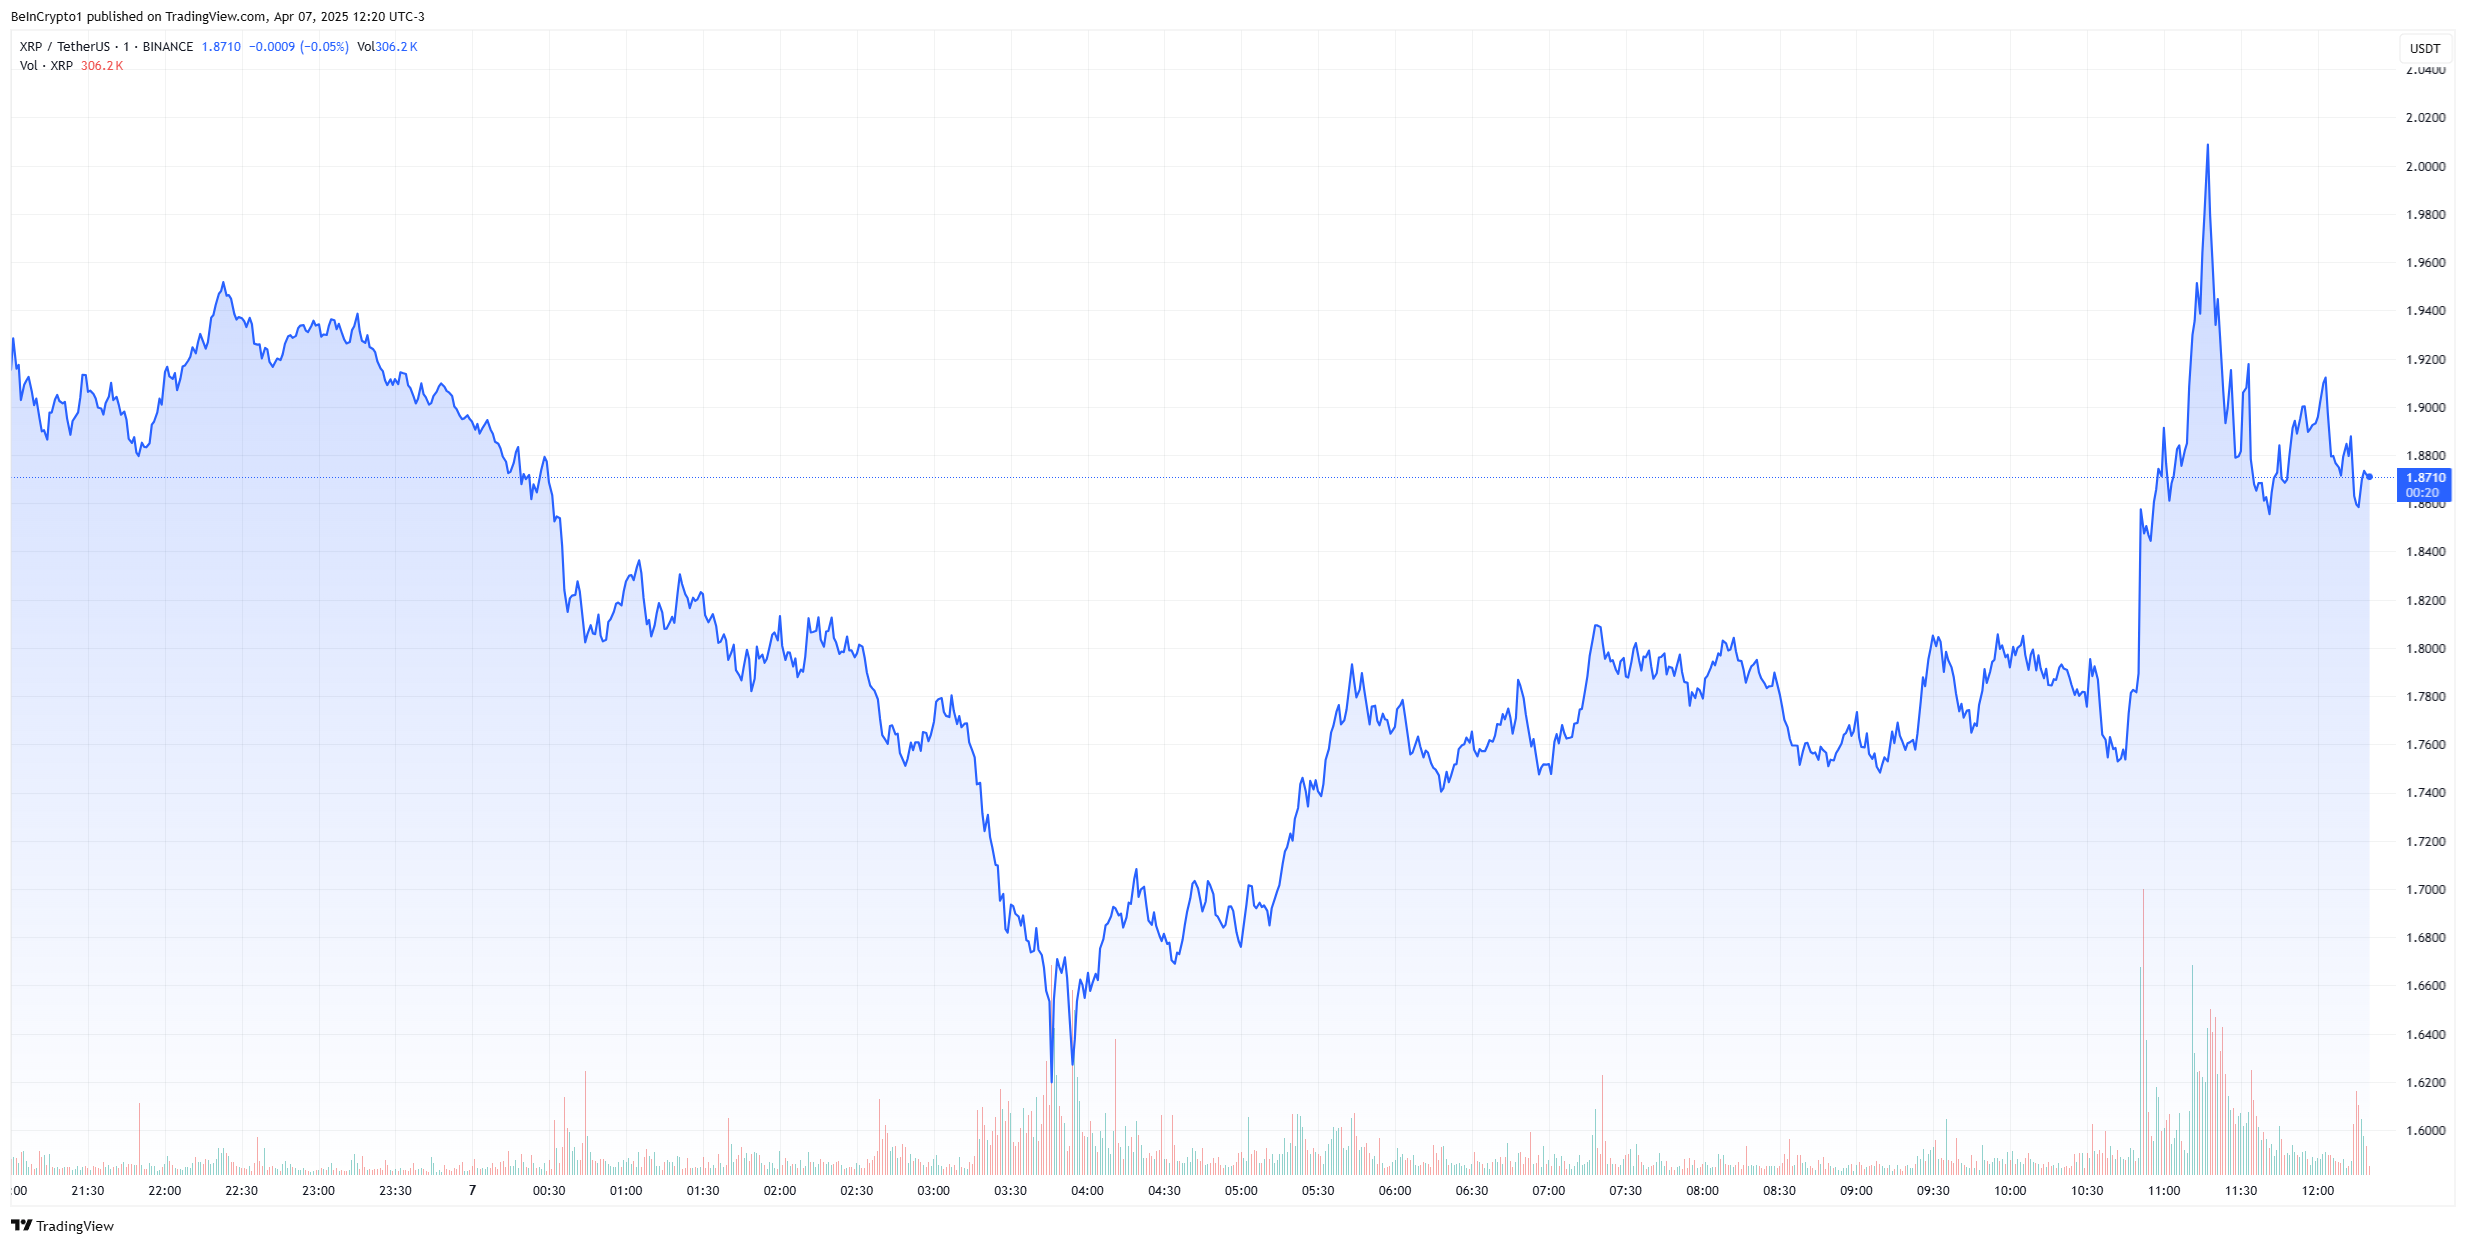
Following the rumor, XRP rallied nearly 10% to hit $2, while Bitcoin rebounded back to $80,000. Both assets have declined again due to the lack of credibility of the news. Overall, the volatility has been extremely chaotic in the crypto market today.
In his interview, Hassett did not make any firm commitments that Trump is considering pausing tariffs. His response focused mostly on ongoing negotiations and assertions that the tariffs would have a limited impact.
Shortly afterward, the White House officially denied any knowledge of a 90-day pause. They are still set to begin in two days.
Disclaimer
In adherence to the Trust Project guidelines, BeInCrypto is committed to unbiased, transparent reporting. This news article aims to provide accurate, timely information. However, readers are advised to verify facts independently and consult with a professional before making any decisions based on this content. Please note that our Terms and Conditions, Privacy Policy, and Disclaimers have been updated.

Ethereum Bears Loses Steam On Binance As Selling Pressure Weakens, Bulls Eyeing A Recovery?

AAVE Buybacks & Key Events This Week

Ethereum Capitulation May Be Nearing End – Will A Fed Pivot Spark A Recovery?
Peter Schiff Predicts Ethereum Price To Drop Below $1,000, Compares It To Bitcoin And Gold

Is $0.415 the Key to Further Gains?

XRP and Bitcoin Briefly Rallies After Rumors of 90-Day Tariff Pause


-
 Altcoin23 hours ago
Expert Reveals Decentralized Strategy To Stabilize Pi Network Price
-

 Market9 hours ago
Ethereum Price Tanks Hard—Can It Survive the $1,500 Test?
-

 Market23 hours ago
Avalanche Price Holds Under $20, Low Selling Can’t Lift Price
-

 Market22 hours ago
Bitcoin Price Drops Below $80,000 Amid Heavy Weekend Selloff
-
 Ethereum20 hours ago
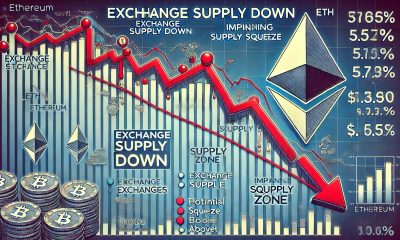
Ethereum Supply On Exchanges Plummets – Is A Supply Squeeze Coming?
-

 Market13 hours ago
Solana (SOL) Freefall—Can It Hold Above The $100 Danger Zone?
-
 Bitcoin10 hours ago
$1 Billion in Liquidations Over the Weekend
-
 Market10 hours ago
Solana (SOL) Price Falls Below $100, Crashes To 14-Month Low
 Arabic
 Chinese (Simplified)
 Dutch
Dutch English
 French
 German
 Italian
 Portuguese
 Russian
 Spanish
 Vietnamese