
Market
Can Ripple (XRP) Prevent an 18% Correction?

Ripple (XRP) is facing an important support level loss, which could result in considerable losses.
To make this worse, the altcoin is observing no support from its investors or the crypto market.
Ripple Investors Make No Effort
XRP price is facing a bearish outcome, and investors are not supporting cryptocurrency. This is because, in the last couple of days, their participation has gone down considerably, falling to a five-month low.
At the moment, the total number of addresses conducting a transaction on the network has declined to less than 18,000. Such an instance was last seen back in December 2023, right after Ripple native token hit the local bottom after correcting from its November bull run.
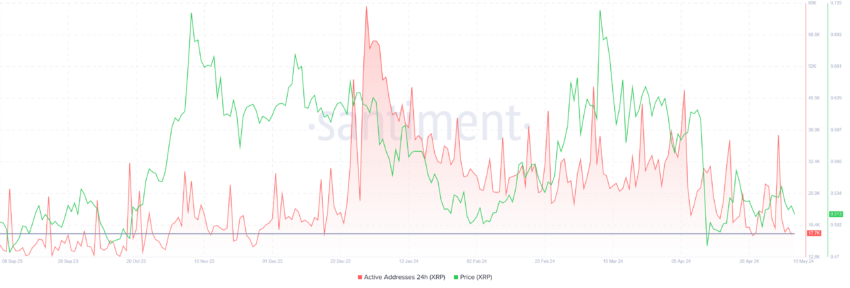
Given that the price is declining, and so are the active addresses, the market seems to be flashing a “sell” signal at the moment.
In addition to the investors, the market is not supporting a recovery either, as evident in the Relative Strength Index’s (RSI) drop. The RSI is a momentum oscillator that measures the speed and change of price movements, indicating overbought or oversold conditions in an asset’s price.
Read More: Everything You Need To Know About Ripple vs SEC
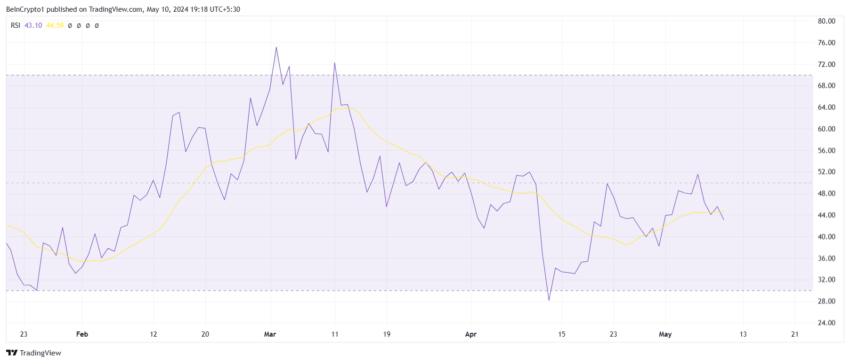
Currently, the indicator is in the bearish zone after failing to breach the neutral line of 50.0 twice in the past two weeks. This shows that the XRP price could find difficulty in noting a recovery given the lack of support from the market as well.
XRP Price Prediction: Losing a Crucial Support
XRP price, trading at $0.51 at the time of writing, can be seen falling below the 23.6 Fibonacci Retracement level. Marked at $0.51, and this technical level is also known as the bear market support floor. This is because a breakdown below it is considered as an extension of the ongoing bear run.
Whether the XRP price will bear similar effects is to be seen. However, considering the aforementioned conditions, the altcoin could dip to $0.47. A fall below it would result in the Ripple token falling to $0.42, marking an 18% correction.
Read More: Ripple (XRP) Price Prediction 2024/2025/2030
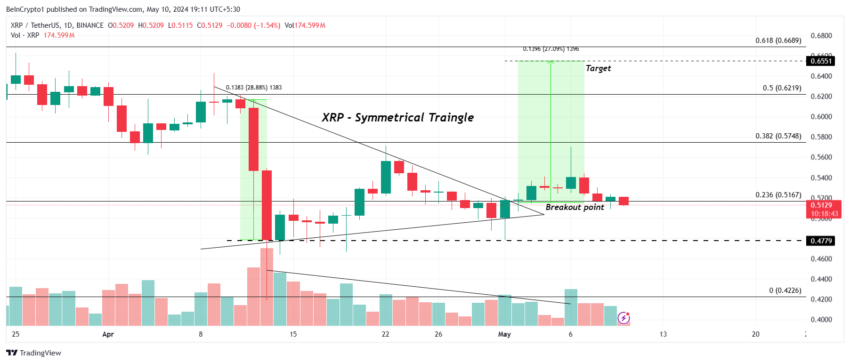
On the other hand, if the 23.6% Fib level is flipped into support, a recovery could occur. Should the XRP price manage to close above the resistance at $0.57, the bearish thesis could be invalidated.
Disclaimer
In line with the Trust Project guidelines, this price analysis article is for informational purposes only and should not be considered financial or investment advice. BeInCrypto is committed to accurate, unbiased reporting, but market conditions are subject to change without notice. Always conduct your own research and consult with a professional before making any financial decisions. Please note that our Terms and Conditions, Privacy Policy, and Disclaimers have been updated.


Canary Capital has filed a Form S-1 registration with the US Securities and Exchange Commission (SEC) to launch a spot exchange-traded fund (ETF) focused on Tron (TRX).
The proposal, submitted on April 18, is the first of its kind to offer investors exposure to TRX’s market performance while also providing staking rewards. This sets the fund apart from previous spot crypto ETF proposals.
Canary Capital’s TRX ETF Could Test SEC Stance on Staking Assets
The filing designates BitGo Trust Company as the custodian for TRX holdings and appoints Canary Capital as the fund’s sponsor.
Justin Sun, the founder of Tron, weighed in on the development, encouraging US investors to act promptly. He emphasized TRX’s potential for long-term growth and suggested institutional interest would likely surge if the ETF is approved.
“US VCs should start buying TRX — and fast. Don’t wait until it’s too late. TRX is a price that only moves one way: up,” Sun said on X.
According to BeInCrypto data, TRX is currently the ninth-largest crypto by market capitalization, valued at approximately $22.94 billion.
Moreover, Tron’s blockchain has gained strong traction in stablecoin settlements, ranking second only to Ethereum. Its efficiency in processing fast and low-cost transactions has made it a preferred choice for Tether’s USDT, based on data from DeFiLlama.

While the proposal has created a buzz in the market, questions remain over its chances of gaining regulatory approval. The inclusion of staking within the ETF is a bold move, but the SEC has historically opposed similar features in other crypto funds.
The SEC has flagged staking services within investment products as potential unregistered securities, leading to increased scrutiny.
Due to this, past Ethereum ETF proposals were forced to remove staking components to align with regulatory expectations.
Nonetheless, several firms, including Grayscale, continue to push for altcoin ETFs that incorporate staking or offer broader asset exposure.
Still, regulatory uncertainty clouds the Canary TRX ETF proposal, especially in light of past controversies involving Justin Sun. The network has also faced allegations of being used by illicit actors, claims it has publicly denied.
If approved, Canary Capital’s ETF would mark a historic milestone by combining exposure to TRX with staking rewards. This structure could attract both retail and institutional investors seeking yield alongside market performance.
Disclaimer
In adherence to the Trust Project guidelines, BeInCrypto is committed to unbiased, transparent reporting. This news article aims to provide accurate, timely information. However, readers are advised to verify facts independently and consult with a professional before making any decisions based on this content. Please note that our Terms and Conditions, Privacy Policy, and Disclaimers have been updated.
Reason to trust
![]()
Strict editorial policy that focuses on accuracy, relevance, and impartiality
Created by industry experts and meticulously reviewed
The highest standards in reporting and publishing
Strict editorial policy that focuses on accuracy, relevance, and impartiality
Morbi pretium leo et nisl aliquam mollis. Quisque arcu lorem, ultricies quis pellentesque nec, ullamcorper eu odio.
XRP is still in consolidation mode after hitting a new seven-year high in January 2025. This consolidation has seen the price drop slowly, but steadily, losing around 40% of its value since then. Currently, bulls seem to have created support for the altcoin at $2, as this level continues to hold even through crashes. Thus, it has created the expectation that the bottom could be close for the XRP price, and this could serve as a bounce-off point.
XRP Price Consolidation Could Be Over Soon
Taking to X (formerly Twitter), crypto analyst Dark Defender revealed that the consolidation that the XRP Price has been stuck in for months now is coming to an end. The analyst used the monthly chart for the analysis, calling out an end and a bottom for the XRP price. According to him, this is actually the “Final Consolidation” for XRP, suggesting that this is where a breakout would start from.
Related Reading
With the consolidation expected to come to an end soon, the crypto analyst highlights what could be next for the altcoin using the 5-Wave analysis. Now, in total, these five waves are still very bullish for the price and could end up marking a new all-time high.
For the first wave, Dark Defender calls it the Impulsive Wave 1, which is expected to begin the uptrend. This first wave is expected to push the price back to $3 before the second wave starts, and this second wave is bearish.
The second wave would trigger a crash from $3 back toward $2.2, providing the setup for the third wave. Once the third wave begins, this is where the crypto analyst expects the XRP price to hit a new all-time high. The target for Wave 3 puts the XRP price as high as $5, clearing the 2017 all-time high of $3.8.
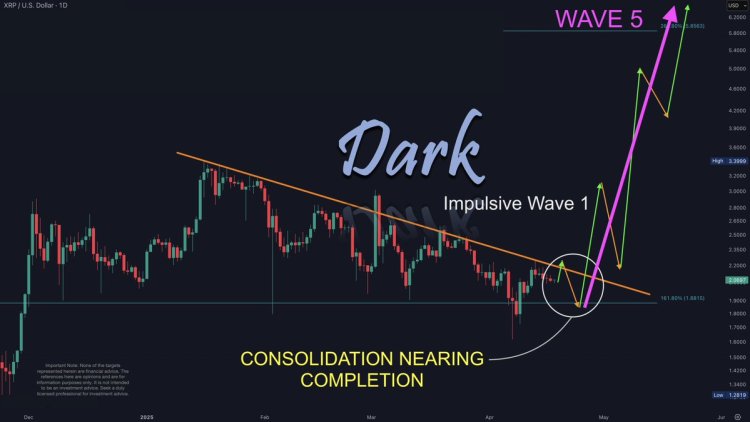
Next in line is the fourth wave, which is another bearish wave. This wave will cause at least a 30% crash, according to the chart shared by the crypto analyst, taking it back toward the $3 territory once again. However, just like the second bearish wave, the fourth bearish wave is expected to set up the price for a final and more explosive Wave 5.
Related Reading
Once the fifth wave is in action, a brand-new all-time high is expected to happen, with the price rising over 100% from the bottom of the fourth wave. The target for this, as shown in the chart, is over $6.
As for the crypto analyst, the major targets highlighted during this wave action are $3.75 and $58.85. Then, for major supports and resistances, supports are $1.88 and $1.63, while resistances lie at $2.22 and $2.30.
Featured image from Dall.E, chart from TradingView.com

Reason to trust
![]()
Strict editorial policy that focuses on accuracy, relevance, and impartiality
Created by industry experts and meticulously reviewed
The highest standards in reporting and publishing
Strict editorial policy that focuses on accuracy, relevance, and impartiality
Morbi pretium leo et nisl aliquam mollis. Quisque arcu lorem, ultricies quis pellentesque nec, ullamcorper eu odio.
XRP has been trading under pressure in recent weeks, losing much of the momentum it built during its late 2024 to early 2025 rally. After reaching highs above $3.40, the asset has experienced an 18.3% decline over the past month, reflecting broader market softness.
At the time of writing, XRP trades significantly below its peak at a price of $2.06, with subdued investor activity and falling market participation across both spot and derivatives markets.
Related Reading
XRP On-Chain Activity Slows, But Price Remains Relatively Stable
Amid XRP’s decline, a CryptoQuant analyst known as EgyHash has recently shared his analysis on the altcoin in a post titled, “XRP’s Market Paradox: With Ledger Activity Dipping 80%, Is a Rebound on the Horizon?”
According to EgyHash, XRP’s on-chain and futures market data presents a mixed picture—declining activity but resilience in price. EgyHash noted that XRP Ledger activity has fallen sharply since December, with the percentage of active addresses down by 80%.
Similar declines have been observed in the futures market, where open interest has dropped roughly 70% from its highs, and funding rates have occasionally turned negative.

He added that the Estimated Leverage Ratio, which gauges average user leverage by comparing open interest to coin reserves, has also dropped significantly.
Despite these indicators pointing to weakening momentum, the altcoin’s price has only declined about 35% from its peak. This is a milder correction compared to other assets such as Ethereum, which has fallen roughly 60% over the same period.
Additionally, the altcoin’s Exchange Reserve has continued to decline, reaching levels last observed in July 2023. Lower reserves typically suggest that fewer tokens are available for immediate sale, a factor that can help support prices during market downturns.

According to EgyHash, this trend, along with relatively stable pricing, could indicate growing long-term confidence in the asset.
Institutional Developments Could Strengthen Market Sentiment
While on-chain metrics remain a focus, institutional developments may also play a role in shaping XRP’s future trajectory. Hong Kong-based investment firm HashKey Capital recently announced the launch of the HashKey XRP Tracker Fund—the first XRP-focused investment vehicle in Asia.
Backed by Ripple as the anchor investor, the fund is expected to transition into an exchange-traded fund (ETF) in the future. The initiative is designed to attract more institutional capital into the XRP ecosystem.
HashKey Capital is launching Asia’s first XRP Tracker Fund—with @Ripple as an early investor.
This marks a major step in expanding institutional access to XRP, the third-largest token by market cap. 🧵👇
— HashKey Capital (@HashKey_Capital) April 18, 2025
HashKey Capital has also indicated that this collaboration with Ripple could lead to further projects, including tokenized investment products and decentralized finance (DeFi) solutions.
Related Reading
Vivien Wong, a partner at HashKey, emphasized the strategic value of integrating Ripple’s network with regulated investment infrastructure across Asia.
Although the altcoin faces near-term pressure, long-term developments, including decreasing exchange reserves and rising institutional interest, may support its recovery as the broader market stabilizes.
Featured image created with DALL-E, Chart from TradingView

Ethereum Trades At Bear Market Lows: Fundamentals Signal Major Undervaluation

Canary Capital Aims to Launch TRON-Focused ETF

Cardano Price To Hit $4 If This Happens, Analyst Says Despite 180M ADA Dump

XRP Consolidation About To Reach A Bottom, Wave 5 Says $5.85 Is Coming
Chainlink Price To Hit $26 If LINK Breaks Past This Crucial Level

Despite an 18% Drop, XRP’s Exchange Supply Hits Lows—Bullish Setup Ahead?

2.52 Million Altcoins Are Ruining Crypto’s Future

Animoca Brands Valuation Tanks 75% In Two Years, Here’s Why

Crypto exchange BingX hacked for $43 million

Are The Big Players Losing Interest?

Hong Kong’s Securities Association Tips Authorities On Crypto Self-Regulation

Coinbase cbBTC Set to go Live on Solana
2.52 Million Altcoins Are Ruining Crypto’s Future
Animoca Brands Valuation Tanks 75% In Two Years, Here’s Why
Crypto exchange BingX hacked for $43 million
Are The Big Players Losing Interest?
Hong Kong’s Securities Association Tips Authorities On Crypto Self-Regulation
Coinbase cbBTC Set to go Live on Solana
-
 Altcoin21 hours ago
Ethereum ETFs Record $32M Weekly Outflow; ETH Price Crash To $1.1K Imminent?
-

 Market14 hours ago
MEME Rallies 73%, BONE Follows
-

 Market13 hours ago
Pi Network Roadmap Frustrates Users Over Missing Timeline
-

 Ethereum19 hours ago
Ethereum Price Stalls In Tight Range – Big Price Move Incoming?
-

 Market22 hours ago
Why Relying on TVL Could Mislead Your DeFi Strategy
-

 Market20 hours ago
Are Ethereum Whales Threatening ETH Price Stability?
-

 Market12 hours ago
Solana (SOL) Price Rises 13% But Fails to Break $136 Resistance
-
 Market19 hours ago
How $31 Trillion in US Bonds Could Impact Crypto Markets in 2025