
Market
Can It Power Toward New Gains?
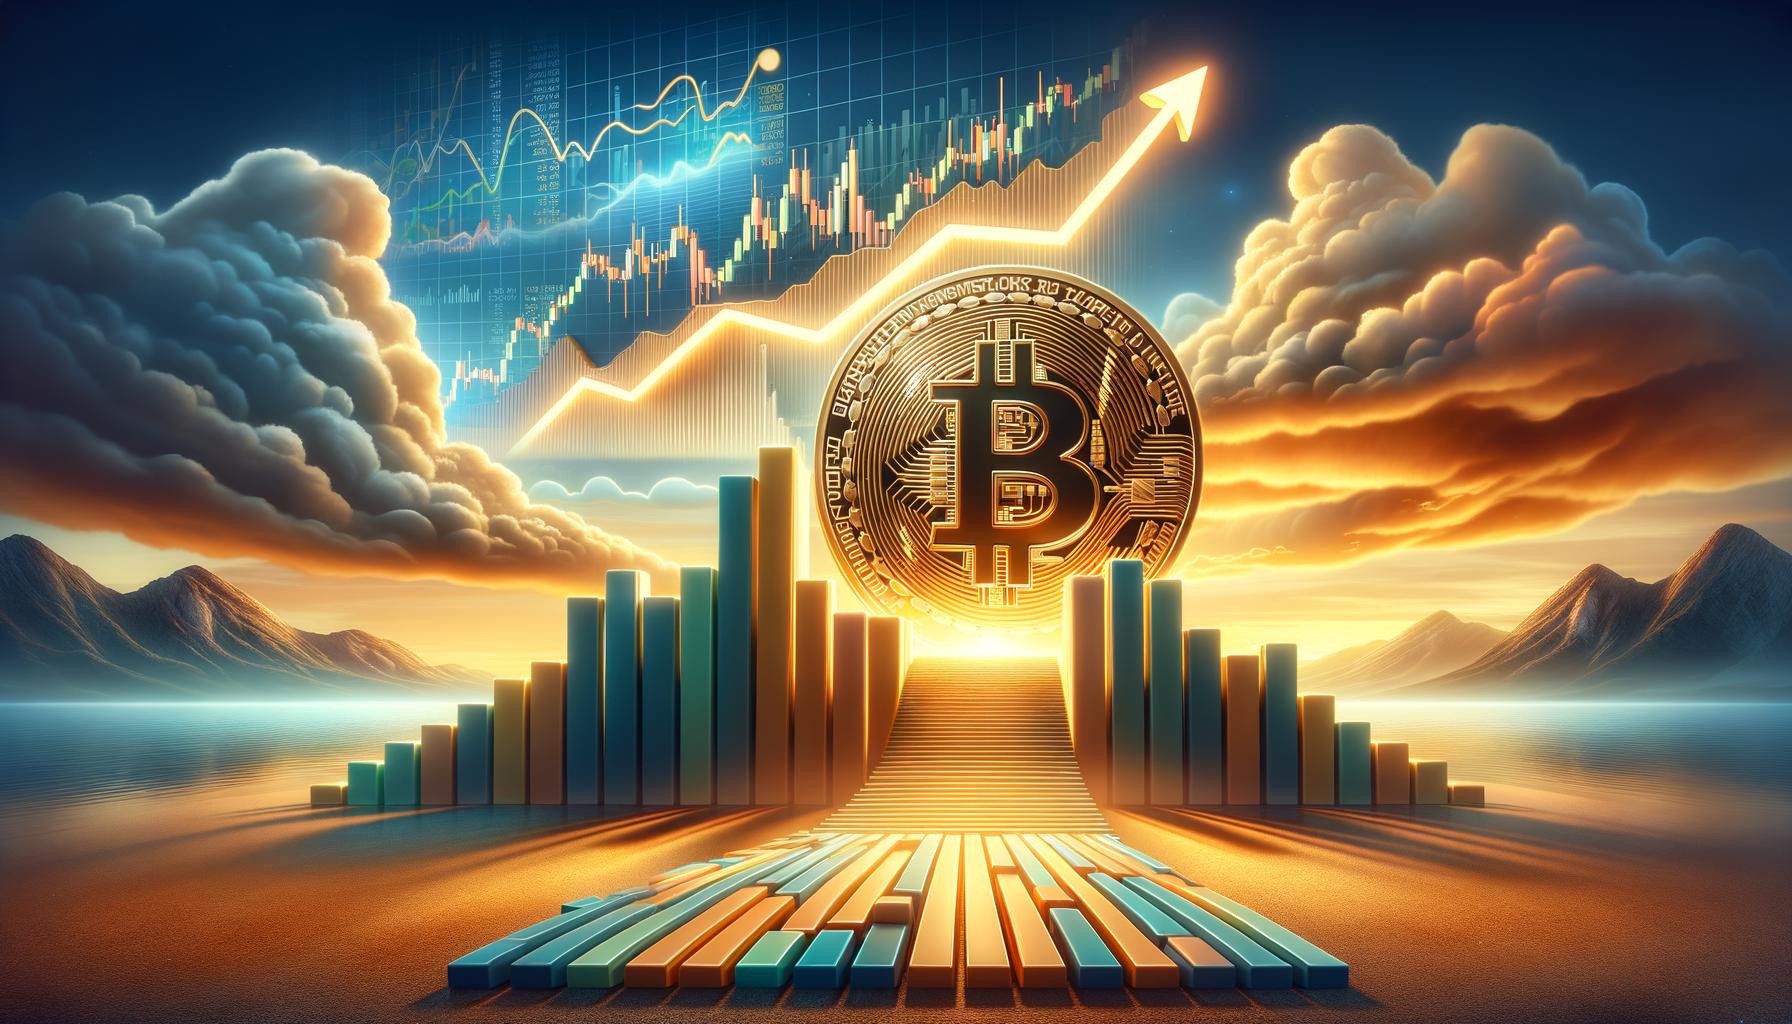
Bitcoin price climbed further higher above the $67,500 resistance zone. BTC is now consolidating and might clear the $68,350 resistance to continue higher.
- Bitcoin remained stable and extended gains above the $68,000 zone.
- The price is trading above $67,200 and the 100 hourly Simple moving average.
- There is a connecting bullish trend line forming with support at $66,800 on the hourly chart of the BTC/USD pair (data feed from Kraken).
- The pair could rally further if there is a close above the $68,000 resistance zone.
Bitcoin Price Remains Supported for More Upsides
Bitcoin price remained supported and extended its increase above the $67,500 resistance. BTC cleared the $67,800 resistance to move into a positive zone. The price even rallied above the $68,000 and $68,200 resistance levels.
The price traded as high as $68,328 and currently consolidating gains. There was a minor decline below the $68,000 level. The price dipped and tested the 23.6% Fib retracement level of the upward move from the $64,686 swing low to the $68,328 high.
Bitcoin price is now trading above $67,200 and the 100 hourly Simple moving average. There is also a connecting bullish trend line forming with support at $66,800 on the hourly chart of the BTC/USD pair.
On the upside, the price could face resistance near the $68,000 level. The first key resistance is near the $68,350 level. A clear move above the $68,350 resistance might send the price higher. The next key resistance could be $68,800.

A close above the $68,800 resistance might initiate more gains. In the stated case, the price could rise and test the $70,0200 resistance level. Any more gains might send the price toward the $72,000 resistance level.
Another Drop In BTC?
If Bitcoin fails to rise above the $68,000 resistance zone, it could start another decline. Immediate support on the downside is near the $66,800 level and the trend line.
The first major support is near the $66,500 level and the 50% Fib retracement level of the upward move from the $64,686 swing low to the $68,328 high. The next support is now near the $66,500 zone. Any more losses might send the price toward the $65,400 support in the near term.
Technical indicators:
Hourly MACD – The MACD is now losing pace in the bullish zone.
Hourly RSI (Relative Strength Index) – The RSI for BTC/USD is now above the 50 level.
Major Support Levels – $66,800, followed by $65,400.
Major Resistance Levels – $68,000, and $68,350.


Reason to trust
![]()
Strict editorial policy that focuses on accuracy, relevance, and impartiality
Created by industry experts and meticulously reviewed
The highest standards in reporting and publishing
Strict editorial policy that focuses on accuracy, relevance, and impartiality
Morbi pretium leo et nisl aliquam mollis. Quisque arcu lorem, ultricies quis pellentesque nec, ullamcorper eu odio.
A crypto analyst has shared insights into the recent strength in the XRP price, suggesting that South Korea may be the reason behind it. The analyst noted that the altcoin has been seeing high trading volume on South Korean exchanges, and this localized demand may be holding up its price while other altcoins struggle to gain traction.
How South Korea Is Bolstering The Price
According to XForceGlobal South Korea is currently one of the major drivers of the XRP price action. In a recent post on X (formerly Twitter), the analyst disclosed that the engagement and adoption from the crypto users in South Korea was a major contributor to XRP’s bullish performance.
Related Reading
Currently, South Korea is one of the most active crypto markets in the world, leading in global trading volume across multiple assets. However, among the numerous cryptocurrencies in the market, XRP stands out the most within the country. The analyst has revealed that even during low trading days, XRP frequently outpaces Bitcoin, underscoring its high demand and adoption in South Korea.
XForceGlobal has suggested that South Korea’s notable interest in XRP likely stems from its status as one of the most isolated countries in terms of crypto regulations. The analyst revealed that millions of citizens currently own the altcoin, making up about 20% of the cryptocurrency’s market cap valuation.
Moreover, due to a lack of large-scale cross-border payment solutions, most South Koreans opt to use cryptocurrencies like XRP to facilitate transactions. This, in turn, fuels adoption and strengthens the cryptocurrency’s utility, which positively influences its price action.
Compared to South Korea, the regulatory uncertainties and legal challenges in the United States (US) have slowed down XRP’s growth. XForceGlobal has stated that the active participation of retail institutions, strong community support, and early adoption in South Korea have helped prop up prices despite the difficulties it faced over the past years.
What The Future Holds For XRP In South Korea
While discussing the impact of South Korea’s support for XRP on its price action, XForceGlobal offered insights into the cryptocurrency’s future in the country. The analyst revealed that the market is at a pivotal moment where XRP has evolved from a speculative asset to a symbol of Korea’s dominance in the crypto market.
Related Reading
Currently, Upbit, the largest crypto exchange in South Korea, holds the most significant market share of XRP in terms of total supply. The exchange reportedly has about 6 billion XRP, accounting for roughly 5% of the entire supply.
XForceGlobal has revealed that the continued demand from retail investors combined with Upbit’s massive XRP reserve will make South Korea a key driver to the cryptocurrency’s global future price action.
Moving forward, the analyst has discussed XRP’s price movements on the Korean won chart, suggesting that its current action may be foreshadowing upcoming events. He pointed out that the altcoin has already formed a lower low on the chart, possibly hinting at a more controlled pullback rather than an impulsive decline — an outlook he described as “arguably bearish”.
The crypto analyst also noted that XRP may be forming a potential bottom on the Korean won chart, indicating a possible impulse to the upside and a bullish continuation.
Featured image from Adobe Stock, chart from Tradingview.com

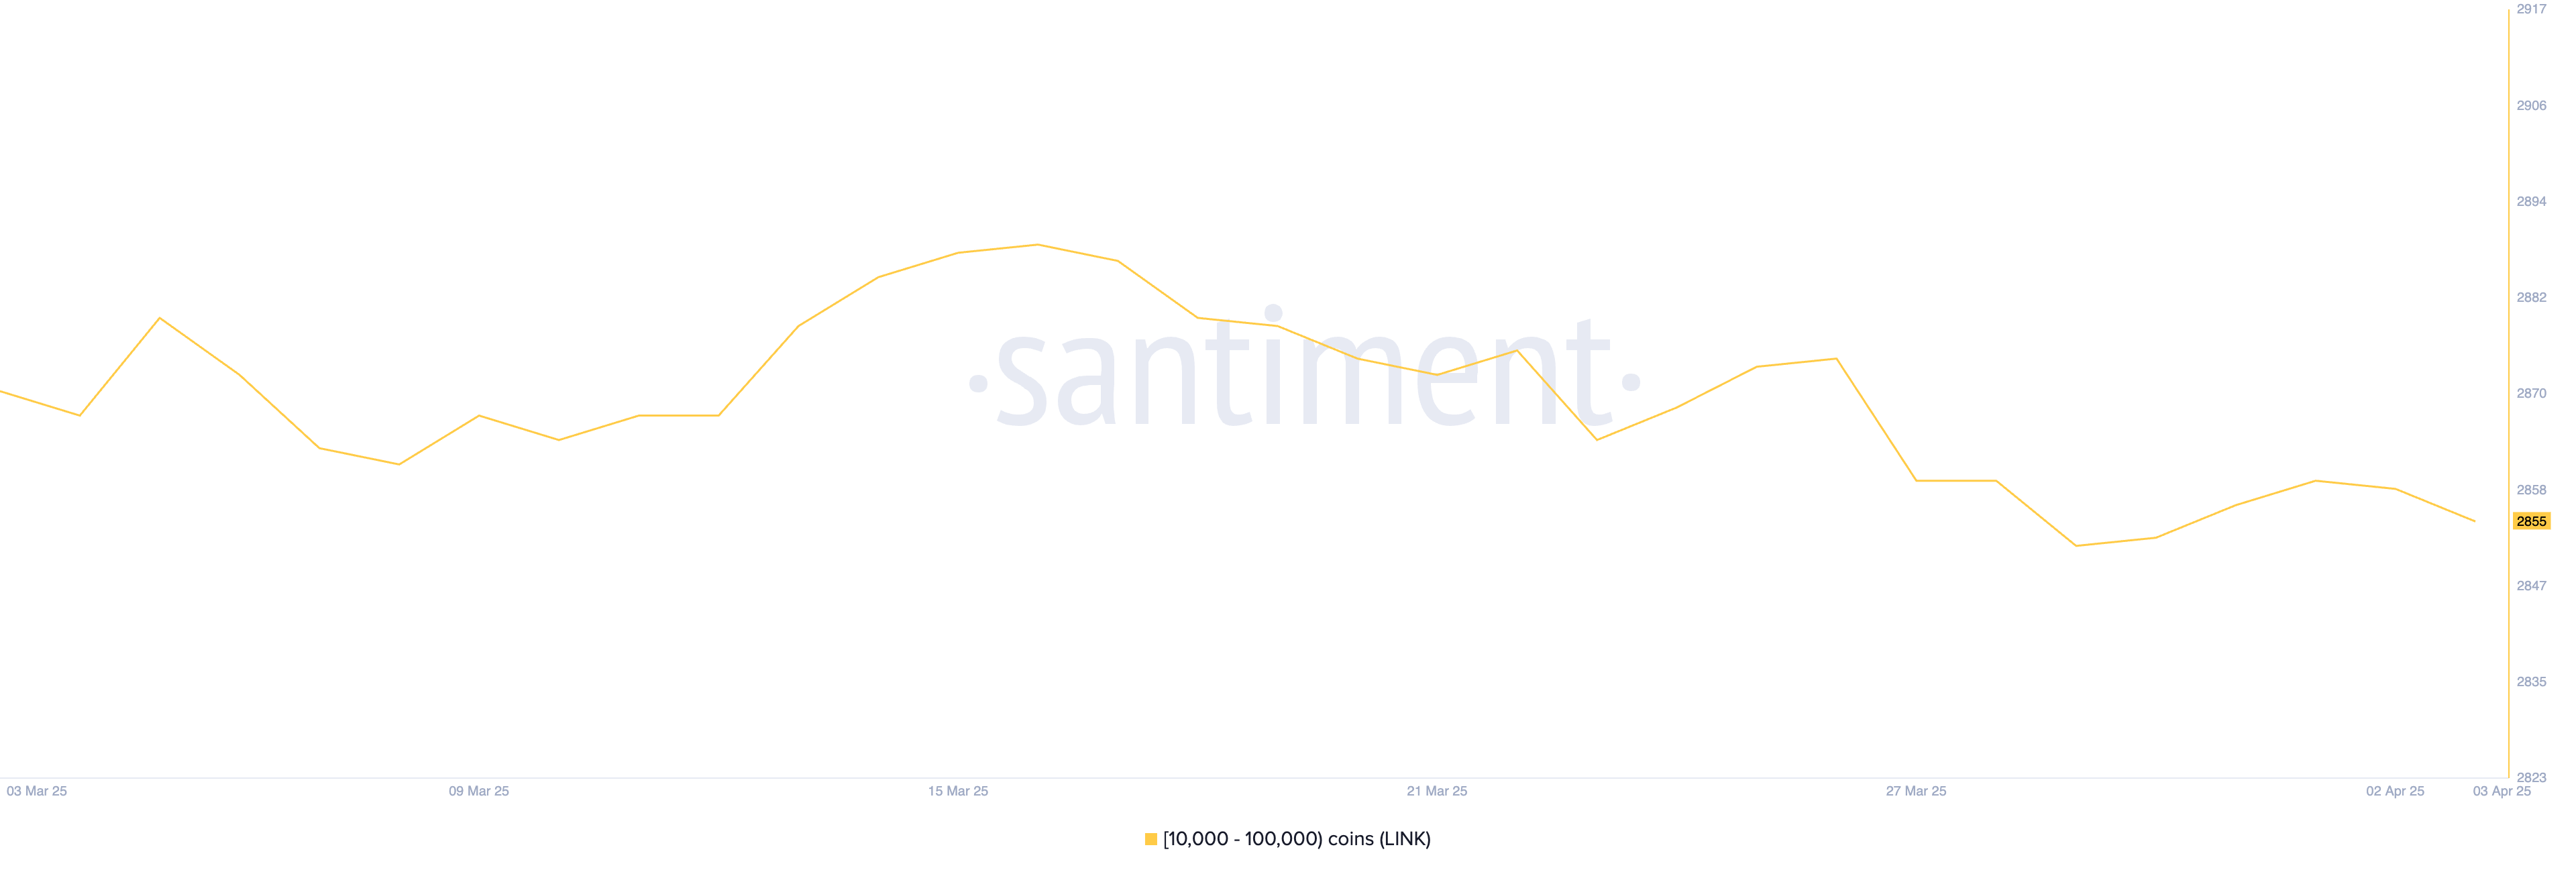
Crypto whales have begun to quietly shift their altcoin positions following Trump’s Liberation Day tariffs. Uniswap (UNI), Chainlink (LINK), and Ondo Finance (ONDO) have all seen declines in the number of wallets holding between 10,000 and 100,000 tokens.
While the sell-off hasn’t been dramatic, the timing and consistency across multiple tokens suggest growing caution or short-term repositioning. As these altcoins face key support and resistance levels, whale behavior could continue to shape their price trajectories in the coming days.
Uniswap (UNI)
The number of Uniswap (UNI) addresses holding between 10,000 and 100,000 tokens has been steadily declining, a trend that began before Trump’s so-called Liberation Day and has continued in its aftermath.
Between April 2 and April 3 alone, this group of crypto whales dropped from 825 to 821, signaling a slight but notable reduction in confidence or positioning from a segment often seen as strategically reactive.
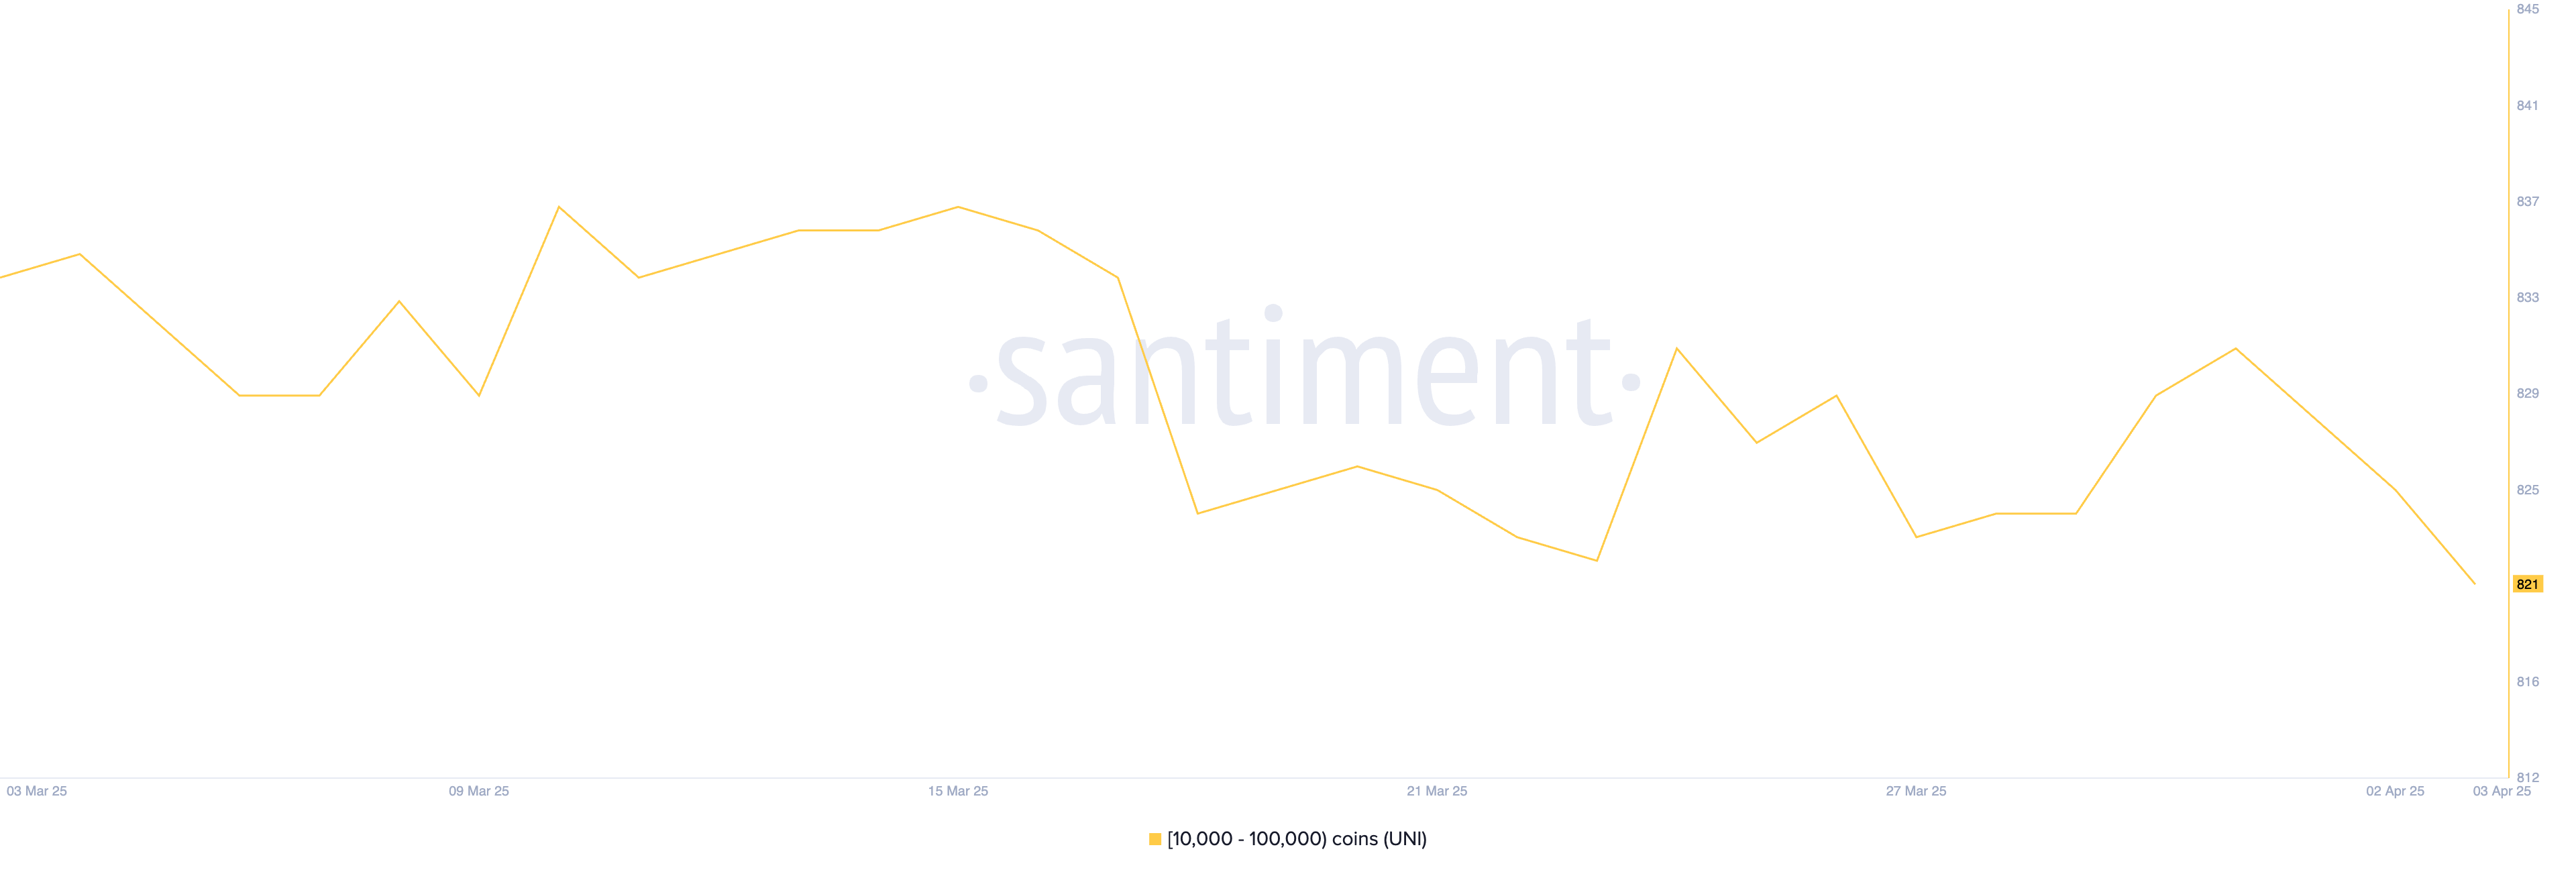
While this decline may seem modest, it reflects a broader sentiment of caution among larger UNI holders, which often precedes or reinforces price weaknesses.
Currently, UNI price remains in a clear downtrend, with growing risks of a drop toward the $5.50 level or even below it if bearish momentum continues. However, if the trend begins to reverse, the token could first test resistance at $5.97.
A successful breakout from there could push Uniswap higher toward $6.23, a level that would suggest a stronger recovery is underway.
For now, though, the decrease in whale-sized wallets and prevailing bearish momentum place the asset in a vulnerable technical position.
Chainlink (LINK)
While the number of Chainlink (LINK) whale addresses—those holding between 10,000 and 100,000 LINK—only slightly declined after Trump’s Liberation Day, falling from 2,859 to 2,855, the context leading up to that matters more.
From March 29 to April 1, this group was actively accumulating, with the number of crypto whales rising from 2,852 to 2,860. This short burst of accumulation suggested growing confidence in LINK’s upside potential heading into the month.
The recent dip may simply reflect mild profit-taking or caution during the current correction rather than a broader shift in sentiment.
Technically, LINK is at a critical point. If the ongoing correction deepens, the token could fall below $12 for the first time since November 2024, with $11.85 as the key support to watch.
However, if the trend shifts and buyers regain control, LINK could first test resistance at $13. A break above that level would likely open the door for a move toward $13.45.
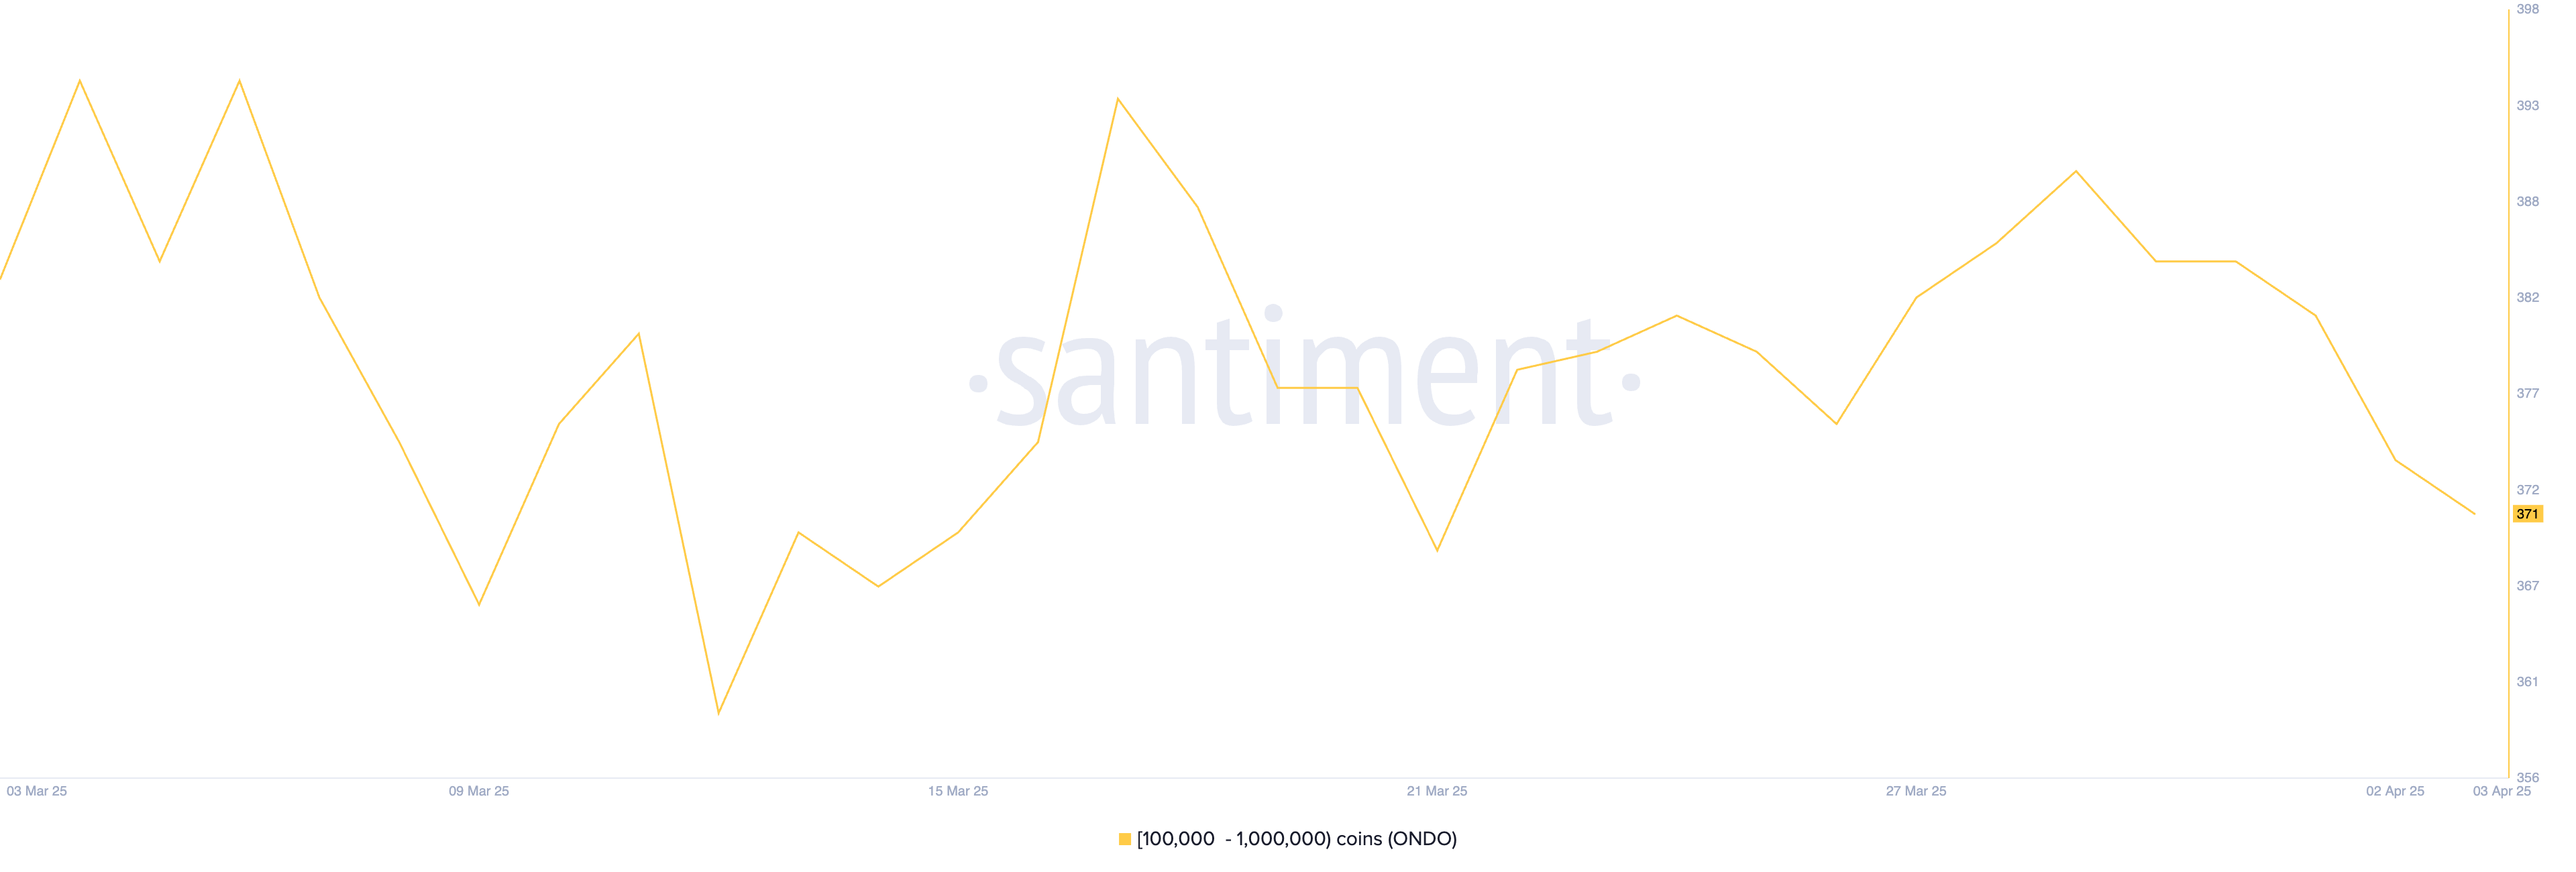
Ondo Finance (ONDO)
ONDO is showing a trend similar to Chainlink, with whale accumulation taking place between March 26 and March 29 as the number of addresses holding between 10,000 and 100,000 ONDO grew from 376 to 390.
This wave of accumulation pointed to growing interest and confidence from larger holders. However, after peaking, the number of whales started to drop, falling from 374 to 371 following Trump’s Liberation Day.
This decline, while subtle, may indicate a pause in optimism or a cautious shift in positioning among key players.
From a price perspective, ONDO now sits at an important moment. If it can regain the bullish momentum seen last month, it could push through the resistance at $0.82, with the potential to climb further toward $0.90 or even $0.95 if strength persists.
However, if momentum continues to fade, downside risks increase, with support levels around $0.76 and $0.73 likely to be tested.
Disclaimer
In line with the Trust Project guidelines, this price analysis article is for informational purposes only and should not be considered financial or investment advice. BeInCrypto is committed to accurate, unbiased reporting, but market conditions are subject to change without notice. Always conduct your own research and consult with a professional before making any financial decisions. Please note that our Terms and Conditions, Privacy Policy, and Disclaimers have been updated.

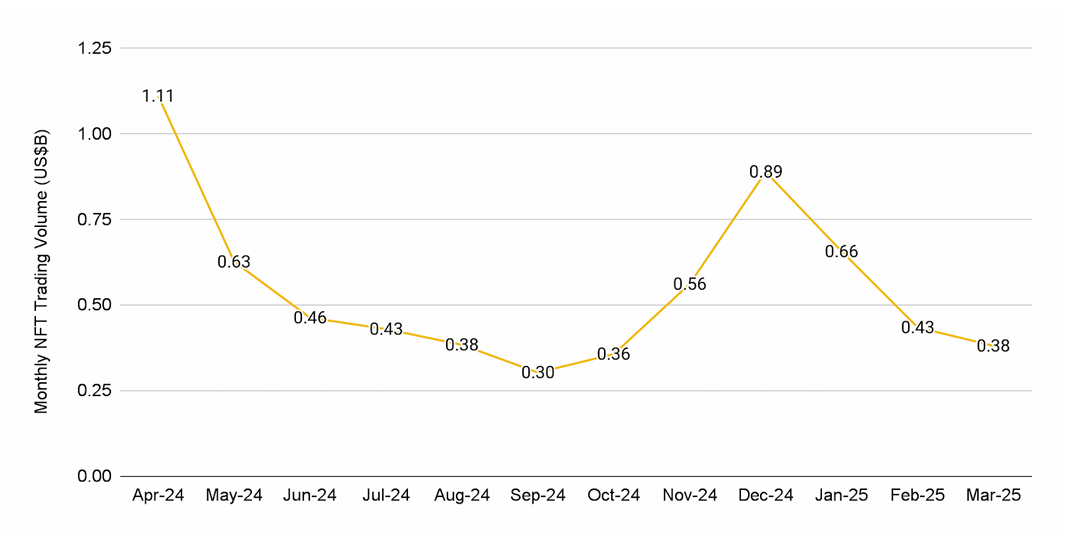
According to the latest Binance research, the NFT market saw a sharp drop in March 2025. Total sales volume across the top 10 blockchains fell by 12.4%, signaling weaker buyer interest. Only two chains—Immutable and Panini—bucked the trend.
The number of unique NFT buyers dropped to its lowest level since October 2023, pointing to a slowdown caused by global economic pressures.
Are NFTs Dying Out in 2025?
Ethereum-based NFTs suffered the most. Sales on the network dropped 59.3%, with only CryptoPunks recording any growth among the top 20 collections. Bored Ape Yacht Club and Pudgy Penguins both posted losses of more than 50%.
Panini saw a strong surge in activity. Its digital collectibles jumped 259.2% in sales, placing it among the top 10 NFT blockchains.
With a long legacy in physical collectibles, Panini’s digital offering uses blockchain to validate asset ownership.
Despite the broader slowdown, brands and creators continue to explore new NFT concepts. Azuki collaborated with artist Michael Lau to launch a physical-backed NFT.
The Sandbox teamed up with Jurassic World to bring licensed dinosaurs into its metaverse experience.
Still, market contraction has led to several closures. Bybit announced it is shutting down its NFT Marketplace, Inscription Marketplace, and IDO platform.
X2Y2 is also winding down after handling $5.6 billion in trading volume. Activity has dropped by 90% since NFTs peaked in 2021, pushing many platforms out of the market.
“Marketplaces live or die by network effects. We fought tooth and nail to be #1, but after three years, it’s clear it’s time to move on. The NFT chapter taught us a lot—most of all, that lasting value beats chasing trends. That lesson’s why we’re drawing a line here, not a pause or a maybe, but a full stop on X2Y2 as we knew it,” X2Y2 wrote in its announcement.
Also, Kraken ended its NFT operations in February, shifting focus to other business areas.
Meanwhile, NFT-related tokens continue to fall. Magic Eden has lost 94% of its value since its launch four months ago. Pudgy Penguins (PENGU) has declined nearly 30% over the past month, despite its Coinbase listing.
Ethereum’s revenue has also taken a hit. Transaction fee income has dropped by 95% since late 2021, driven by falling NFT activity and fewer contributions from Layer 2 networks.
This has been reflected in Ethereum’s price, as the altcoin declined by 58.8% from its all-time high. Q1 2025 marked its worst quarter since 2018.
Disclaimer
In adherence to the Trust Project guidelines, BeInCrypto is committed to unbiased, transparent reporting. This news article aims to provide accurate, timely information. However, readers are advised to verify facts independently and consult with a professional before making any decisions based on this content. Please note that our Terms and Conditions, Privacy Policy, and Disclaimers have been updated.
5 Facts About Bitcoin’s Creator

Is Korea Propping Up The XRP Price? Pundit Explains What’s Happening

PayPal Adds Chainlink And Solana To Its US Cryptocurrency Service

Crypto Whales Are Selling These Altcoins Post Trump Tariffs

NFT Market Falls 12% in March as Ethereum Sales Drop 59%

Bitcoin Eyes Breakout as Global M2 Hits Record $108 Trillion


-

 Market23 hours ago
Ethereum Price Losing Ground—Is a Drop to $1,550 Inevitable?
-

 Market22 hours ago
XRP Battle Heats Up—Can Bulls Turn the Tide?
-

 Bitcoin19 hours ago
Japanese Company Unveils Plans To Buy Crypto
-

 Bitcoin20 hours ago
Why Are Retail Investors Turning to XRP Over Bitcoin?
-

 Market12 hours ago
XRP Price Vulnerable To Falling Below $2 After 18% Decline
-
 Altcoin18 hours ago
Pi Coin Price Crashes 15%, Is Coinbase Listing Only Hope?
-

 Market11 hours ago
Will the SEC Approve Grayscale’s Solana ETF?
-

 Bitcoin22 hours ago
Why Recency Bias Is Amplifying Fear Around Bitcoin’s Price
 Arabic
 Chinese (Simplified)
 Dutch
Dutch English
 French
 German
 Italian
 Portuguese
 Russian
 Spanish
 Vietnamese