
Market
Can Ethereum ETFs Push ETH Price Past $5,000 by Q3?

As July approaches, spot Ethereum ETFs, which received the US SEC partial green light on May 23, near their official launch. Many investors wonder if the price of Ethereum (ETH) will follow Bitcoin’s (BTC) reaction to its related financial instruments in January.
That answer, however, lies in the future, which may begin in a few days. While waiting, the on-chain analysis provides actionable insights that can predict if the altcoin is following a likely pattern.
The Altcoin Investors Are in High Spirits
Amendment of registration documents is one factor that has delayed the live trading of the spot Ethereum ETFs. However, in a recent interview, SEC Chair Gary Gensler confirmed that things were going smoothly.
Furthermore, a report from anonymous sources at the regulatory agency reveals that the products will launch on July 4.
Following the development, BeInCrypto monitors holder behavior towards ETH. According to our findings, ETH holders display resolute confidence in the cryptocurrency. We discovered this after examining the LTH-NUPL provided by the analytic platform Glassnode.
The metric stands for Long Term Holder-Net Unrealized Profit/Loss. It measures the behavior of holders who have owned a cryptocurrency for over 155 days. As seen in the chart below, different colors exist for different sentiments.
Read more: Ethereum ETF Explained: What It Is and How It Works
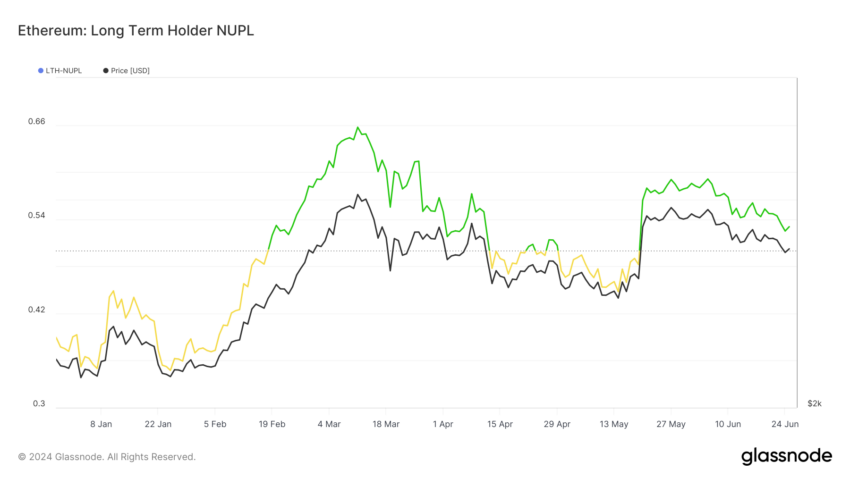
While red indicates capitulation, orange means fear. Yellow indicates optimism, while blue suggests greed. Currently, Ethereum’s LTH-NUPL is in the belief (green) zone. When this happens, long-term investors are confident about a forthcoming price increase.
However, ETH has experienced a 12.75% decline in the last 30 days while it trades at $3,365. In situations like this, the broader sentiment is expected to be bearish. Thus, as perception tilts toward confidence, the much-anticipated development seems to be the reason. If sustained till launch day, it can propel higher demand for ETH.
Ethereum Is Taking Bitcoin Out of the Way
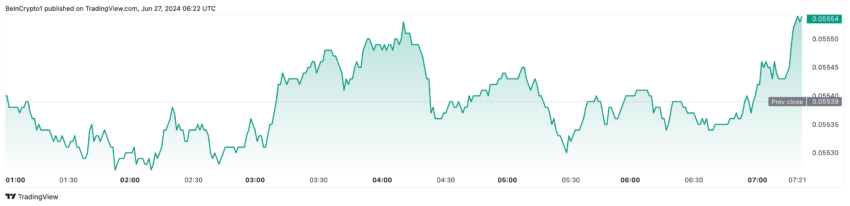
Meanwhile, perception alone cannot push the price. Therefore, we evaluate another indicator that can affect the altcoin’s price, which is the ETH/BTC ratio. This ratio tells whether Bitcoin is outperforming Ethereum or the other way around. Specifically, if the ETH/BTC ratio is high, it means that ETH is performing better than Bitcoin.
However, a low ratio implies that BTC is outperforming ETH. As of this writing, the ratio is 0.055—up 2.33% within the last seven days. This means that today, one ETH can purchase 0.055 BTC.
Should the ratio continue increasing, Bitcoin’s market dominance will decrease. As such, Ethereum can step up while its price may climb much higher. Considering Bitcoin’s performance, the price rose by 56.95% in less than two months after approval.
If ETH mirrors a similar move, the value of the cryptocurrency will be worth $5,308 before the end of the third quarter (Q3). Now, let’s examine the altcoin’s short-term potential.
ETH Price Prediction: It Is Not Priced In
According to the daily chart, the 20 (blue) and 50 (yellow) EMAs sit above Ethereum’s price. EMA stands for Exponential Moving Average. It is an indicator measuring trend direction over a given period.
When the EMA is below the price, it indicates that bulls are defending it. However, the indicator being above the price gives credence to the downside. If conditions remain the same, ETH may drop to $3,278. This position also shows that ETH is not yet priced in.
In simple terms, this means that the economic impact of the upcoming development has yet to be reflected in the current market price. Hence, it can be assumed that the value still has the potential to jump.
However, both EMAs are on the brink of reaching the same point. If this happens, ETH’s price will move sideways, potentially consolidating between $3,355 and $3,610. However, if the 20 EMA flips the 50 EMA (bullish crossover), the altcoin may key into the $3,866 resistance.
Read more: Ethereum (ETH) Price Prediction 2024/2025/2030
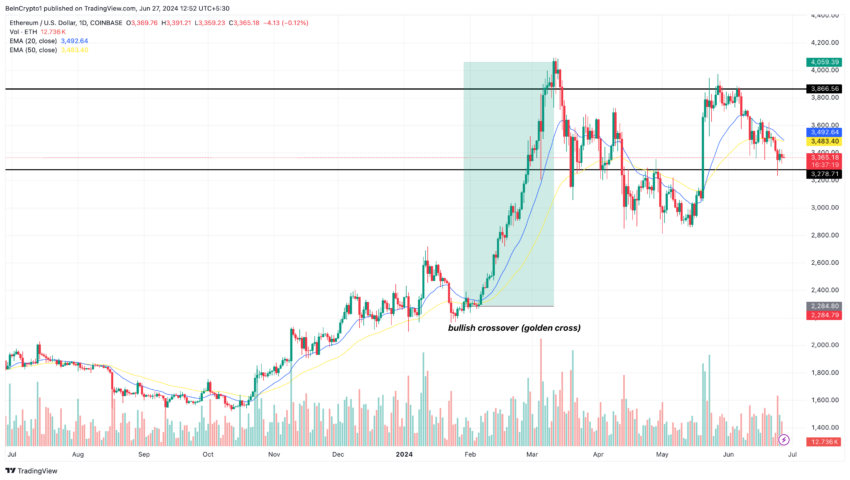
In a highly bullish scenario, ETH may replicate its performance between February and March, reaching $4,059 before the end of July.
In addition, the value of inflows is one major concern that investors have. From comments online, a number of analysts are not sure if the Ethereum ETFs can pull the kind of volume Bitcoin did.
However, a previous prediction placed the inflows at $569 million monthly. Should Ethereum match this volume, a rally past the altcoin’s all-time high may happen within a short period.
But if the reception to the development is “all talk no action”, ETH’s price may nosedive, possibly reaching another 10% decline.
Disclaimer
In line with the Trust Project guidelines, this price analysis article is for informational purposes only and should not be considered financial or investment advice. BeInCrypto is committed to accurate, unbiased reporting, but market conditions are subject to change without notice. Always conduct your own research and consult with a professional before making any financial decisions. Please note that our Terms and Conditions, Privacy Policy, and Disclaimers have been updated.


Representative French Hill, who Chairs the House Committee on Financial Services, rejected requests to approve interest-bearing stablecoins. Coinbase CEO Brian Armstrong made a public appeal in support of this yesterday.
Hill has been a vocal supporter of new stablecoin regulations, and the crypto industry counted his Committee appointment as a victory.
French Hill Rejects Interest-Bearing Stablecoins
If there’s one topic that’s a top priority for US crypto policy, it’d be stablecoin regulations. Significant momentum is building behind pro-industry regulations, and President Trump claimed that stablecoins will play a role in dollar dominance. However, Representative French Hill pushed back on one request, saying he opposes interest-bearing stablecoins:
“I hear the point of view, but I don’t think that there’s consensus among the parties or the Houses [of Congress] on having a dollar-backed payment stablecoin pay interest to the holder of that stablecoin,” Hill told reporters earlier today.
Although Hill portrayed this position on stablecoins as a common-sense viewpoint, it represents a limit to the crypto industry’s political influence. When Hill was chosen to head the House Committee on Financial Services, crypto took it as a big win. Further, he’s been a visible presence in the fight for stablecoin regulation. So, what’s the problem?
Essentially, Coinbase CEO Brian Armstrong made an appeal to Hill and other legislators regarding interest-bearing stablecoins. Just yesterday, Armstrong called this policy a “win-win” and a huge opportunity to help consumers and the economy.
“US stablecoin legislation should allow consumers to earn interest on stablecoins. The government shouldn’t put it’s thumb on the scale to benefit one industry over another. Banks and crypto companies alike should both be allowed to, and incentivized to, share interest with consumers. This is consistent with a free market approach,” Armstrong claimed.
Since Armstrong made this public appeal yesterday, it’s remarkable that Hill rejected his vision of stablecoins so quickly. Ostensibly, Armstrong’s political influence has been on the rise, as he played a prominent role in Trump’s Crypto Summit, and the SEC dropped its suit against Coinbase.
It’s an important fact for the US crypto industry to learn: no matter how quickly its influence is growing, it’s still very new to most people. Earlier this year, a string of state-level Bitcoin Reserve proposals failed in Republican-controlled states. President Trump may support crypto, but his supporters have limits.
Disclaimer
In adherence to the Trust Project guidelines, BeInCrypto is committed to unbiased, transparent reporting. This news article aims to provide accurate, timely information. However, readers are advised to verify facts independently and consult with a professional before making any decisions based on this content. Please note that our Terms and Conditions, Privacy Policy, and Disclaimers have been updated.

UPCX suffered a major hack today, with 18.4 million UPC tokens stolen from its management accounts. This amounts to about $70 million dollars, and the price of UPC fell drastically.
The hackers stole more UPC than is currently circulating in the markets and haven’t offloaded any assets yet. It is unclear who did this or how they will be able to secure their gains in other assets.
UPCX Suffers Major Hack
Cyvers, a crypto security firm that has tracked and uncovered several major crimes, identified a serious hack this morning. Multiple suspicious transactions took place involving UPCX’s management account, and the firm acknowledged suspicious activity. UPCX didn’t go into great detail, only describing a few security measures, but Cyvers showed the extent of the hack:
“It appears that someone gained access to the address 0x4C….3583E, upgraded the ‘ProxyAdmin’ contract, and executed the ‘withdrawByAdmin’ function, resulting in the transfer of 18.4 million UPC (approximately $70 million) from three different management accounts,” Cyvers claimed via social media.
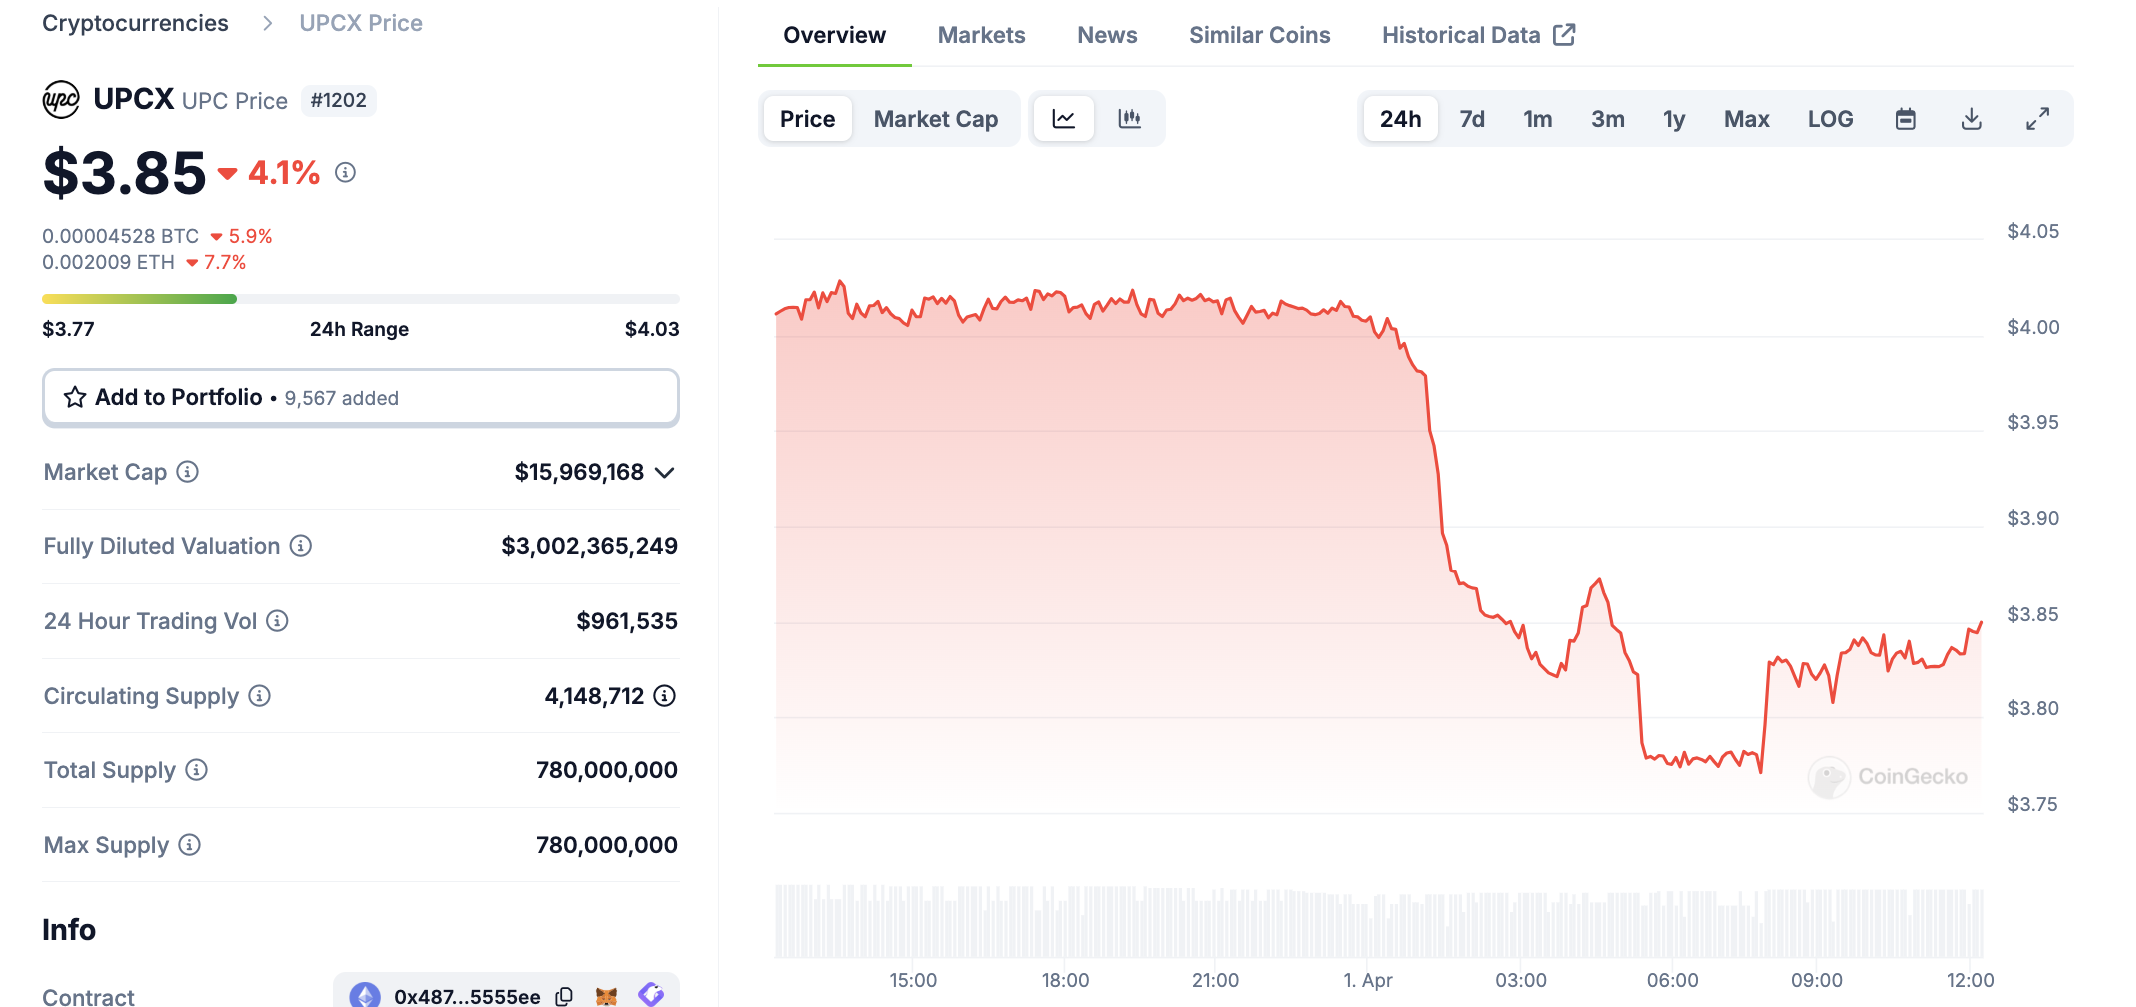
UPCX is an open-source crypto payment system, and this hack may represent a serious blow to the company. According to CoinGecko data, the hackers stole significantly more UPC tokens than are currently available, which is around 4 million. Naturally, this caused the price to drop significantly, in an immediate drop of over 4%:
Although a $70 million hack will certainly damage UPCX individually, it’s unclear if it will actually impact the broader market much. The largest hack in crypto history took place a little over a month ago, and the community is still assessing the fallout. Meanwhile, UPCX is comparatively tiny; less than 10,000 X users viewed its post admitting to the security breach.
Since the UPCX hack took place, the recipient account hasn’t moved any of its UPC tokens. Indeed, it may be difficult for the perpetrator to convert these assets into usable fiat in the first place. If the hackers stole nearly 5x the amount of UPC tokens in circulation, any attempt to liquidate them will crash UPC’s token price even further.
Ultimately, the UPCX hack is strange for several reasons. Despite a large dollar amount, it hasn’t attracted a huge amount of buzz or impacted the market outside UPC. Hopefully, further analysis will identify the perpetrators, and possibly freeze the assets. Otherwise, the threat of a future sale could hamper UPC’s recover for the foreseeable future.
Disclaimer
In adherence to the Trust Project guidelines, BeInCrypto is committed to unbiased, transparent reporting. This news article aims to provide accurate, timely information. However, readers are advised to verify facts independently and consult with a professional before making any decisions based on this content. Please note that our Terms and Conditions, Privacy Policy, and Disclaimers have been updated.

Ethereum (ETH) enters the week with mixed signals as traders brace for tomorrow’s “Liberation Day” tariff announcement, a potential macro catalyst that could impact risk assets. While the BBTrend indicator remains deeply negative, it’s beginning to ease, hinting at a possible slowdown in bearish momentum.
On-chain data shows a slight uptick in whale accumulation, suggesting cautious optimism from large holders. Meanwhile, Ethereum’s EMA setup shows early signs of a trend reversal, but the price still needs to break key resistance levels to confirm a shift in direction.
ETH BBTrend Is Easing, But Still Very Negative
Ethereum’s BBTrend indicator is currently reading -11.66, slightly improved from -12.54 the day before, but still in negative territory for the second consecutive day.
The Bollinger Band Trend (BBTrend) measures the strength and direction of a trend based on how price interacts with the upper and lower Bollinger Bands.
A positive BBTrend suggests bullish momentum, with the price expanding toward the upper band, while a negative BBTrend indicates bearish momentum, with the price leaning toward the lower band. Typically, a value beyond 10 is considered a strong trend signal, making the current -11.66 reading a sign of continued downside pressure.
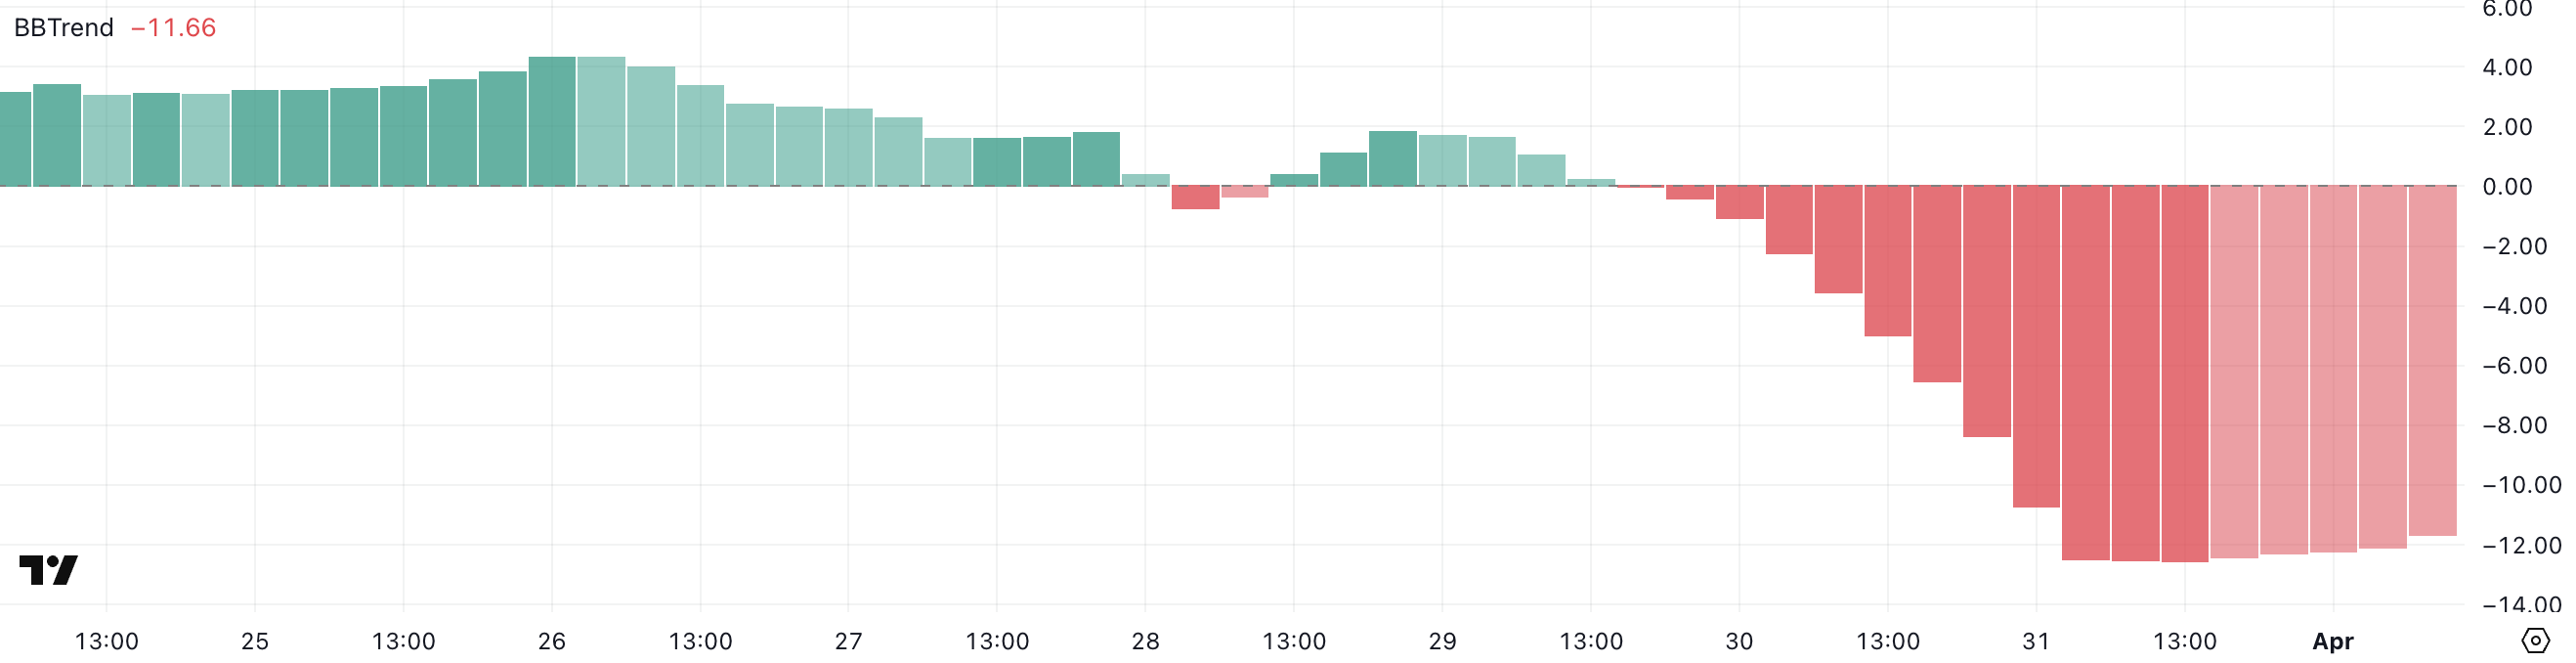
The persistent negative BBTrend suggests that Ethereum remains in a short-term bearish phase, with sellers still dominating the price action.
While yesterday’s slight uptick hints at a potential slowing of downward momentum, the indicator remains well below the neutral zone, meaning any reversal is still unconfirmed, despite Ethereum flipping Solana in DEX trading volume for the first time in 6 months.
Traders may interpret this as a warning to stay cautious, especially if ETH continues hugging the lower Bollinger Band. For now, price action remains fragile, and any bounce will need to be supported by a decisive shift in volume and sentiment to signal a meaningful reversal.
Ethereum Whales Are Accumulating Again
The number of Ethereum whales—wallets holding between 1,000 and 10,000 ETH—has ticked up slightly, rising from 5,322 to 5,330 in the past 24 hours.
While this is a modest increase, whale activity remains one of the most closely watched on-chain metrics, as these large holders often influence market direction. Whales’ accumulation can signal growing confidence in Ethereum’s medium—to long-term prospects, especially during periods of price uncertainty or consolidation.
Conversely, a decline in whale addresses typically suggests weakening conviction or profit-taking.
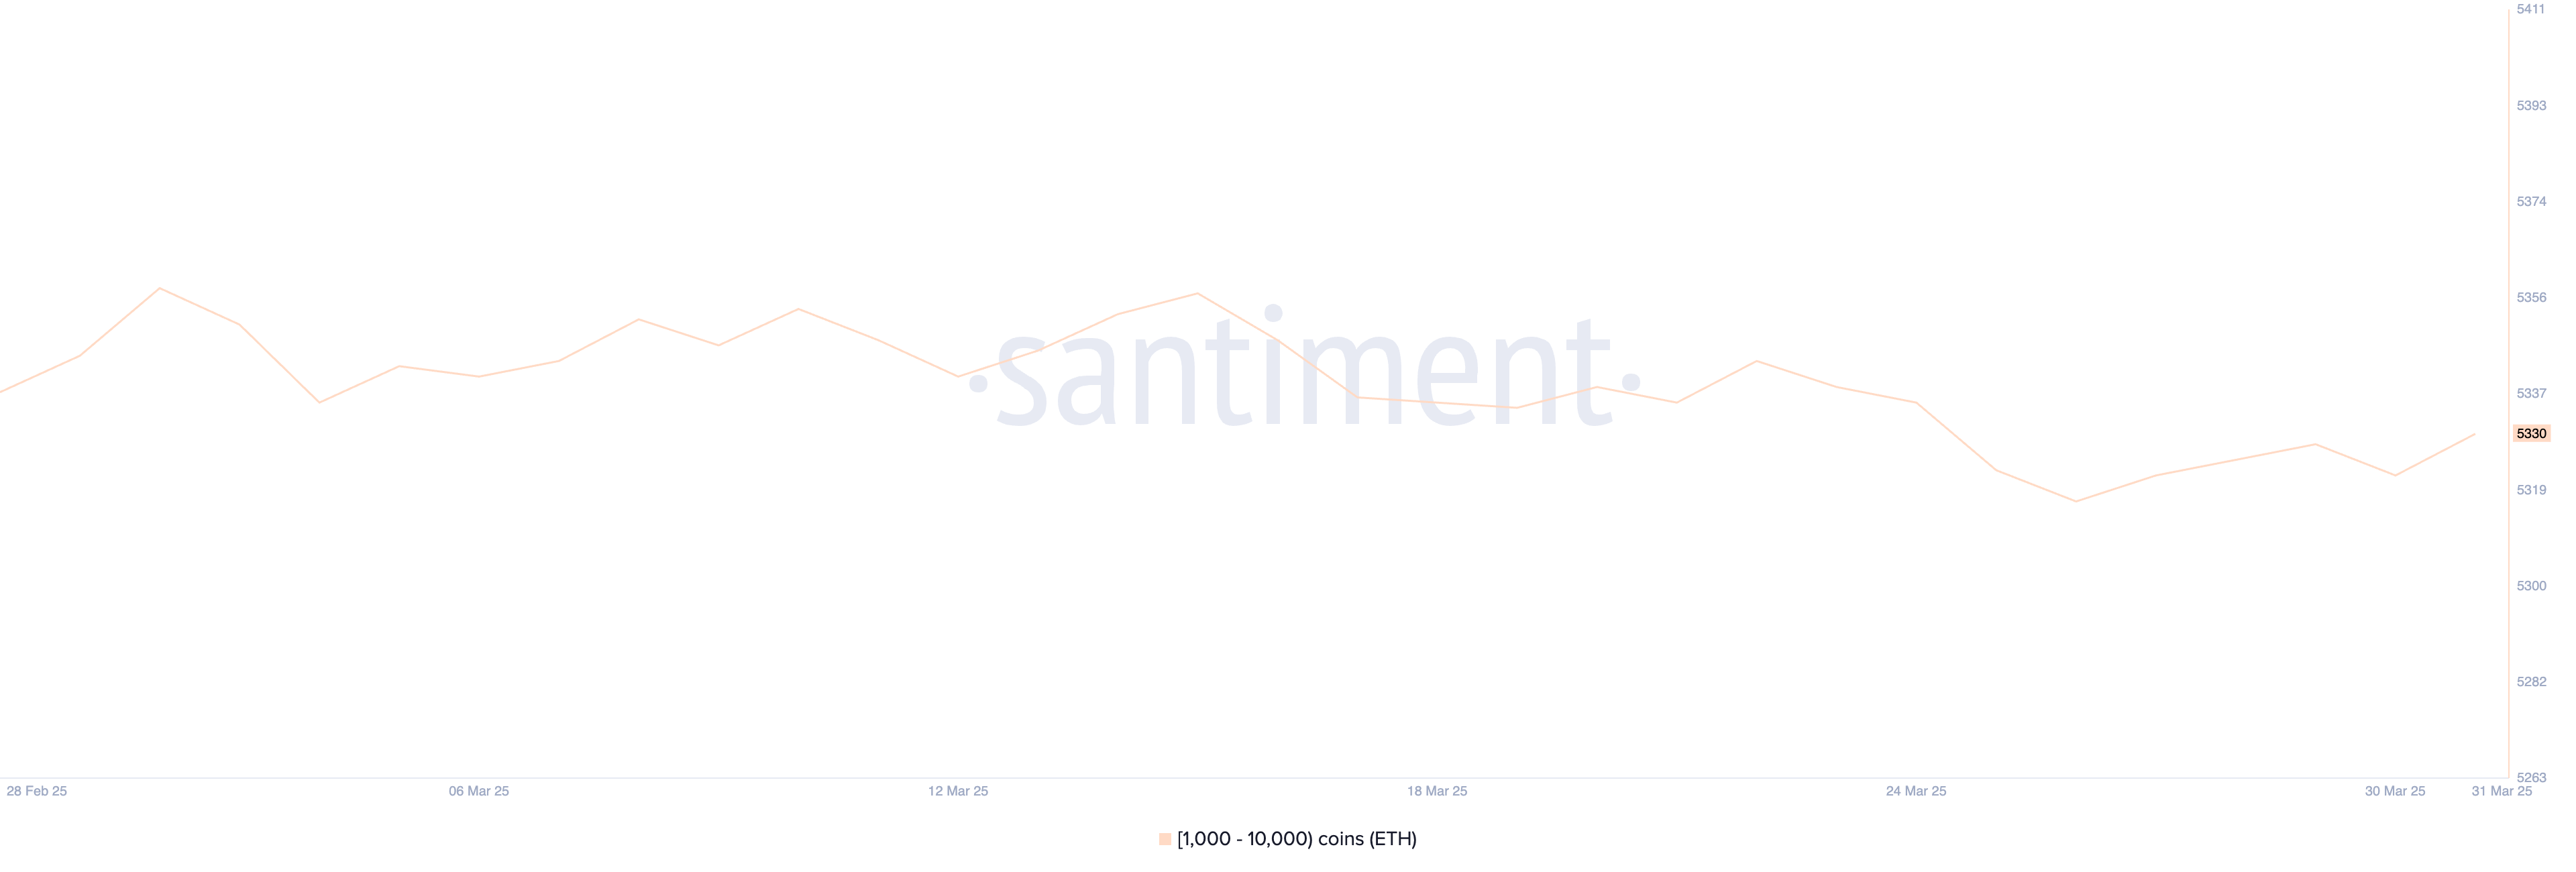
Although the recent uptick is a positive sign, it’s important to note that the current number of Ethereum whales is still below the levels observed in prior weeks.
This means that while some large holders may be re-entering the market, the broader whale cohort has yet to fully commit to an accumulation phase.
If the upward trend in whale numbers continues, it could support a bullish shift in sentiment and price. However, for now, the data points to cautious optimism rather than a decisive reversal.
Will Ethereum Break Above $2,100 Soon?
Ethereum’s EMA lines are showing early signs of a potential trend reversal, with price action attempting to break above key short-term averages.
If Ethereum price can push through the resistance at $1,938, it may signal the start of a broader recovery, potentially targeting the next resistance levels at $2,104, and if momentum builds—especially with supportive macro catalysts—increasing toward $2,320 and even $2,546.
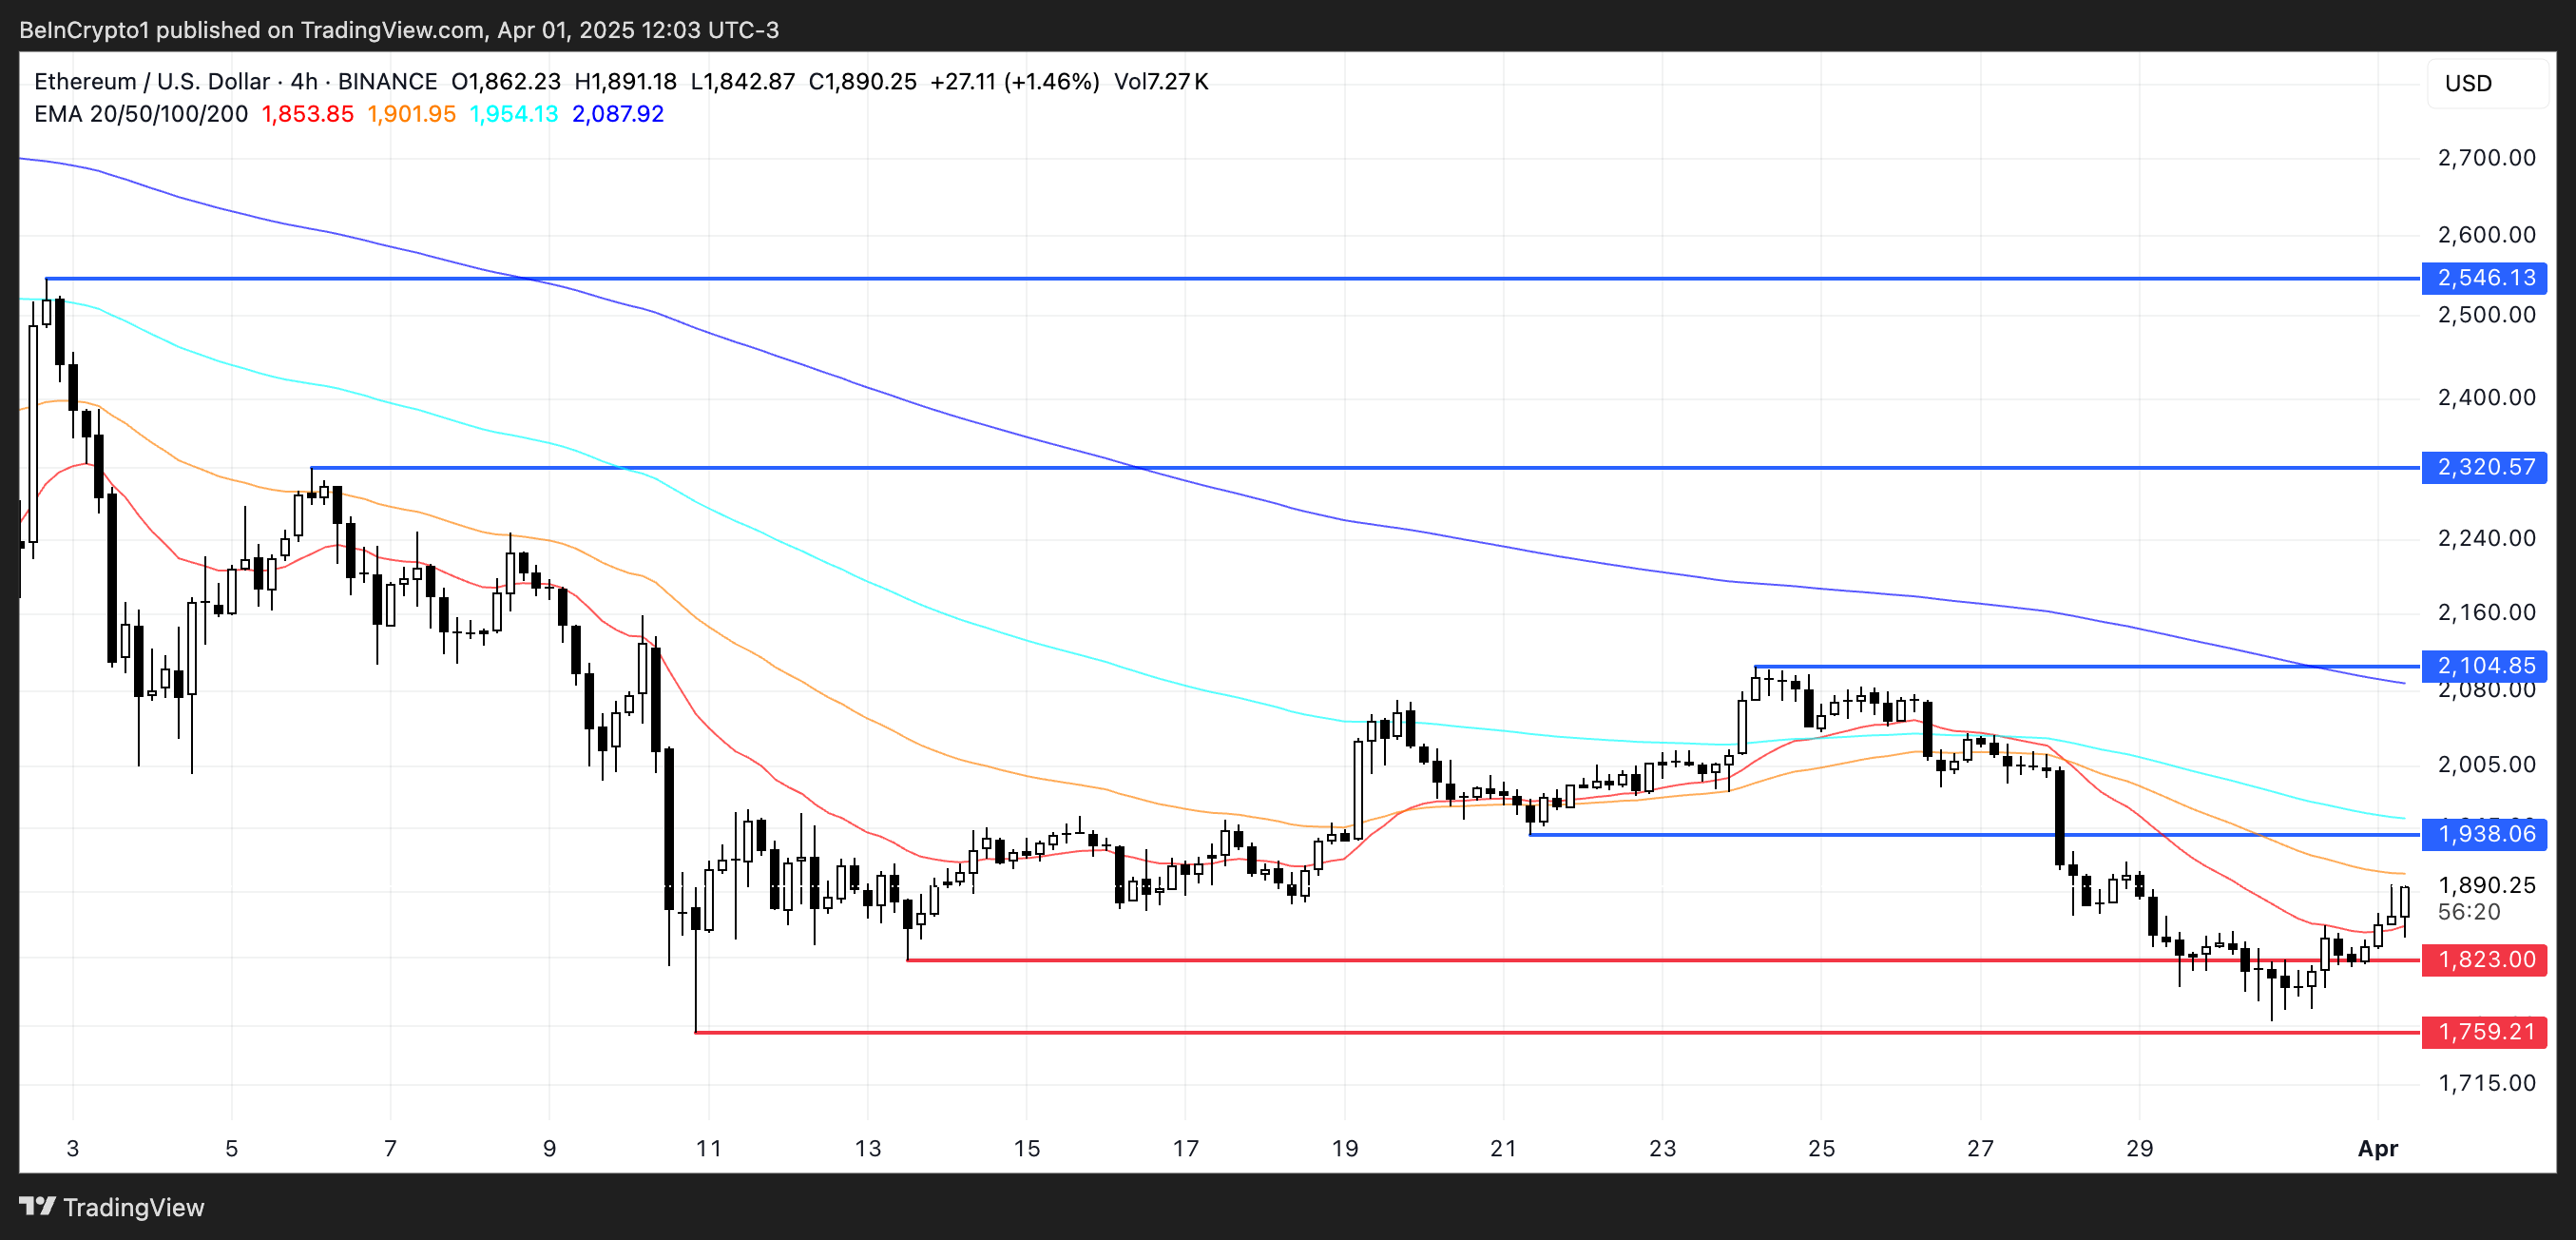
On the flip side, if Ethereum fails to maintain its upward push and bearish momentum resumes, the focus will shift back to downside levels.
The first key support sits at $1,823; a break below that could expose Ethereum to further losses toward $1,759.
Disclaimer
In line with the Trust Project guidelines, this price analysis article is for informational purposes only and should not be considered financial or investment advice. BeInCrypto is committed to accurate, unbiased reporting, but market conditions are subject to change without notice. Always conduct your own research and consult with a professional before making any financial decisions. Please note that our Terms and Conditions, Privacy Policy, and Disclaimers have been updated.

Hill Rejects Interest-Bearing Stablecoins Despite Armstrong’s Wish

How Did UPCX Lose $70 Million in a UPC Hack?

Ethereum Struggles to Break Out as Bear Trend Fades

XRP Price to $27? Expert Predicts Exact Timeline for the Next Massive Surge

Binance Megadrop Launches KernelDAO
Wintermute Sells ACT Tokens Due To Binance Limit Changes


-

 Market23 hours ago
Coinbase Tries to Resume Lawsuit Against the FDIC
-
 Altcoin23 hours ago
Charles Hoskinson Reveals How Cardano Will Boost Bitcoin’s Adoption
-

 Market22 hours ago
Hedera (HBAR) Bears Dominate, HBAR Eyes Key $0.15 Level
-

 Market21 hours ago
This is Why PumpSwap Brings Pump.fun To the Next Level
-

 Market20 hours ago
Cardano (ADA) Whales Hit 2-Year Low as Key Support Retested
-
 Altcoin15 hours ago
A Make or Break Situation As Ripple Crypto Flirts Around $2
-

 Market14 hours ago
XRP Bulls Fight Back—Is a Major Move Coming?
-
 Market13 hours ago
Is CZ’s April Fool’s Joke a Crypto Reality or Just Fun?
 Arabic
 Chinese (Simplified)
 Dutch
Dutch English
 French
 German
 Italian
 Portuguese
 Russian
 Spanish
 Vietnamese