
Market
Can Cardano Overcome Its Struggles as It Lags Behind Solana?

Cardano (ADA) was among the standout performers in the 2021 bull market, but it has struggled to achieve significant price gains in the current cycle.
Normally, such underperformance might lead to a mass sell-off as holders lose confidence. Surprisingly, though, many ADA holders seem to be taking a different approach.
No Giving Up on Cardano, Holders Data Shows
Data from the Balance by Time Held metric shows that the number of long-term Cardano (ADA) holders has hit an all-time high of 3.2 million. These long-term holders are typically those who have held ADA for at least one year.
Historically, holder numbers tend to decline as a bull market peaks. For instance, after ADA’s price soared to $3.10 in September 2021, the number of holders dropped, reflecting profit-taking during the market’s peak.
However, by January 2023, this trend reversed as the number of long-term holders began to increase again, hinting at the early stages of a new bull cycle. Since then, ADA’s price has climbed from $0.26, briefly reaching a peak of $0.70, as these committed holders maintained their positions in anticipation of further growth.
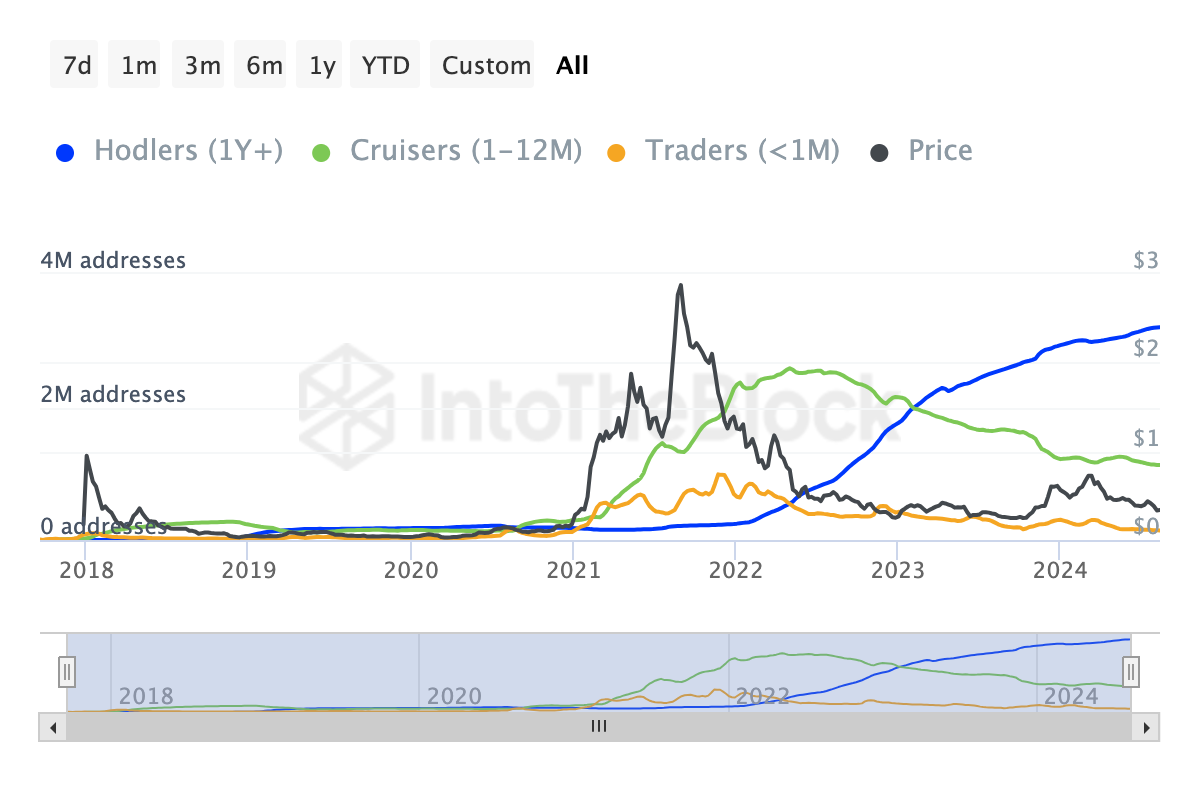
While ADA’s price recently dipped to $0.33, the increase in the number of holders suggests optimism for a potential rebound. However, this cycle has unfolded differently from the last. In 2021, Cardano experienced an explosive rally during altcoin season, but this time, altcoins haven’t delivered the same performance, despite high expectations.
Additionally, Cardano has been trailing behind Solana (SOL) in attracting new users. Both ADA and SOL were standout performers in the previous bull market, but this cycle, Solana has drawn more new market participants.
Despite this initial success, Solana has seen a decline in new, active, and zero-balance addresses over the past month, indicating waning confidence in its short-term prospects.
Read more: How To Stake Cardano (ADA)
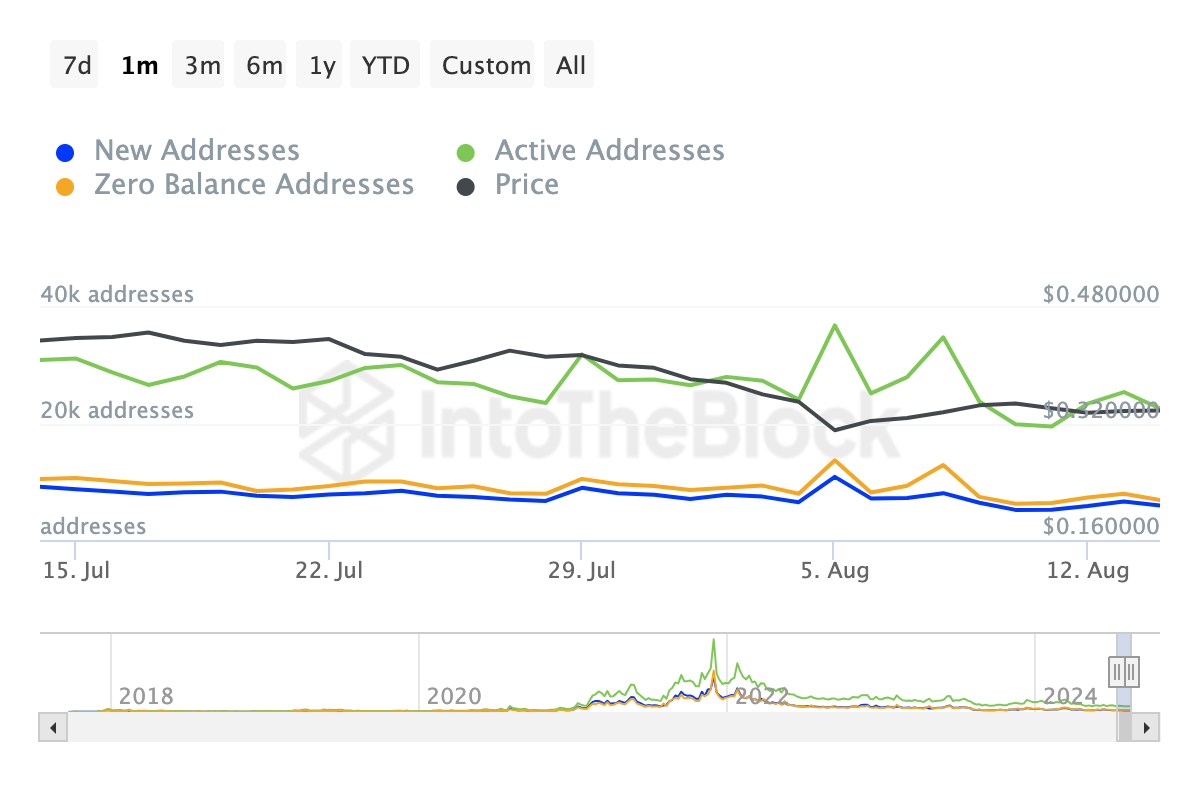
Should the number continue to decline, ADA’s potential recovery could be hindered. However, it is also important to consider other on-chain and technical indicators to evaluate the price forecast.
ADA Price Prediction: Rally Possible, But Not Here Yet
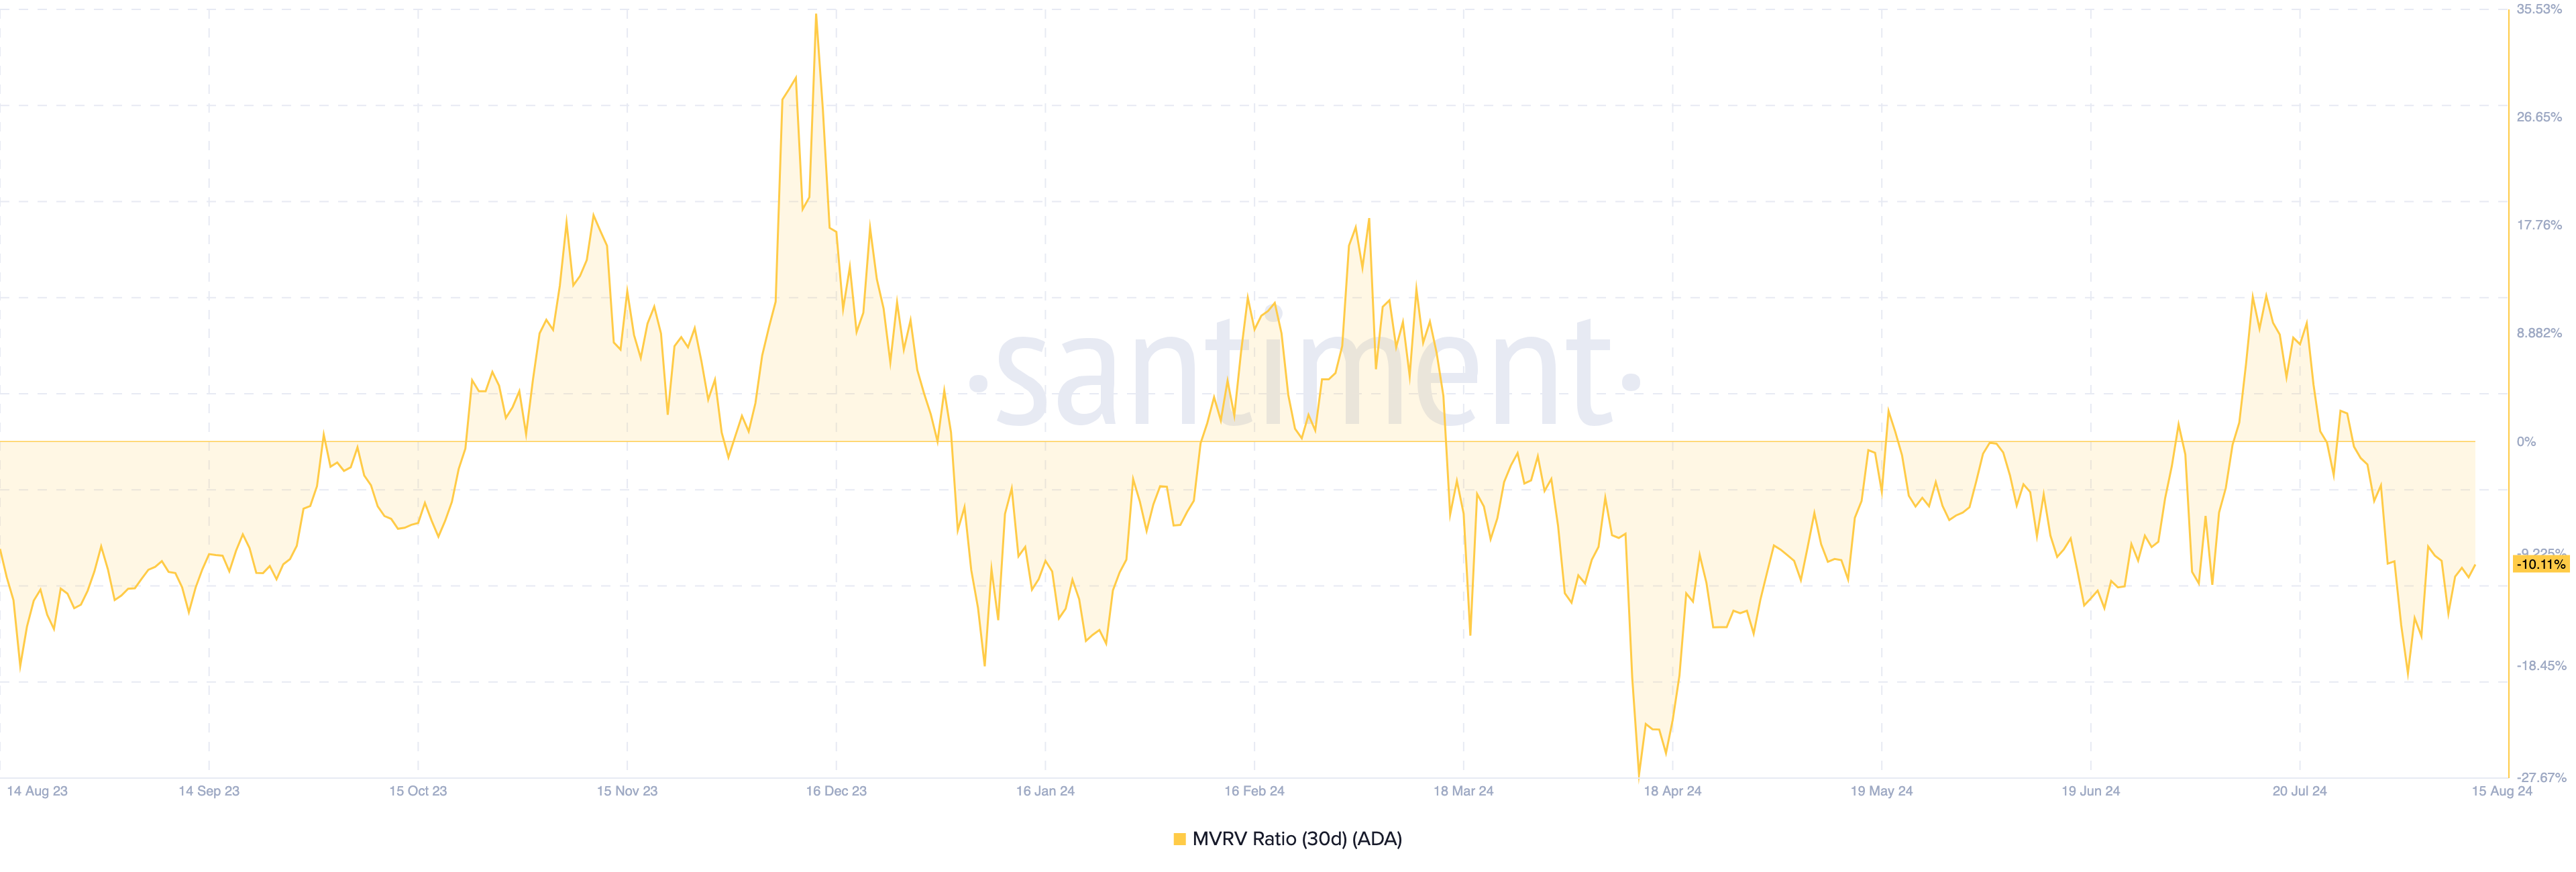
To assess the token’s future potential, BeInCrypto examines the Market Value to Realized Value (MVRV) ratio. This ratio shows the relationship between an asset’s current price and the value at which it was acquired.
The higher the ratio, the more holders are willing to sell due to increased unrealized profits. However, a decrease suggests a rise in unrealized profits. In this instance, holders will be unwilling to sell as they may assume that the token is undervalued.
At press time, ADA’s 30-day MVRV ratio is -10.11%, meaning that if all holders sell at the current price, the average return will be losses. However, due to the conditions mentioned above, this may not happen.
Historically, ADA price bounces when the MVRV ratio is between -7.66% and -27.32 %. Therefore, while the price can still decrease, it is undervalued and could pump later on.
From a short-term perspective, ADA formed a bearish pennant between mid-July and early August. This pattern is characterized by a sharp price drop followed by consolidation within a symmetrical triangle on the daily chart.
While symmetrical triangles can signal either bullish or bearish moves, the Relative Strength Index (RSI) currently sits at 39.55, suggesting that bearish momentum persists. With the RSI below 40, ADA is likely to face continued downward pressure unless market conditions shift in favor of buyers.
If this trend continues in the coming days, ADA’s price may drop to $0.31. However, a surge in buying pressure can change the cryptocurrency’s conditions.
Read more: Cardano (ADA) Price Prediction 2024/2025/2030
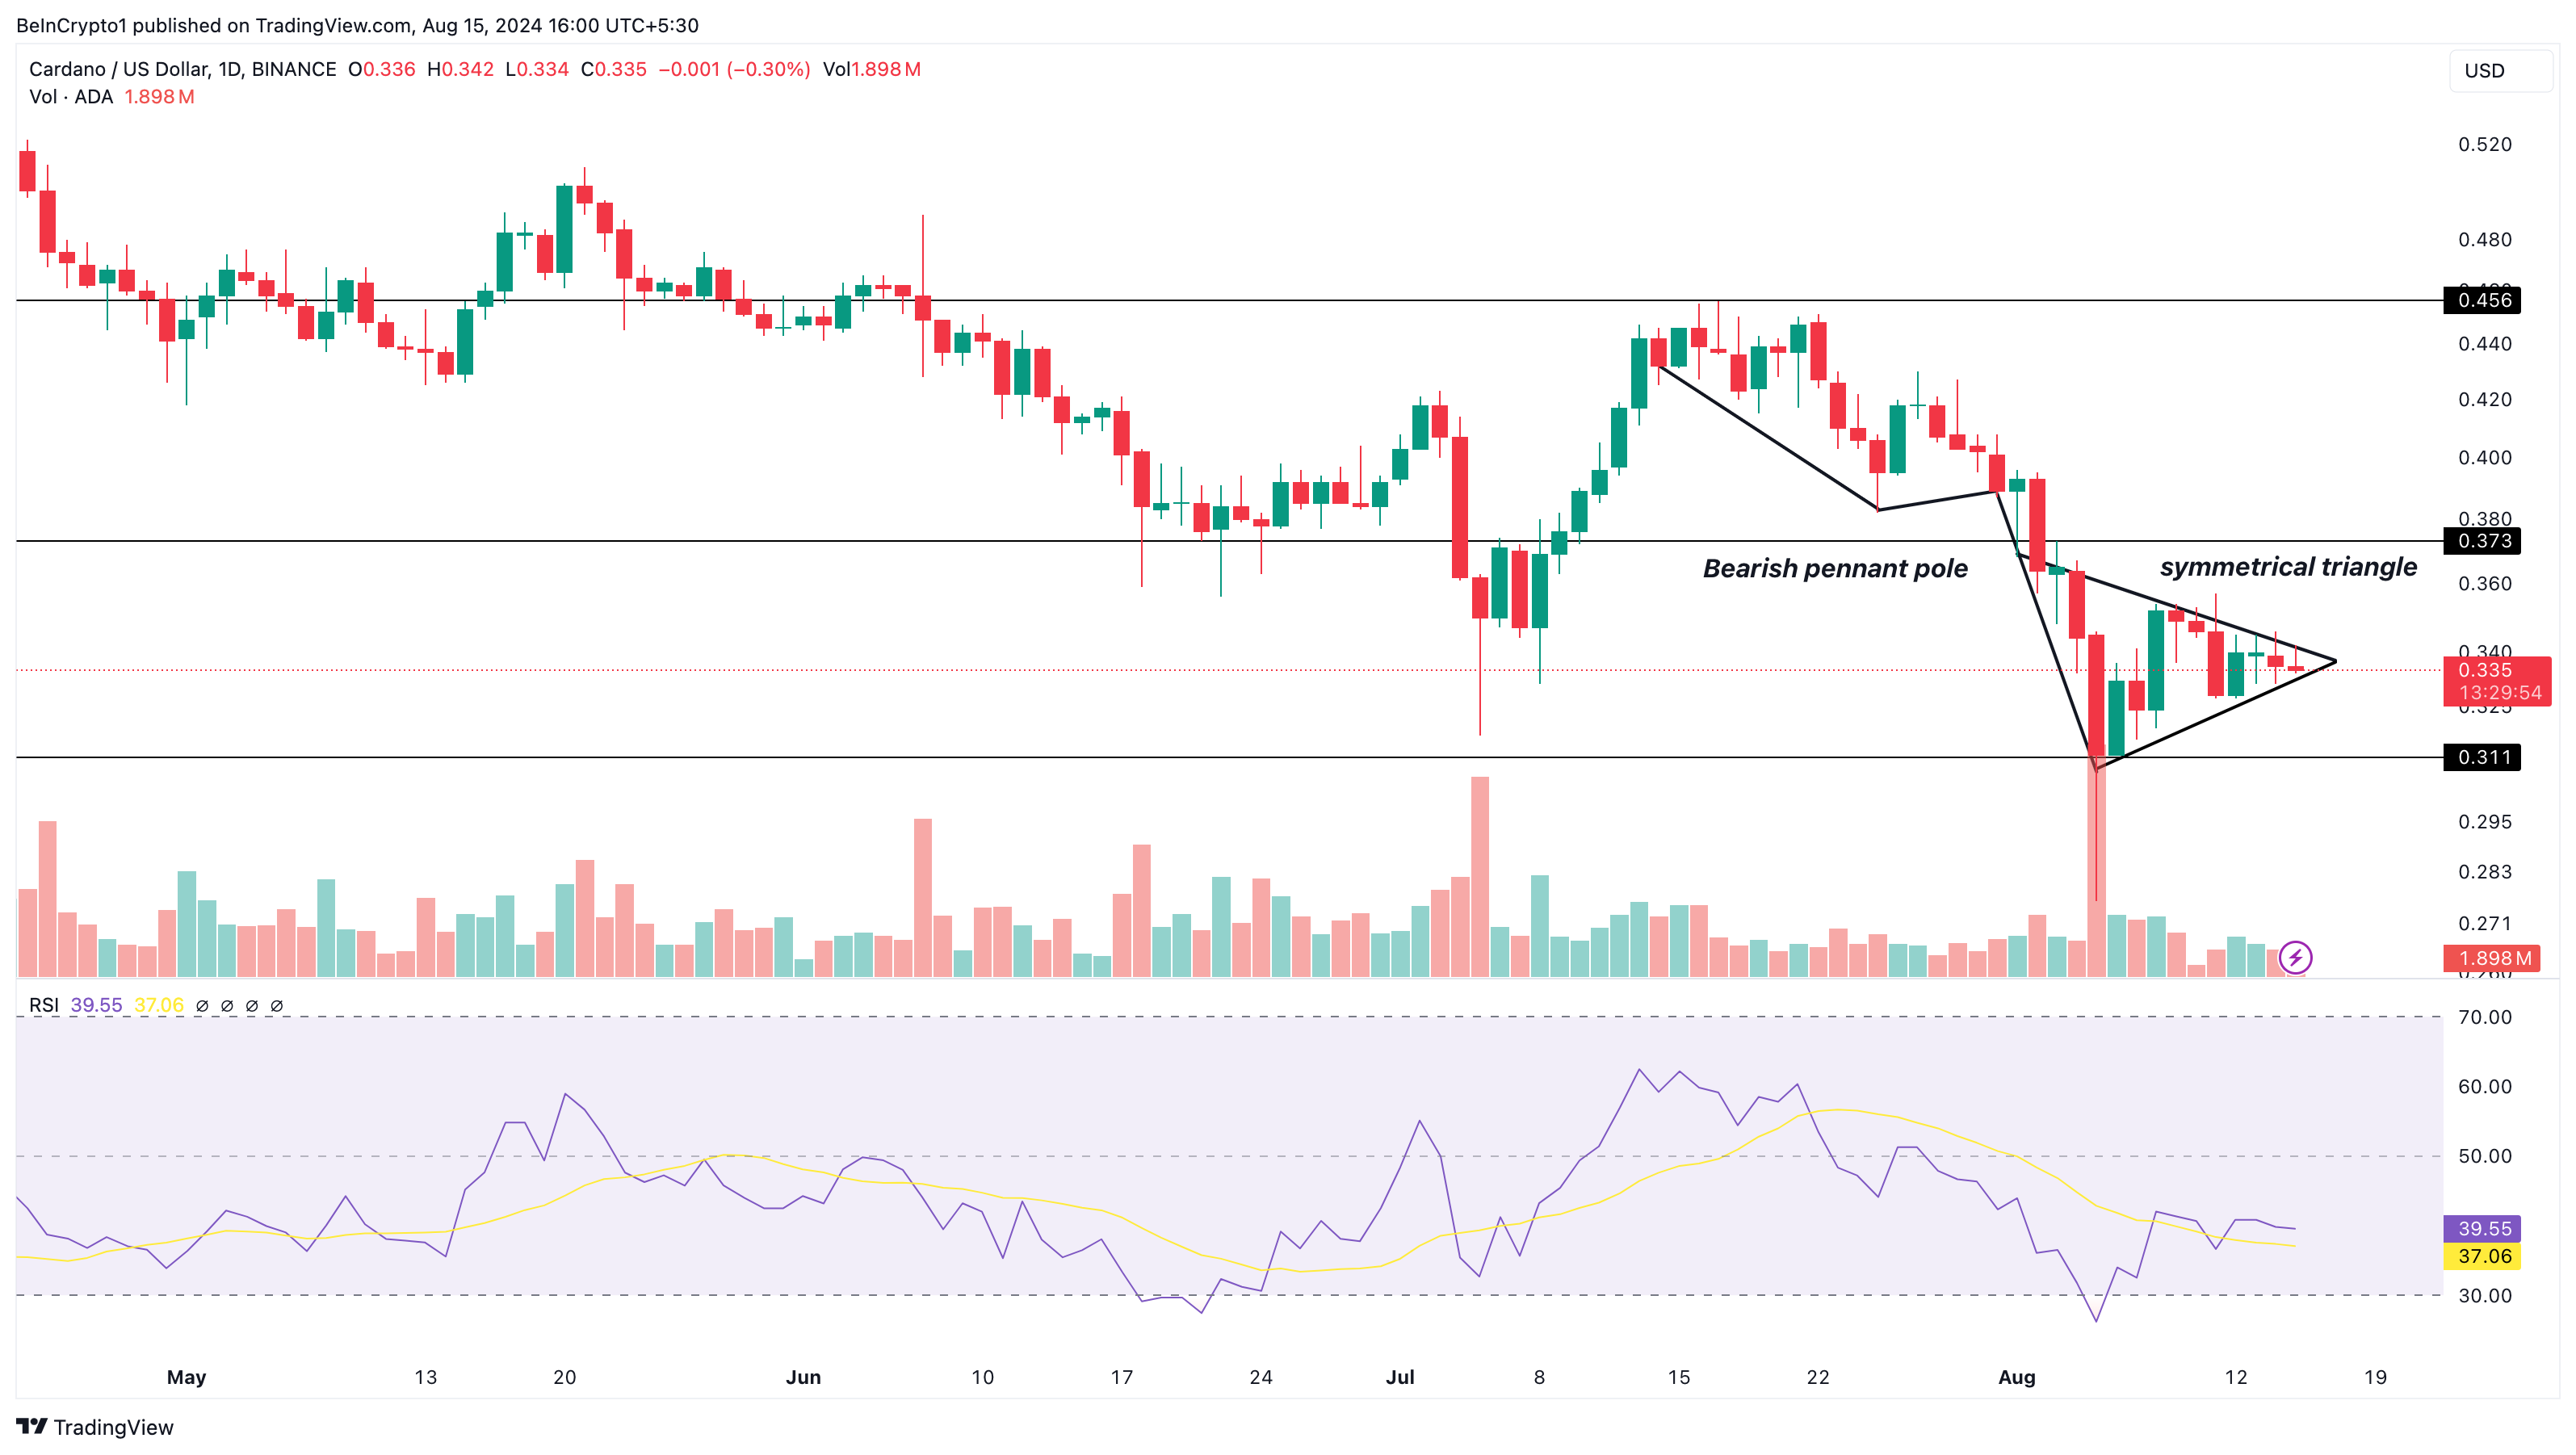
If this happens, ADA’s price may reach $0.37. If accumulation intensifies with high trading volumes, the token could rally further, potentially reaching its recent local high of $0.45.
Disclaimer
In line with the Trust Project guidelines, this price analysis article is for informational purposes only and should not be considered financial or investment advice. BeInCrypto is committed to accurate, unbiased reporting, but market conditions are subject to change without notice. Always conduct your own research and consult with a professional before making any financial decisions. Please note that our Terms and Conditions, Privacy Policy, and Disclaimers have been updated.


Ethereum (ETH) has regained its position as the leading blockchain for decentralized exchange (DEX) trading volume.
On this metric, Ethereum has effectively surpassed Solana (SOL) for the first time since September 2024.
Ethereum Surpasses Solana in DEX Trading Volume
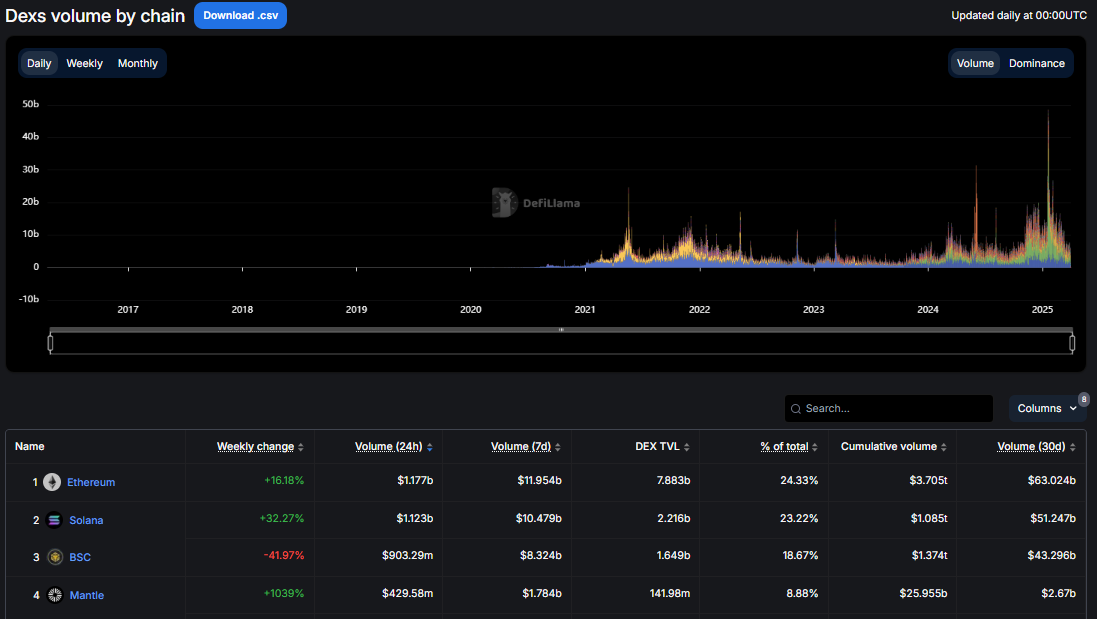
According to data from DefiLlama, Ethereum-based DEXs recorded approximately $63 billion in trading volume throughout March 2025. This traction saw Ethereum overtake Solana’s $51 billion during the same period.
The shift marks a significant moment in the ongoing competition between Ethereum and Solana in the decentralized finance (DeFi) ecosystem.
Solana had dominated the DEX space for months, bolstered by its low fees and high transaction throughput. Franklin Templeton noticed the trend and predicted Solana’s DeFi surge could rival Ethereum’s valuation.
“Solana DeFi valuation multiples trade on average lower than their Ethereum counterparts despite significantly higher growth profiles. This highlights an apparent valuation asymmetry between the two ecosystems,” read an excerpt in Franklin Templeton’s report.
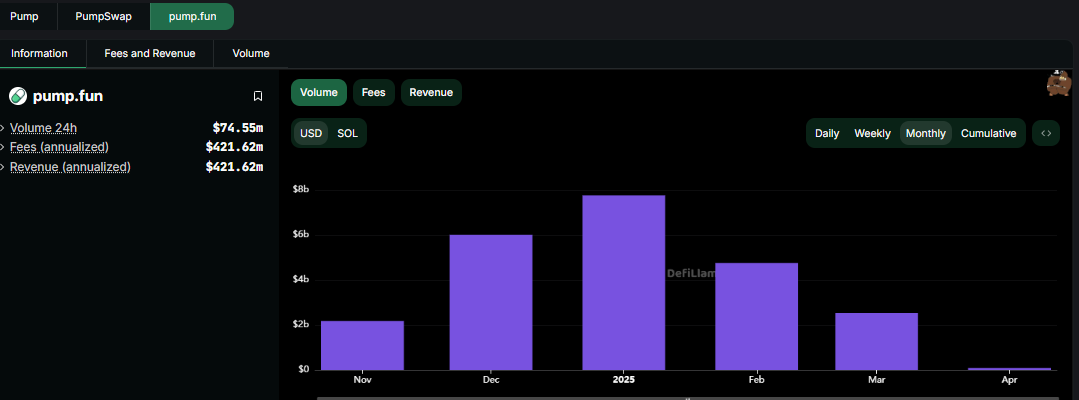
However, recent declines in trading volume on key Solana-based platforms suggest a changing market dynamic. The drop in Solana’s DEX trading volume is closely tied to decreased activity on major platforms like Raydium (RAY) and Pump.fun.
Pump.fun, in particular, has seen a sharp decline in trading volume since the beginning of the year. Monthly volumes fell from a January peak of $7.75 billion to just $2.53 billion in March, representing a 67% drop.
Data on Dune shows that this downturn aligns with a slowdown in the platform’s token graduation rate, which has fallen from 0.8% to 0.65% per week.
The graduation rate reflects the percentage of new tokens reaching the $100,000 market capitalization threshold required to migrate from Pump.fun to the Raydium platform.
A lower graduation rate suggests fewer tokens are reaching this threshold, which is reducing overall trading activity on Solana’s DEX ecosystem.
Ethereum’s Strength in the DEX Market
While Solana’s DEX activity has faltered, Ethereum’s trading volume has remained resilient. This is likely bolstered by the strong performance of platforms like Uniswap (UNI) and Curve Finance (CRV).
In March, Uniswap alone facilitated over $30 billion in trading volume, significantly contributing to Ethereum’s overall market dominance.
Ethereum’s ability to reclaim the top spot is also attributed to its established infrastructure and network effects. Despite higher gas fees than Solana, Ethereum continues attracting high-value trades, institutional interest, and liquidity. These reinforce its position as the primary blockchain for DeFi activity.
Against this backdrop, industry analysts believe that while Solana is very competitive, it still has a long way to go before it can dethrone Ethereum.
Meanwhile, others say Ethereum’s resurgence may extend into the second quarter (Q2), driven by upcoming network upgrades and broader market trends.
“On-chain developments offer some hope for ETH…With Pectra now successfully deployed on the Holesky testnet and a mainnet upgrade expected in Q2, could we see a reversal of the downward ETH/BTC trend in the coming quarter?” analysts at QCP Capital noted.
The Pectra upgrade, once implemented on the Ethereum mainnet, is expected to improve scalability and efficiency, potentially boosting user adoption and trading activity.
Adding to the positive momentum, spot Ethereum ETFs (exchange-traded funds) saw net inflows on Monday, contrasting with net outflows from Bitcoin ETFs. This trend suggests growing investor confidence in Ethereum’s market position.
This shift in ETF flows could indicate a broader reallocation of capital within the crypto market, particularly as Ethereum strengthens its DeFi ecosystem and prepares for key upgrades.
Disclaimer
In adherence to the Trust Project guidelines, BeInCrypto is committed to unbiased, transparent reporting. This news article aims to provide accurate, timely information. However, readers are advised to verify facts independently and consult with a professional before making any decisions based on this content. Please note that our Terms and Conditions, Privacy Policy, and Disclaimers have been updated.

Coinbase, the largest US crypto exchange, has recorded its worst quarter since the dramatic collapse of FTX in late 2022.
Coinbase’s stock (COIN) plummeted by 30% in Q1 2025, mirroring the steep losses seen across the broader crypto market.
Crypto Stocks and Assets Bleed Red in Q1
According to Bloomberg, the sharp decline has hit several other major crypto-related stocks as well. This includes Galaxy Digital, Riot Blockchain, and Core Scientific, all of which have experienced significant downturns.
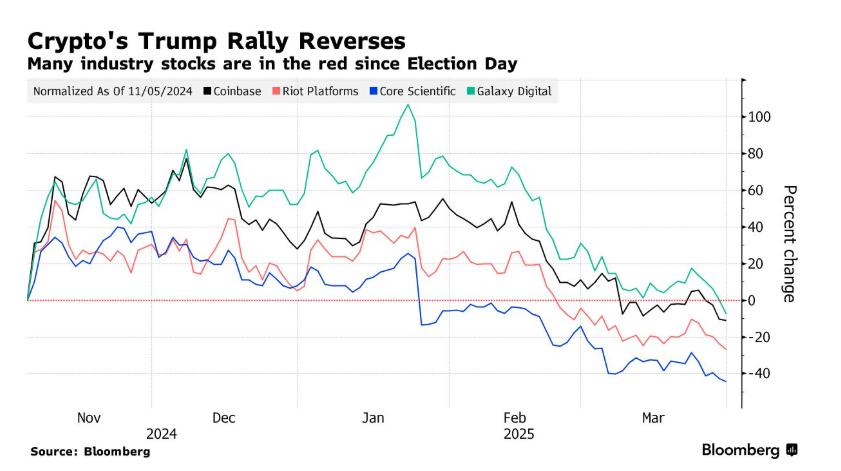
Furthermore, the broader crypto market is facing tough times. Bitcoin, which has long been considered the bellwether of digital assets, has dropped by 10% this quarter. More dramatically, Ethereum (ETH) has seen a staggering 45% decline. These losses reflect a broader downturn in the crypto market, fueled by several macroeconomic factors.
Analysts point to the global uncertainty surrounding the US economy, including concerns over Trump’s tariffs and recession fears. This has resulted in a general “risk-off” mood among investors.
“In a risk-off mood, no asset is safe stocks, crypto, all get hit. It’s more about sentiment than fundamentals in those moments,” an investor commented on X.
While some point to these macroeconomic pressures as the primary cause, others argue that the market’s underperformance is more due to lingering fears of trade wars and broader geopolitical instability.
“Trump’s trade wars are driving markets into a panic. As much as he is doing for crypto, the macro market conditions are speaking louder – as bullish as the news is from the white house – His trash trade war is squelching any price surge,” another X user remarked.
Coinbase has been hit especially hard in this downturn. Coinbase’s revenue model is heavily reliant on altcoins and transaction volumes beyond Bitcoin. Hence, the overall market drop could have made a mark on the exchange’s stock prices. Moreover, the news comes as Coinbase users have collectively lost more than $46 million to scams in March.
While crypto has been in a freefall, other assets have fared much better. Gold, for example, has surged, posting its best quarter since 1986 as investors flock to safer assets amid the market turmoil. The shift toward traditional assets is particularly noticeable as the post-election crypto hype, which briefly boosted Bitcoin’s value to $109,000, begins to fade.
Despite the overall market challenges, some crypto-related firms have shown resilience. MicroStrategy, led by CEO Michael Saylor, remains in the green year-to-date, bolstered by its substantial Bitcoin holdings.
For now, the crypto market is left to weather the storm, with analysts continuing to scrutinize the interplay of macroeconomic factors and its impact on digital assets.
Disclaimer
In adherence to the Trust Project guidelines, BeInCrypto is committed to unbiased, transparent reporting. This news article aims to provide accurate, timely information. However, readers are advised to verify facts independently and consult with a professional before making any decisions based on this content. Please note that our Terms and Conditions, Privacy Policy, and Disclaimers have been updated.

Crypto scams are surging as more people flock to digital currencies, with fraudsters exploiting the industry’s rapid growth to deceive investors.
Recently, numerous crypto users reported receiving fraudulent emails claiming that the Gemini exchange had filed for bankruptcy. Meanwhile, Coinbase Exchange has admitted that an employee illegally accessed user account information.
Gemini Exchange Addresses Bankruptcy Allegations
Multiple accounts highlighted the scam on social media, indicating that an email circulating falsely claims that Gemini has filed for bankruptcy. The email instructed users to withdraw to an Exodus wallet and provided a seed phrase.
These phishing emails, shared on April 1, urged recipients to withdraw their funds into a specified crypto wallet to protect their assets. This was an attempt to deceive users into transferring their cryptocurrencies to wallets controlled by scammers.
“Do not follow these directions. Please retweet to protect those that may have been doxxed and sent this email,” wrote Jason Williams, a contributor to Fox Business.
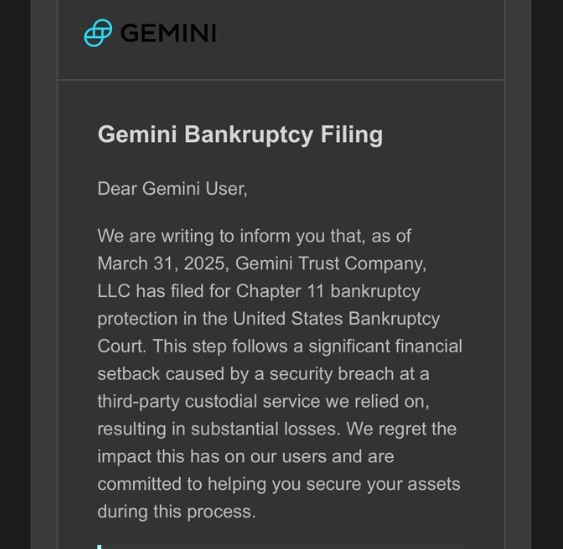
The deceptive emails alleged a substantial loss of $1.2 billion by Gemini Exchange. Understandably, some novice investors would heed this email and even move their assets to the address. After all, some victims of FTX Exchange contagion continue to pursue their funds even years after the incident.
“I got one also. It is better than your typical ‘Coin Base’ one, but still not quite there. Might fool a boomer though,” one X user remarked.
However, security experts advise users to always verify information through official channels, avoid clicking on unsolicited links, and refrain from sharing personal data. Gemini issued an official warning in response to the scam, acknowledging the threat against its users.
“We recently learned that some Gemini customers are being targeted with scam emails requesting users to transfer their crypto to outside wallets. Please be aware that Gemini will never request that you send crypto to outside wallets,” the exchange articulated.
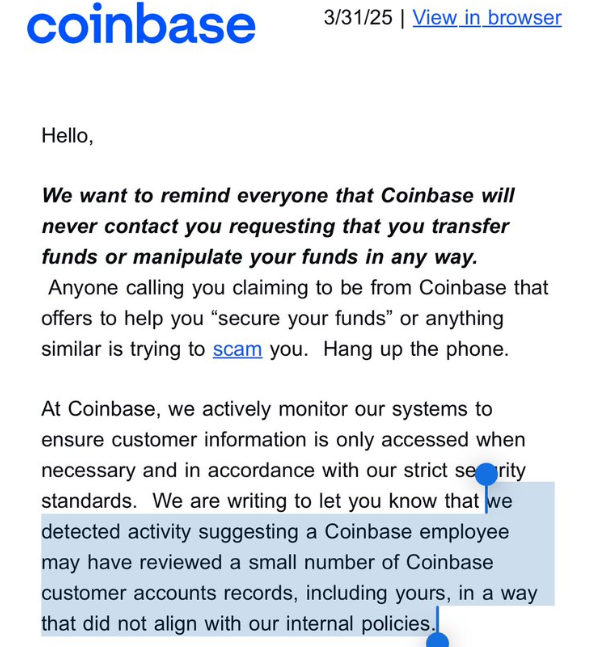
Coinbase Admits Employee Illegally Accessed User Account Data
Coinbase exchange acknowledged a privacy violation by one of its staff in a somewhat related development. Specifically, a customer service employee accessed user account information without authorization.
This breach has raised concerns about potential scams targeting Coinbase users. Mike Dudas, a crypto investor and co-founder at The Block, shared an email from Coinbase acknowledging the incident.
“That explains the fake Coinbase phishing emails and phone calls today,” he stated.
This breach coincides with reports of phishing attempts, as users have received fake emails and calls purporting to be from Coinbase. These incidents reflect a broader wave of crypto-related fraud.
Blockchain investigator ZachXBT reported that Coinbase users lost over $65 million to social engineering scams between December 2024 and January 2025.
“Coinbase did not detect it; I sent them the intel,” the blockchain investigated noted.
Additionally, crypto analyst Cobie suggested Kraken might be experiencing a similar issue. Per his post, a new attack may be budding, where attackers infiltrate customer service roles to exfiltrate data.
“Kraken also recently hit with this too. Maybe a new scheme from attackers (get a CS agent employee in, exfil data),” the analyst remarked.
Amidst these events, ZachXBT recently explained how to avoid crypto scams. He emphasizes the importance of conducting thorough research before engaging with new DeFi protocols, especially those forked from existing projects on newly launched EVM chains.
Additionally, he advises caution when dealing with projects with few credible followers, as these may indicate potential scams.
Therefore, it is imperative that users remain vigilant against sophisticated phishing scams and unauthorized data breaches.
Disclaimer
In adherence to the Trust Project guidelines, BeInCrypto is committed to unbiased, transparent reporting. This news article aims to provide accurate, timely information. However, readers are advised to verify facts independently and consult with a professional before making any decisions based on this content. Please note that our Terms and Conditions, Privacy Policy, and Disclaimers have been updated.

Will XRP, SOL, ADA Make the List?

Ethereum Reclaims Top DeFi Spot As Solana DEX Volume Drops

Coinbase Stock Plunges 30% in Worst Quarter Since FTX Collapse

$500 Trillion Bitcoin? Saylor’s Bold Prediction Shakes the Market!

Fake Gemini Bankruptcy Emails Target Users

Big Bitcoin Buy Coming? Saylor Drops a Hint as Strategy Shifts

2.52 Million Altcoins Are Ruining Crypto’s Future

Animoca Brands Valuation Tanks 75% In Two Years, Here’s Why

Crypto exchange BingX hacked for $43 million

Are The Big Players Losing Interest?

Hong Kong’s Securities Association Tips Authorities On Crypto Self-Regulation

Coinbase cbBTC Set to go Live on Solana
2.52 Million Altcoins Are Ruining Crypto’s Future
Animoca Brands Valuation Tanks 75% In Two Years, Here’s Why
Crypto exchange BingX hacked for $43 million
Are The Big Players Losing Interest?
Hong Kong’s Securities Association Tips Authorities On Crypto Self-Regulation
Coinbase cbBTC Set to go Live on Solana
-

 Ethereum20 hours ago
Ethereum’s Price Dips, But Investors Seize The Opportunity To Stack Up More ETH
-
 Market20 hours ago
Trump Family Gets Most WLFI Revenue, Causing Corruption Fears
-

 Market23 hours ago
Bitcoin Mining Faces Tariff Challenges as Hashrate Hits New ATH
-
 Regulation23 hours ago
USDC Issuer Circle Set To File IPO In April, Here’s All
-

 Market22 hours ago
Pi Network Struggles, On Track for New All-Time Low
-
 Bitcoin22 hours ago
Strategy Adds 22,048 BTC for Nearly $2 Billion
-

 Market21 hours ago
BNB Breaks Below $605 As Bullish Momentum Fades – What’s Next?
-

 Market17 hours ago
BlackRock’s Larry Fink Thinks Crypto Could Harm The Dollar