
Market
Can BNB Outshine Bitcoin (BTC) This May?

BNB, the native crypto of the Binance exchange, maintains a strong position at the $600 level, indicating potential bullish momentum.
Whether BNB will reach a new all-time high soon depends on market sentiment and broader cryptocurrency trends. Positive technical indicators and a favorable market could propel BNB to new heights, but the cryptocurrency market is known for its volatility.
BNB Strong Recovery: A Look at This Month’s Surge
The BNB price has notably recovered this month, following a previous decline of approximately 20%. This month’s increase is around 13%, indicating a resurgence in bullish sentiment.
The Moving Average Convergence/Divergence Indicator (MACD) histogram has demonstrated a consistent upward trend over several months, accompanied by the bullish crossover of the MACD lines. Additionally, the Relative Strength Index (RSI) is approaching overbought levels, suggesting heightened buying pressure.
Currently, BNB faces resistance at the Golden Ratio level around $590. A successful bullish breakout could propel BNB towards the recent high near $645 and potentially even surpass its all-time high at approximately $692.
Read More: BNB: A Comprehensive Guide to What It Is and How It Works
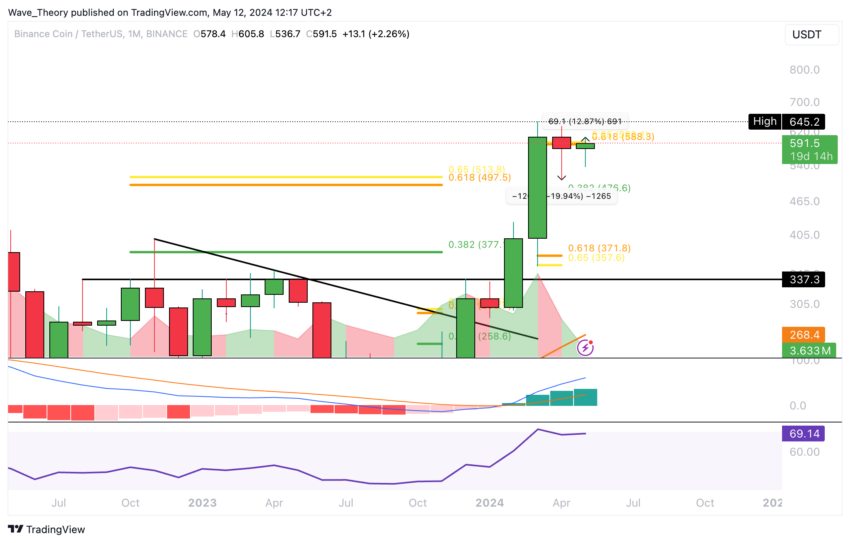
Crucial support levels lie at the Fibonacci levels, around $477 and $370. If BNB remains above the golden ratio support at $370, the bullish momentum will likely persist in the medium term.
Analyzing BNB: Bearish MACD on the Weekly Chart Points to Risks
The MACD histogram has shown a downward trend in the weekly chart for several weeks. This suggests that the MACD lines may imminently cross in a bearish manner. Nonetheless, the RSI does not indicate either bullish or bearish signals.
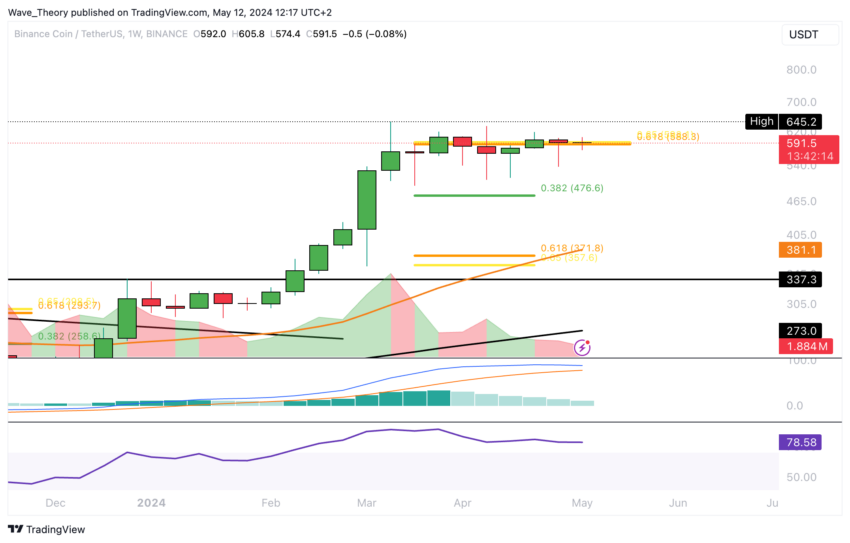
Should BNB not surpass the golden ratio resistance near $590, it will find additional support at the 50-week EMA, approximately $380. Before this, substantial Fibonacci support was positioned at around $477.
BNB Price Analysis: Stuck in a Sideways Trend for 2 Months
The Binance Coin price forms an ascending triangle as it consistently reaches higher lows and repeatedly encounters resistance at the same price level. This pattern is generally considered bullish and may soon lead to a bullish breakout.
The 50-day EMA, situated at approximately $566, is also significant support. Over the past two months, the 50-day EMA has successfully acted as support on multiple occasions, as evidenced by the BNB price rebounding from this level.
Furthermore, the indicators present predominantly bullish signals. The EMAs continue to display a golden crossover, affirming a bullish trend in the short to medium term.
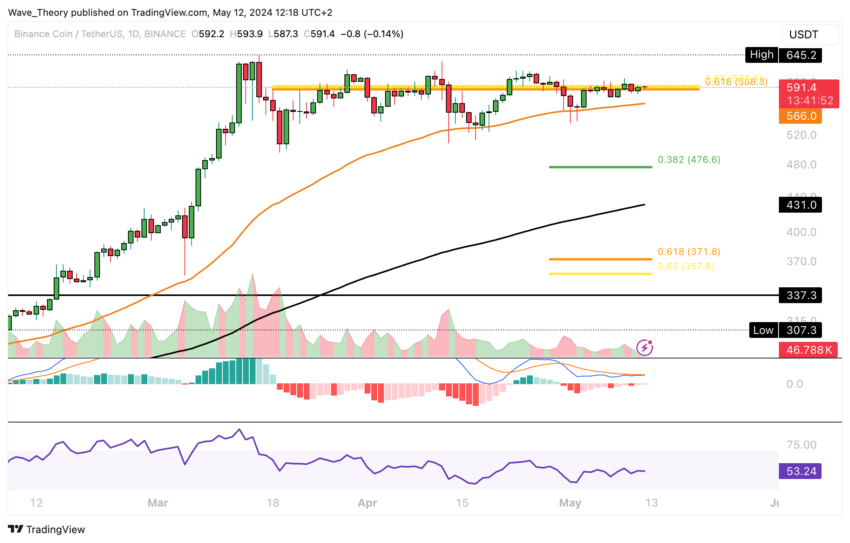
The RSI remains neutral, and the MACD lines are poised to cross bullishly, supported by the MACD histogram, which has shown bullish momentum since yesterday.
Bullish Indicators Emerge in 4H Analysis
A golden crossover in the 4-hour chart also corroborates the short-term bullish trend. Although the MACD lines have crossed bearishly, the MACD histogram is currently ticking upward bullishly.
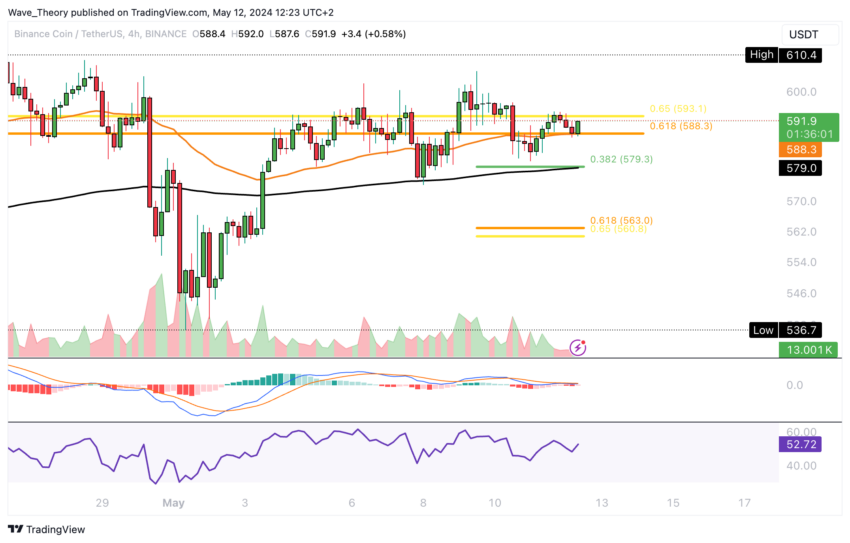
Meanwhile, the RSI remains in neutral territory. Should BNB experience a short-term correction, significant Fibonacci support levels are expected at approximately $579 and $563.
BNB vs. BTC: Analyzing Three Months of Uptrend
The BNB price has been trending upwards against Bitcoin for the past three months, having already breached the 50-month EMA resistance at approximately 0.007984 BTC.
The next notable Fibonacci resistance levels are set at around 0.01077 BTC and around 0.00145 BTC. The overall indicators appear bullish.
Read More: BNB Price Prediction 2024/2025/2030
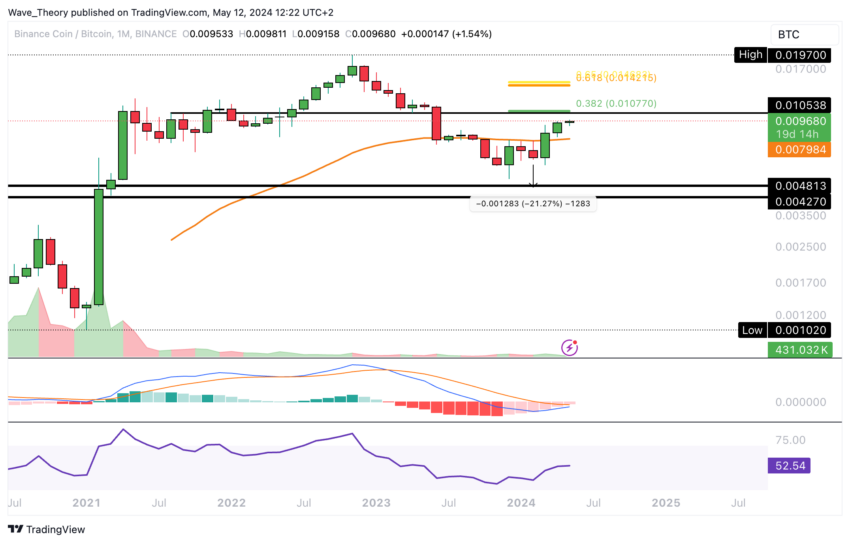
The histogram of the MACD is trending upward, suggesting that the MACD lines may soon intersect in a bullish configuration. The RSI remains neutral, providing neither bullish nor bearish signals.
Disclaimer
In line with the Trust Project guidelines, this price analysis article is for informational purposes only and should not be considered financial or investment advice. BeInCrypto is committed to accurate, unbiased reporting, but market conditions are subject to change without notice. Always conduct your own research and consult with a professional before making any financial decisions. Please note that our Terms and Conditions, Privacy Policy, and Disclaimers have been updated.


Reason to trust
![]()
Strict editorial policy that focuses on accuracy, relevance, and impartiality
Created by industry experts and meticulously reviewed
The highest standards in reporting and publishing
Strict editorial policy that focuses on accuracy, relevance, and impartiality
Morbi pretium leo et nisl aliquam mollis. Quisque arcu lorem, ultricies quis pellentesque nec, ullamcorper eu odio.
XRP is still in consolidation mode after hitting a new seven-year high in January 2025. This consolidation has seen the price drop slowly, but steadily, losing around 40% of its value since then. Currently, bulls seem to have created support for the altcoin at $2, as this level continues to hold even through crashes. Thus, it has created the expectation that the bottom could be close for the XRP price, and this could serve as a bounce-off point.
XRP Price Consolidation Could Be Over Soon
Taking to X (formerly Twitter), crypto analyst Dark Defender revealed that the consolidation that the XRP Price has been stuck in for months now is coming to an end. The analyst used the monthly chart for the analysis, calling out an end and a bottom for the XRP price. According to him, this is actually the “Final Consolidation” for XRP, suggesting that this is where a breakout would start from.
Related Reading
With the consolidation expected to come to an end soon, the crypto analyst highlights what could be next for the altcoin using the 5-Wave analysis. Now, in total, these five waves are still very bullish for the price and could end up marking a new all-time high.
For the first wave, Dark Defender calls it the Impulsive Wave 1, which is expected to begin the uptrend. This first wave is expected to push the price back to $3 before the second wave starts, and this second wave is bearish.
The second wave would trigger a crash from $3 back toward $2.2, providing the setup for the third wave. Once the third wave begins, this is where the crypto analyst expects the XRP price to hit a new all-time high. The target for Wave 3 puts the XRP price as high as $5, clearing the 2017 all-time high of $3.8.
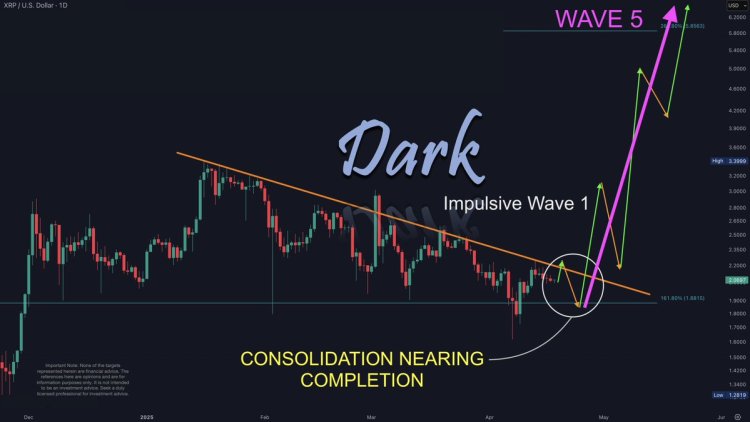
Next in line is the fourth wave, which is another bearish wave. This wave will cause at least a 30% crash, according to the chart shared by the crypto analyst, taking it back toward the $3 territory once again. However, just like the second bearish wave, the fourth bearish wave is expected to set up the price for a final and more explosive Wave 5.
Related Reading
Once the fifth wave is in action, a brand-new all-time high is expected to happen, with the price rising over 100% from the bottom of the fourth wave. The target for this, as shown in the chart, is over $6.
As for the crypto analyst, the major targets highlighted during this wave action are $3.75 and $58.85. Then, for major supports and resistances, supports are $1.88 and $1.63, while resistances lie at $2.22 and $2.30.
Featured image from Dall.E, chart from TradingView.com

Reason to trust
![]()
Strict editorial policy that focuses on accuracy, relevance, and impartiality
Created by industry experts and meticulously reviewed
The highest standards in reporting and publishing
Strict editorial policy that focuses on accuracy, relevance, and impartiality
Morbi pretium leo et nisl aliquam mollis. Quisque arcu lorem, ultricies quis pellentesque nec, ullamcorper eu odio.
XRP has been trading under pressure in recent weeks, losing much of the momentum it built during its late 2024 to early 2025 rally. After reaching highs above $3.40, the asset has experienced an 18.3% decline over the past month, reflecting broader market softness.
At the time of writing, XRP trades significantly below its peak at a price of $2.06, with subdued investor activity and falling market participation across both spot and derivatives markets.
Related Reading
XRP On-Chain Activity Slows, But Price Remains Relatively Stable
Amid XRP’s decline, a CryptoQuant analyst known as EgyHash has recently shared his analysis on the altcoin in a post titled, “XRP’s Market Paradox: With Ledger Activity Dipping 80%, Is a Rebound on the Horizon?”
According to EgyHash, XRP’s on-chain and futures market data presents a mixed picture—declining activity but resilience in price. EgyHash noted that XRP Ledger activity has fallen sharply since December, with the percentage of active addresses down by 80%.
Similar declines have been observed in the futures market, where open interest has dropped roughly 70% from its highs, and funding rates have occasionally turned negative.

He added that the Estimated Leverage Ratio, which gauges average user leverage by comparing open interest to coin reserves, has also dropped significantly.
Despite these indicators pointing to weakening momentum, the altcoin’s price has only declined about 35% from its peak. This is a milder correction compared to other assets such as Ethereum, which has fallen roughly 60% over the same period.
Additionally, the altcoin’s Exchange Reserve has continued to decline, reaching levels last observed in July 2023. Lower reserves typically suggest that fewer tokens are available for immediate sale, a factor that can help support prices during market downturns.

According to EgyHash, this trend, along with relatively stable pricing, could indicate growing long-term confidence in the asset.
Institutional Developments Could Strengthen Market Sentiment
While on-chain metrics remain a focus, institutional developments may also play a role in shaping XRP’s future trajectory. Hong Kong-based investment firm HashKey Capital recently announced the launch of the HashKey XRP Tracker Fund—the first XRP-focused investment vehicle in Asia.
Backed by Ripple as the anchor investor, the fund is expected to transition into an exchange-traded fund (ETF) in the future. The initiative is designed to attract more institutional capital into the XRP ecosystem.
HashKey Capital is launching Asia’s first XRP Tracker Fund—with @Ripple as an early investor.
This marks a major step in expanding institutional access to XRP, the third-largest token by market cap. 🧵👇
— HashKey Capital (@HashKey_Capital) April 18, 2025
HashKey Capital has also indicated that this collaboration with Ripple could lead to further projects, including tokenized investment products and decentralized finance (DeFi) solutions.
Related Reading
Vivien Wong, a partner at HashKey, emphasized the strategic value of integrating Ripple’s network with regulated investment infrastructure across Asia.
Although the altcoin faces near-term pressure, long-term developments, including decreasing exchange reserves and rising institutional interest, may support its recovery as the broader market stabilizes.
Featured image created with DALL-E, Chart from TradingView


In an engaging session during Paris Blockchain Week, BeInCrypto caught up with Petrix Barbosa, the innovative mind behind Matchain, a blockchain venture that’s reshaping how digital identity and data sovereignty are approached.
Barbosa, who transitioned from a successful career as a venture capitalist, where he managed investments across 250 projects, brings a wealth of experience and a unique perspective to the blockchain landscape. Petrix Barbosa’s insights reveal a compelling vision for the future of blockchain, focusing on user empowerment and innovative use of technology to solve enduring problems in digital identity and data management.
Petrix Barbosa Discusses Matchain and its Mission
Matchain is a layer 2 blockchain platform that primarily addresses the challenges of identity and data sovereignty. Our mission is to empower users by giving them control over their digital identities and data, thus ensuring that they’re the primary beneficiaries of their online presence.
Barbosa on His Pivot from Venture Capital
In my time as an investor, I witnessed many great ideas fail to reach their potential due to the lack of a substantial user base or poor market timing. This inspired me to transition from funding projects to creating a platform that not only serves my vision but also provides tangible solutions to widespread issues in the blockchain community—primarily, user engagement and application.
Matchain’s Innovations in the Area of Identity Sovereignty
Matchain introduces a novel approach to managing digital identity. Unlike traditional models where user data is siloed across various platforms, Matchain allows users to have a single digital identity that spans across both Web2 and Web3. This is crucial for enabling a seamless transition and interaction between these two worlds.
How Matchain Integrates Existing Web2 Infrastructure
Our platform acts as a bridge between the decentralized ecosystem of Web3 and the more traditional Web2 infrastructure. By allowing users to manage their digital identities across both platforms, we facilitate a smoother interaction that enhances user experience while maintaining high security and trust.
Future Developments From Matchain
Looking ahead, we aim to expand our user base significantly. Currently, we are backed by strategic partnerships, like the one with Paris Saint-Germain, which not only broadens our exposure but also integrates our technology into mainstream applications.
In the next two years, we plan to onboard millions of users, leveraging our innovative solutions to enhance their digital interactions.
Barbosa on Unique Challenges in Developing Matchain
The biggest challenge was shifting the focus from simply creating a blockchain solution to ensuring it was user-centric and capable of addressing real-world problems. This involved integrating AI to manage and analyze data effectively, ensuring that our platform could deliver personalized and contextually relevant experiences to users.
Matchain Over the Next Five Years
In five years, I envision Matchain at the forefront of blockchain technology, leading the charge in digital identity management and data sovereignty. Our platform will likely become a critical tool for users and companies looking to navigate the complexities of the digital age securely and efficiently.
Disclaimer
In compliance with the Trust Project guidelines, this opinion article presents the author’s perspective and may not necessarily reflect the views of BeInCrypto. BeInCrypto remains committed to transparent reporting and upholding the highest standards of journalism. Readers are advised to verify information independently and consult with a professional before making decisions based on this content. Please note that our Terms and Conditions, Privacy Policy, and Disclaimers have been updated.

Cardano Price To Hit $4 If This Happens, Analyst Says Despite 180M ADA Dump

XRP Consolidation About To Reach A Bottom, Wave 5 Says $5.85 Is Coming
Chainlink Price To Hit $26 If LINK Breaks Past This Crucial Level

Despite an 18% Drop, XRP’s Exchange Supply Hits Lows—Bullish Setup Ahead?

Lorenzo Protocol (BANK) Price Rallies 150% After This Binance Announcement

Matchain’s Petrix Barbosa Talks the Future of Digital Identity

2.52 Million Altcoins Are Ruining Crypto’s Future

Animoca Brands Valuation Tanks 75% In Two Years, Here’s Why

Crypto exchange BingX hacked for $43 million

Are The Big Players Losing Interest?

Hong Kong’s Securities Association Tips Authorities On Crypto Self-Regulation

Coinbase cbBTC Set to go Live on Solana
2.52 Million Altcoins Are Ruining Crypto’s Future
Animoca Brands Valuation Tanks 75% In Two Years, Here’s Why
Crypto exchange BingX hacked for $43 million
Are The Big Players Losing Interest?
Hong Kong’s Securities Association Tips Authorities On Crypto Self-Regulation
Coinbase cbBTC Set to go Live on Solana
-

 Market24 hours ago
Vietnam Partners with Bybit to Launch Legal Crypto Exchange
-
 Altcoin19 hours ago
Ethereum ETFs Record $32M Weekly Outflow; ETH Price Crash To $1.1K Imminent?
-

 Market11 hours ago
Pi Network Roadmap Frustrates Users Over Missing Timeline
-

 Market10 hours ago
Solana (SOL) Price Rises 13% But Fails to Break $136 Resistance
-
 Market23 hours ago
100 Million Tokens Could Trigger Decline
-
 Altcoin15 hours ago
XRP Price History Signals July As The Next Bullish Month
-

 Market21 hours ago
Why Relying on TVL Could Mislead Your DeFi Strategy
-

 Market19 hours ago
CZ’s Plan to Streamline BNB Staking Could Boost DeFi