
Market
BTC Price Stalls Below $100,000 as Whales Await Market Clarity
Bitcoin (BTC) price has been trading below $100,000 for the past two weeks, with technical indicators showing a battle between bulls and bears. Despite attempts at recovery, BTC remains in a consolidation phase, with key resistance levels preventing a breakout.
Meanwhile, the number of Bitcoin whales has increased slightly, signaling some accumulation, but remains far below the peaks seen in December and January. Whether BTC can reclaim its bullish momentum or continue facing downward pressure will depend on how it reacts to crucial support and resistance levels in the coming days.
Bitcoin Ichimoku Cloud Shows a Consolidation Phase
The Ichimoku Cloud BTC chart reflects a period of consolidation, with price action moving inside the cloud. This suggests market indecision, as the cloud itself acts as a zone of equilibrium where neither bulls nor bears have full control.
The conversion line (blue) remains flat, indicating weak short-term momentum, while the baseline (red) is slightly above the price, reinforcing resistance.
The cloud ahead is thin and mixed, showing no clear trend dominance, which means volatility could increase once a breakout occurs.
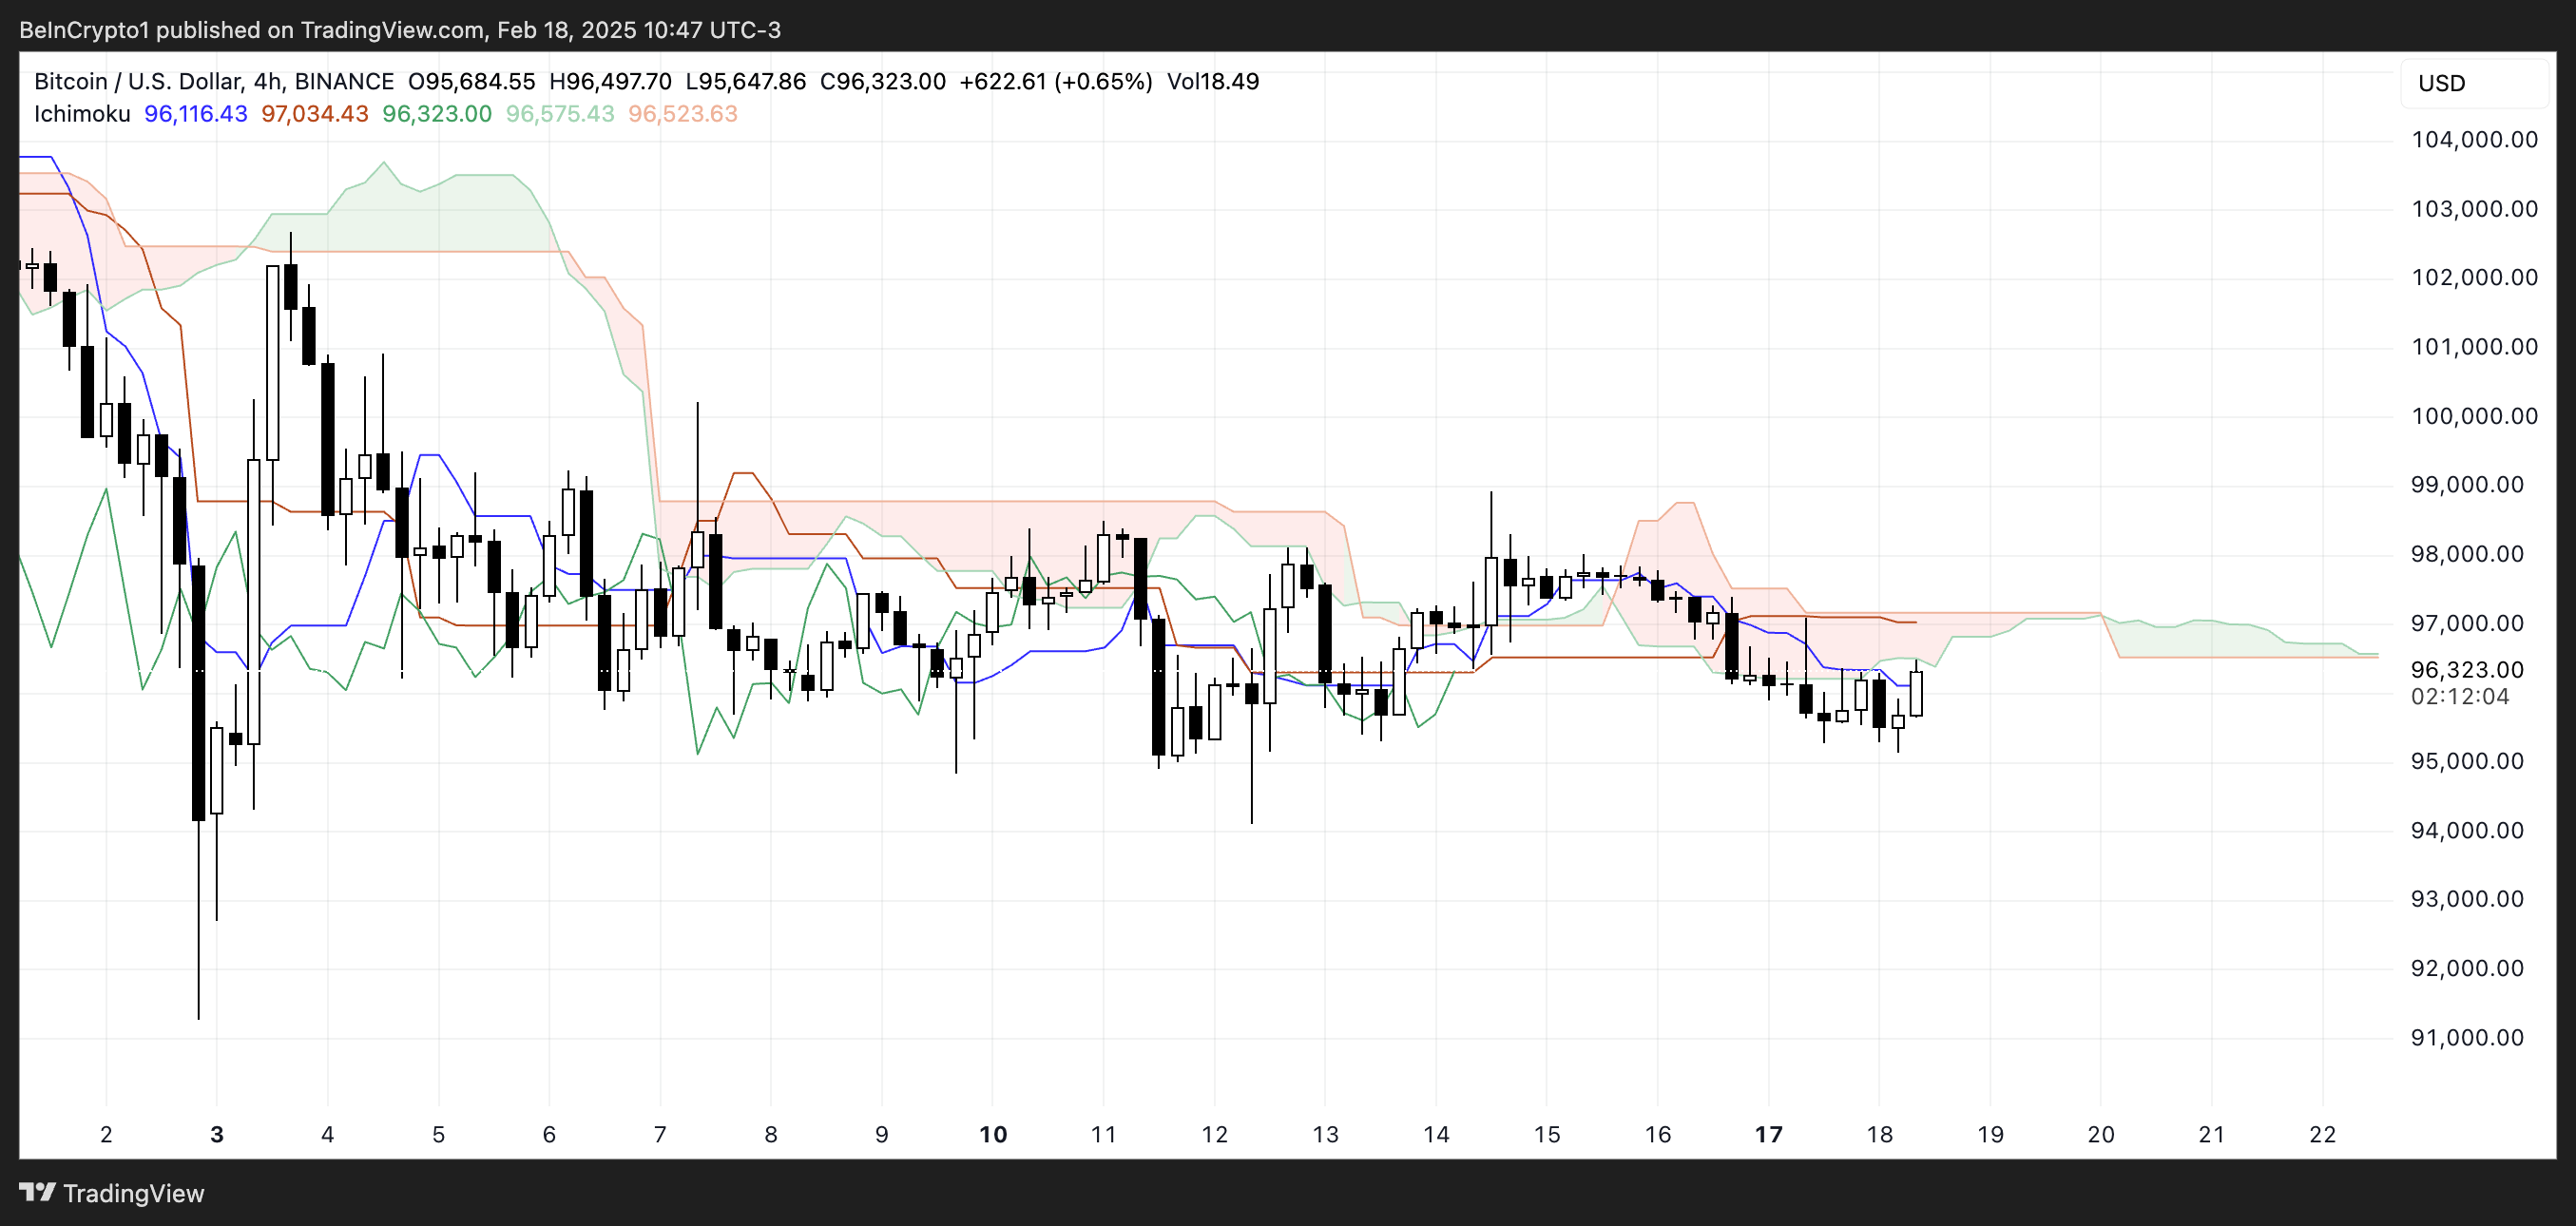
The lagging span (green) is positioned near price action, further confirming the lack of strong momentum in either direction. The cloud’s future outlook remains uncertain, with no significant expansion or clear slope, signaling a potential continuation of the current range-bound movement.
If Bitcoin price decisively moves above or below the cloud, it could confirm the trend direction, but for now, the market remains in a neutral phase.
A thicker cloud in the future would indicate stronger resistance or support, but for now, the lack of a well-defined slope suggests that traders are waiting for confirmation before committing to a directional move.
BTC Whales Are Rising, But Still Way Below Previous Levels
The number of Bitcoin whales – addresses holding more than 1,000 BTC – has risen to 2,051, up from 2,037 ten days ago. Tracking these large holders is crucial because their accumulation or distribution can signal potential shifts in market sentiment.
When whale numbers increase, it often suggests confidence in BTC’s long-term value, as these large holders tend to buy during periods of perceived undervaluation.
On the other hand, a declining whale count can indicate distribution, which may lead to increased selling pressure and potential price weakness.
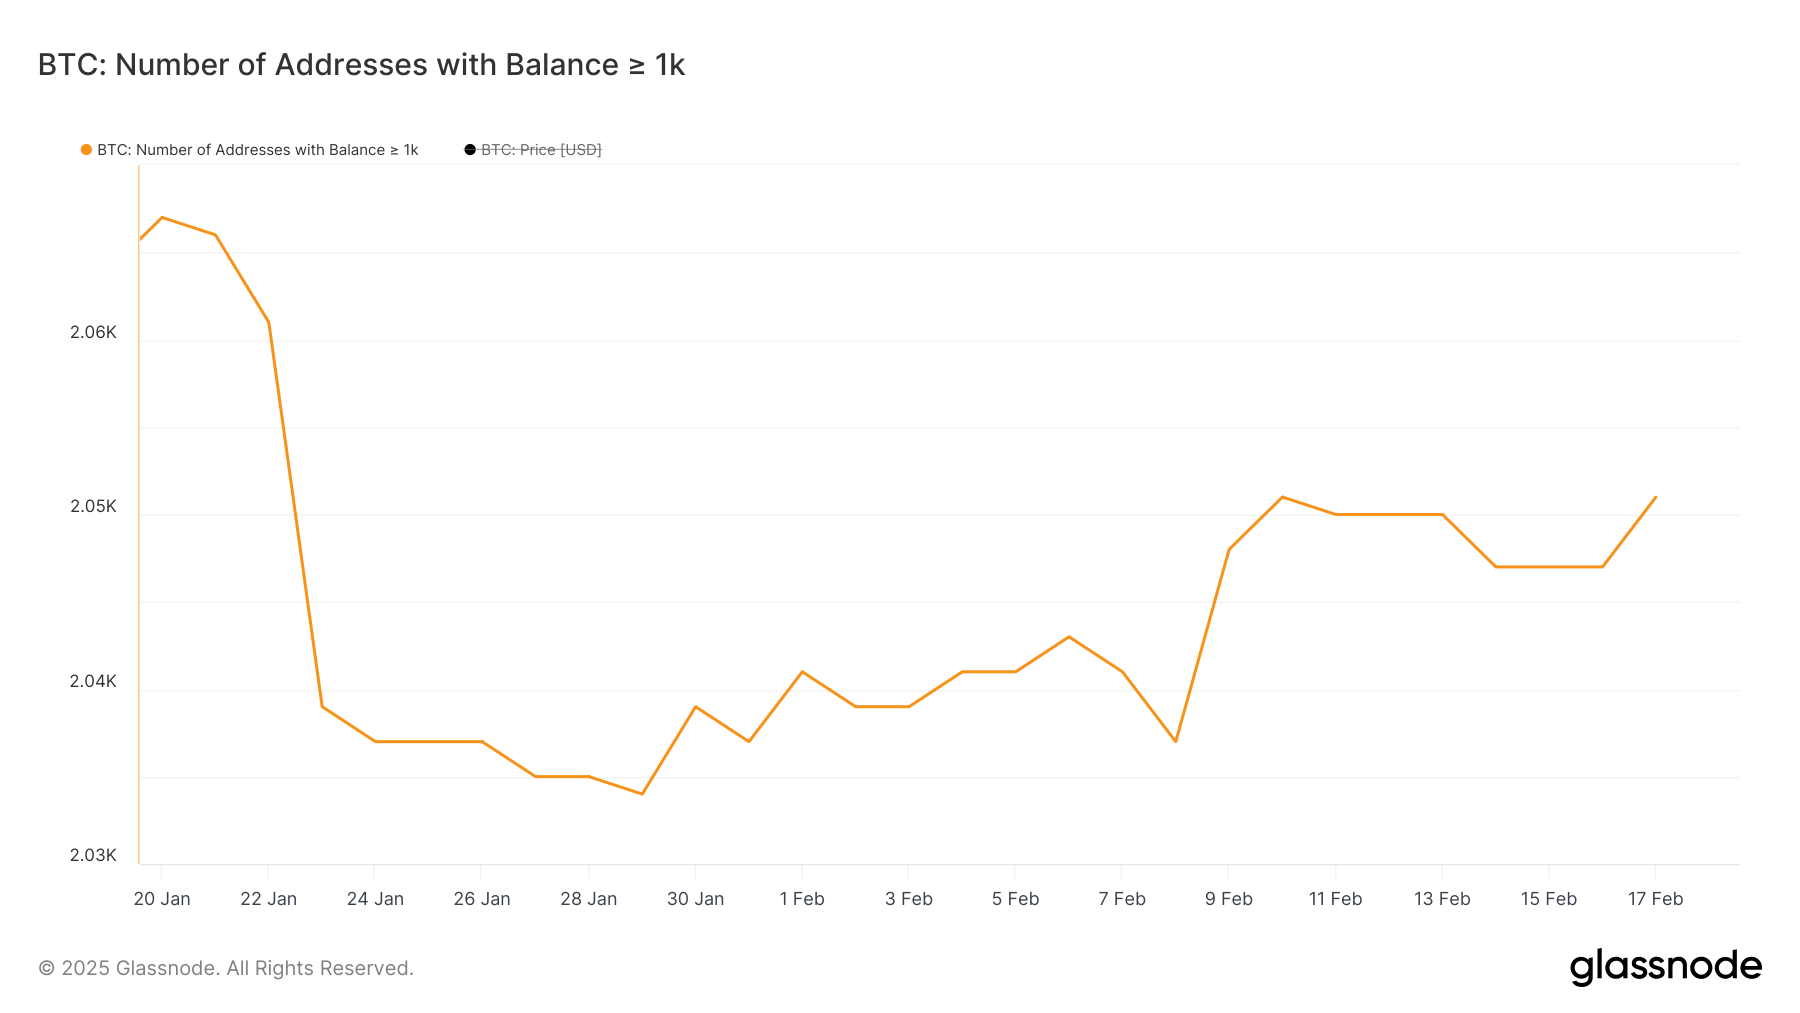
Although the recent uptick in whale addresses shows some accumulation, the total remains significantly lower than the levels seen in December and January.
This suggests that while some large holders are returning, broader institutional or long-term investor confidence has not fully recovered.
If the number of whales continues rising, it could support a more sustained bullish trend, but if it stalls or declines again, it may indicate hesitation in the market.
BTC Price Prediction: Will Bitcoin Return To $100,000 Before March?
Bitcoin’s EMA lines show an ongoing bearish trend, with short-term moving averages positioned below long-term ones, reinforcing downward momentum. If Bitcoin price manages to reverse this trend, the first key resistance to watch is $98,481.
A successful breakout above this level could open the door for a move toward the psychological barrier of $100,000.
If Bitcoin regains the bullish momentum it had in December and January, further resistance at $102,681 could be tested. A break above that could push BTC price toward $106,313, marking its highest level since the end of January.
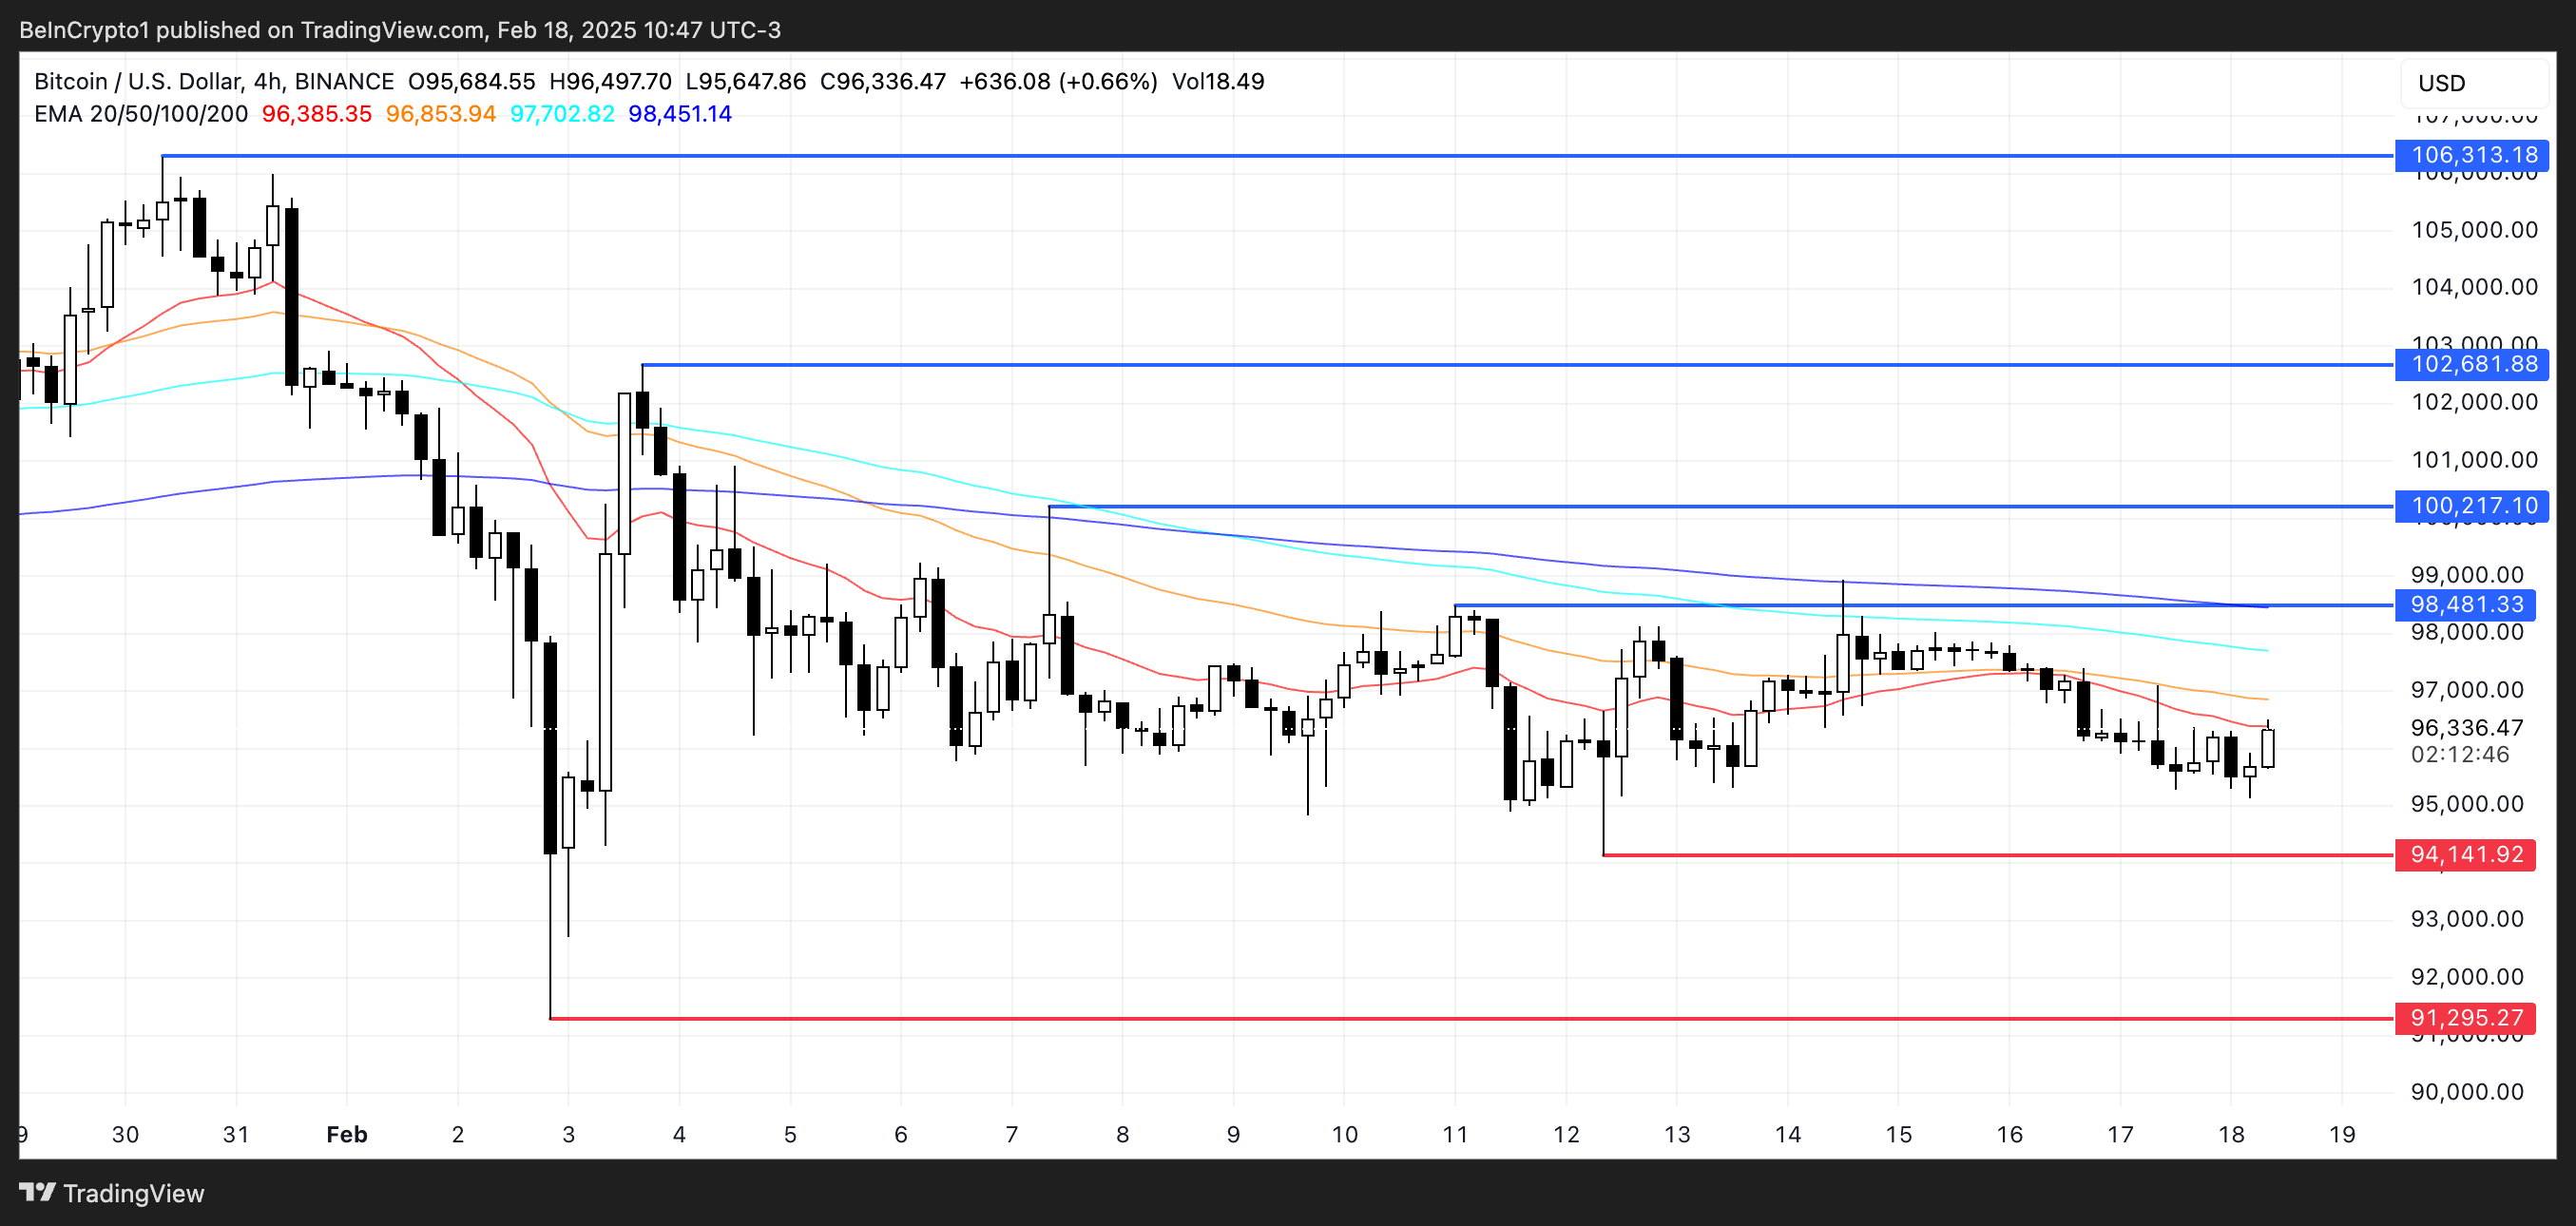
On the other hand, if the downtrend persists and intensifies, BTC price could test critical support at $94,141.
A breakdown below this level would likely trigger further selling pressure, potentially sending the price as low as $91,295. Such a move would confirm the strength of the bearish trend and could delay any meaningful recovery.
For now, BTC remains in a key decision zone, with traders closely monitoring whether it can reclaim higher levels or if further downside is ahead.
Disclaimer
In line with the Trust Project guidelines, this price analysis article is for informational purposes only and should not be considered financial or investment advice. BeInCrypto is committed to accurate, unbiased reporting, but market conditions are subject to change without notice. Always conduct your own research and consult with a professional before making any financial decisions. Please note that our Terms and Conditions, Privacy Policy, and Disclaimers have been updated.


After suffering a historic price collapse, Mantra’s OM is making a remarkable comeback. The altcoin plunged over 90% on April 13, falling from $6.30 to under $0.50 in hours.
However, it has bounced back with a 25% gain over the past 24 hours. OM is currently the market’s top gainer and is poised to extend its gains in the short term.
OM Leads Market Gains With a 25% Jump
The sudden resurgence in investor interest in OM comes after an April 15 X post from Mantra CEO John Patrick Mullin, announcing plans to burn the team’s token allocation.
While plans for the token burn are still being finalized, Mullin’s announcement has calmed market fears and revived bullish sentiment among some traders. This renewed confidence has prompted increased OM accumulation, driving the token’s price up by over 25% in the past 24 hours.
Key on-chain and market metrics support the rebound narrative. For example, the token’s open interest has risen sharply by 9%, indicating a surge in fresh capital entering OM positions in the past 24 hours.
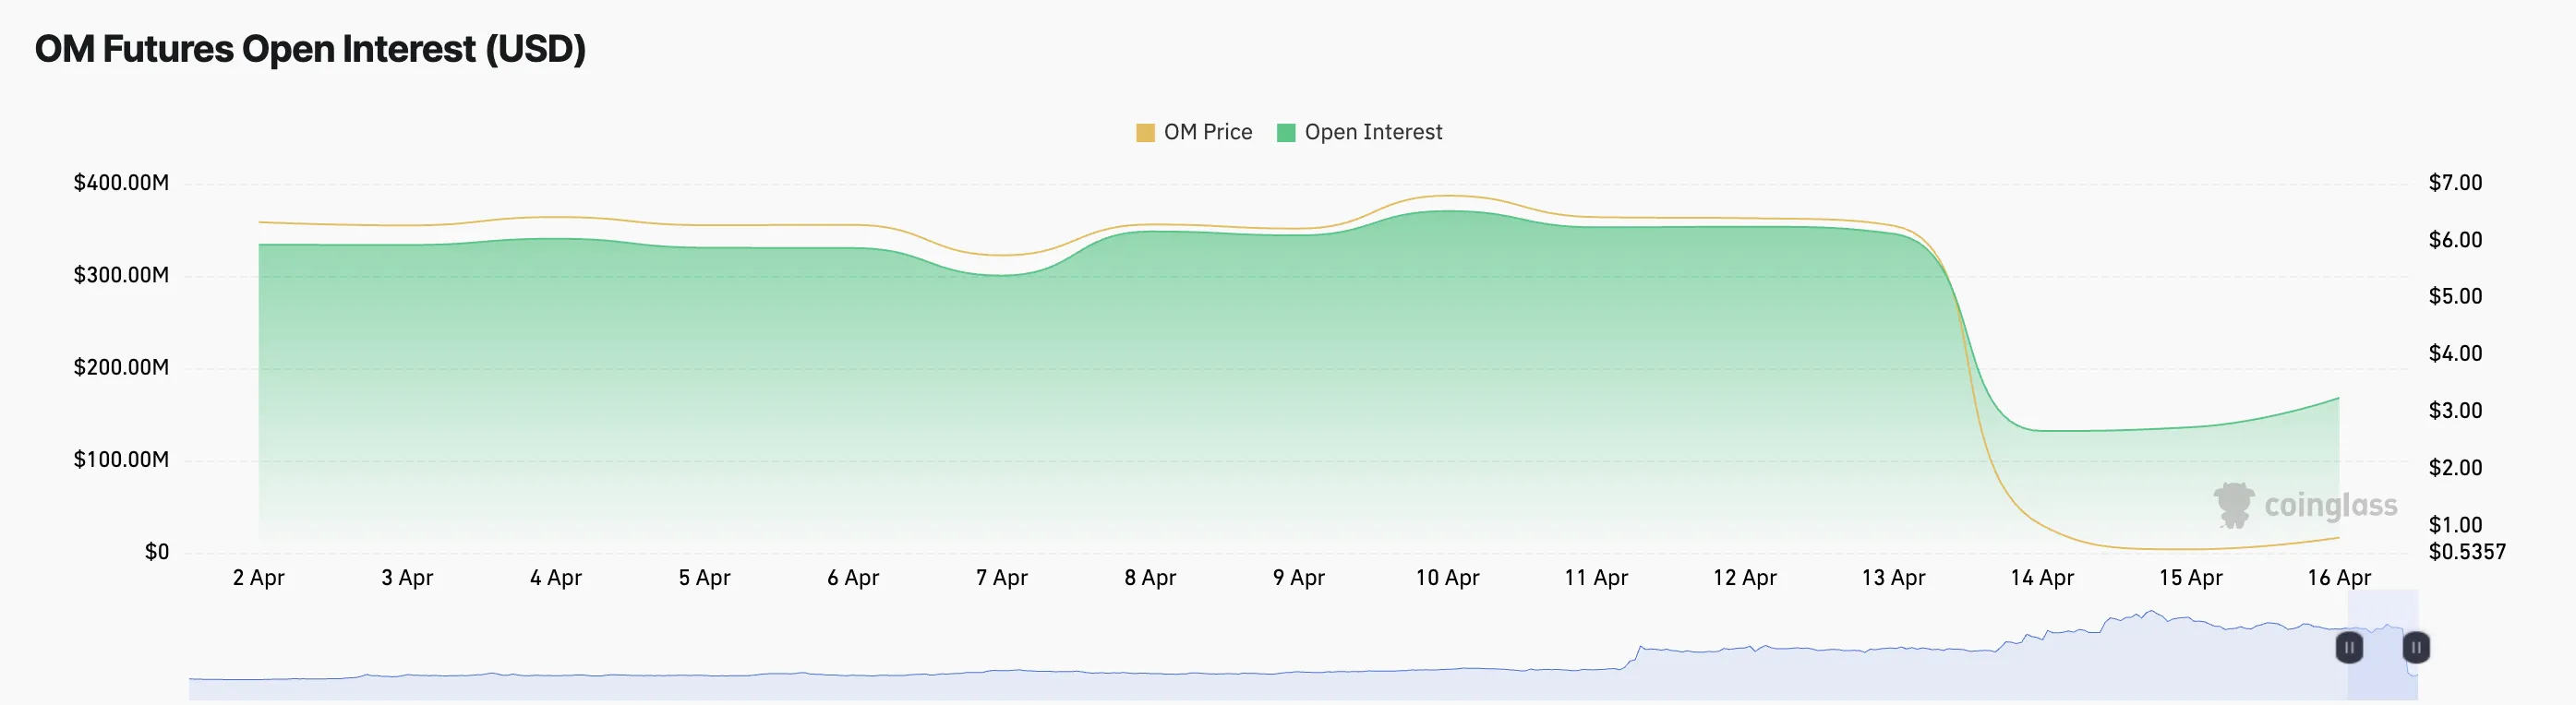
As of this writing, this stands at $156.74 million. When an asset’s open interest climbs alongside its price like this, it signals that new money is entering the market and that traders are opening fresh positions in the direction of the uptrend.
Moreover, OM’s long/short ratio confirms this. As of this writing, it is currently at 1.02, highlighting the preference for long positions among futures traders.
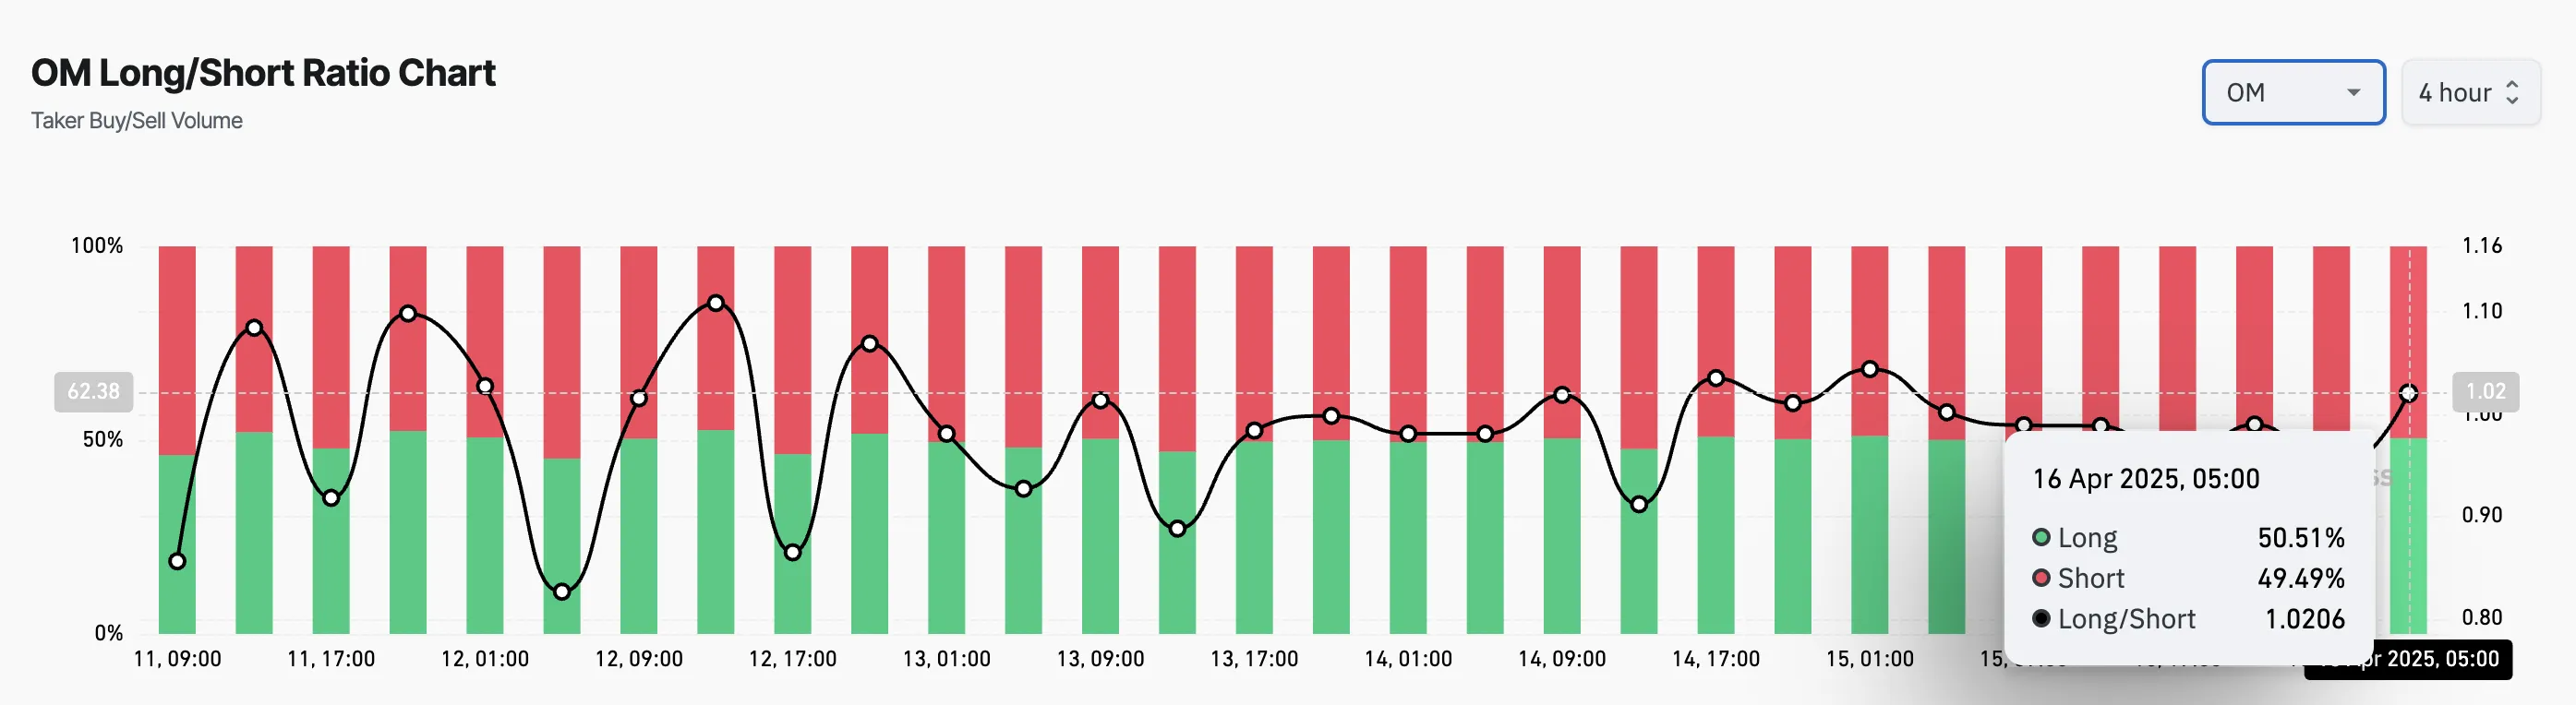
An asset’s long/short ratio measures the proportion of its long positions to short ones in the market.
A ratio above one like this means there are more positions betting on a sustained OM price rally than those opened in favor of a decline.
Next Stop $2.64 or Back to January’s $0.09 Lows?
At press time, OM trades at $0.78, climbing 29% from April 13’s low of $0.50. With the gradual uptick in its buying pressure, the altcoin could maintain its current rally to trade at $2.64.
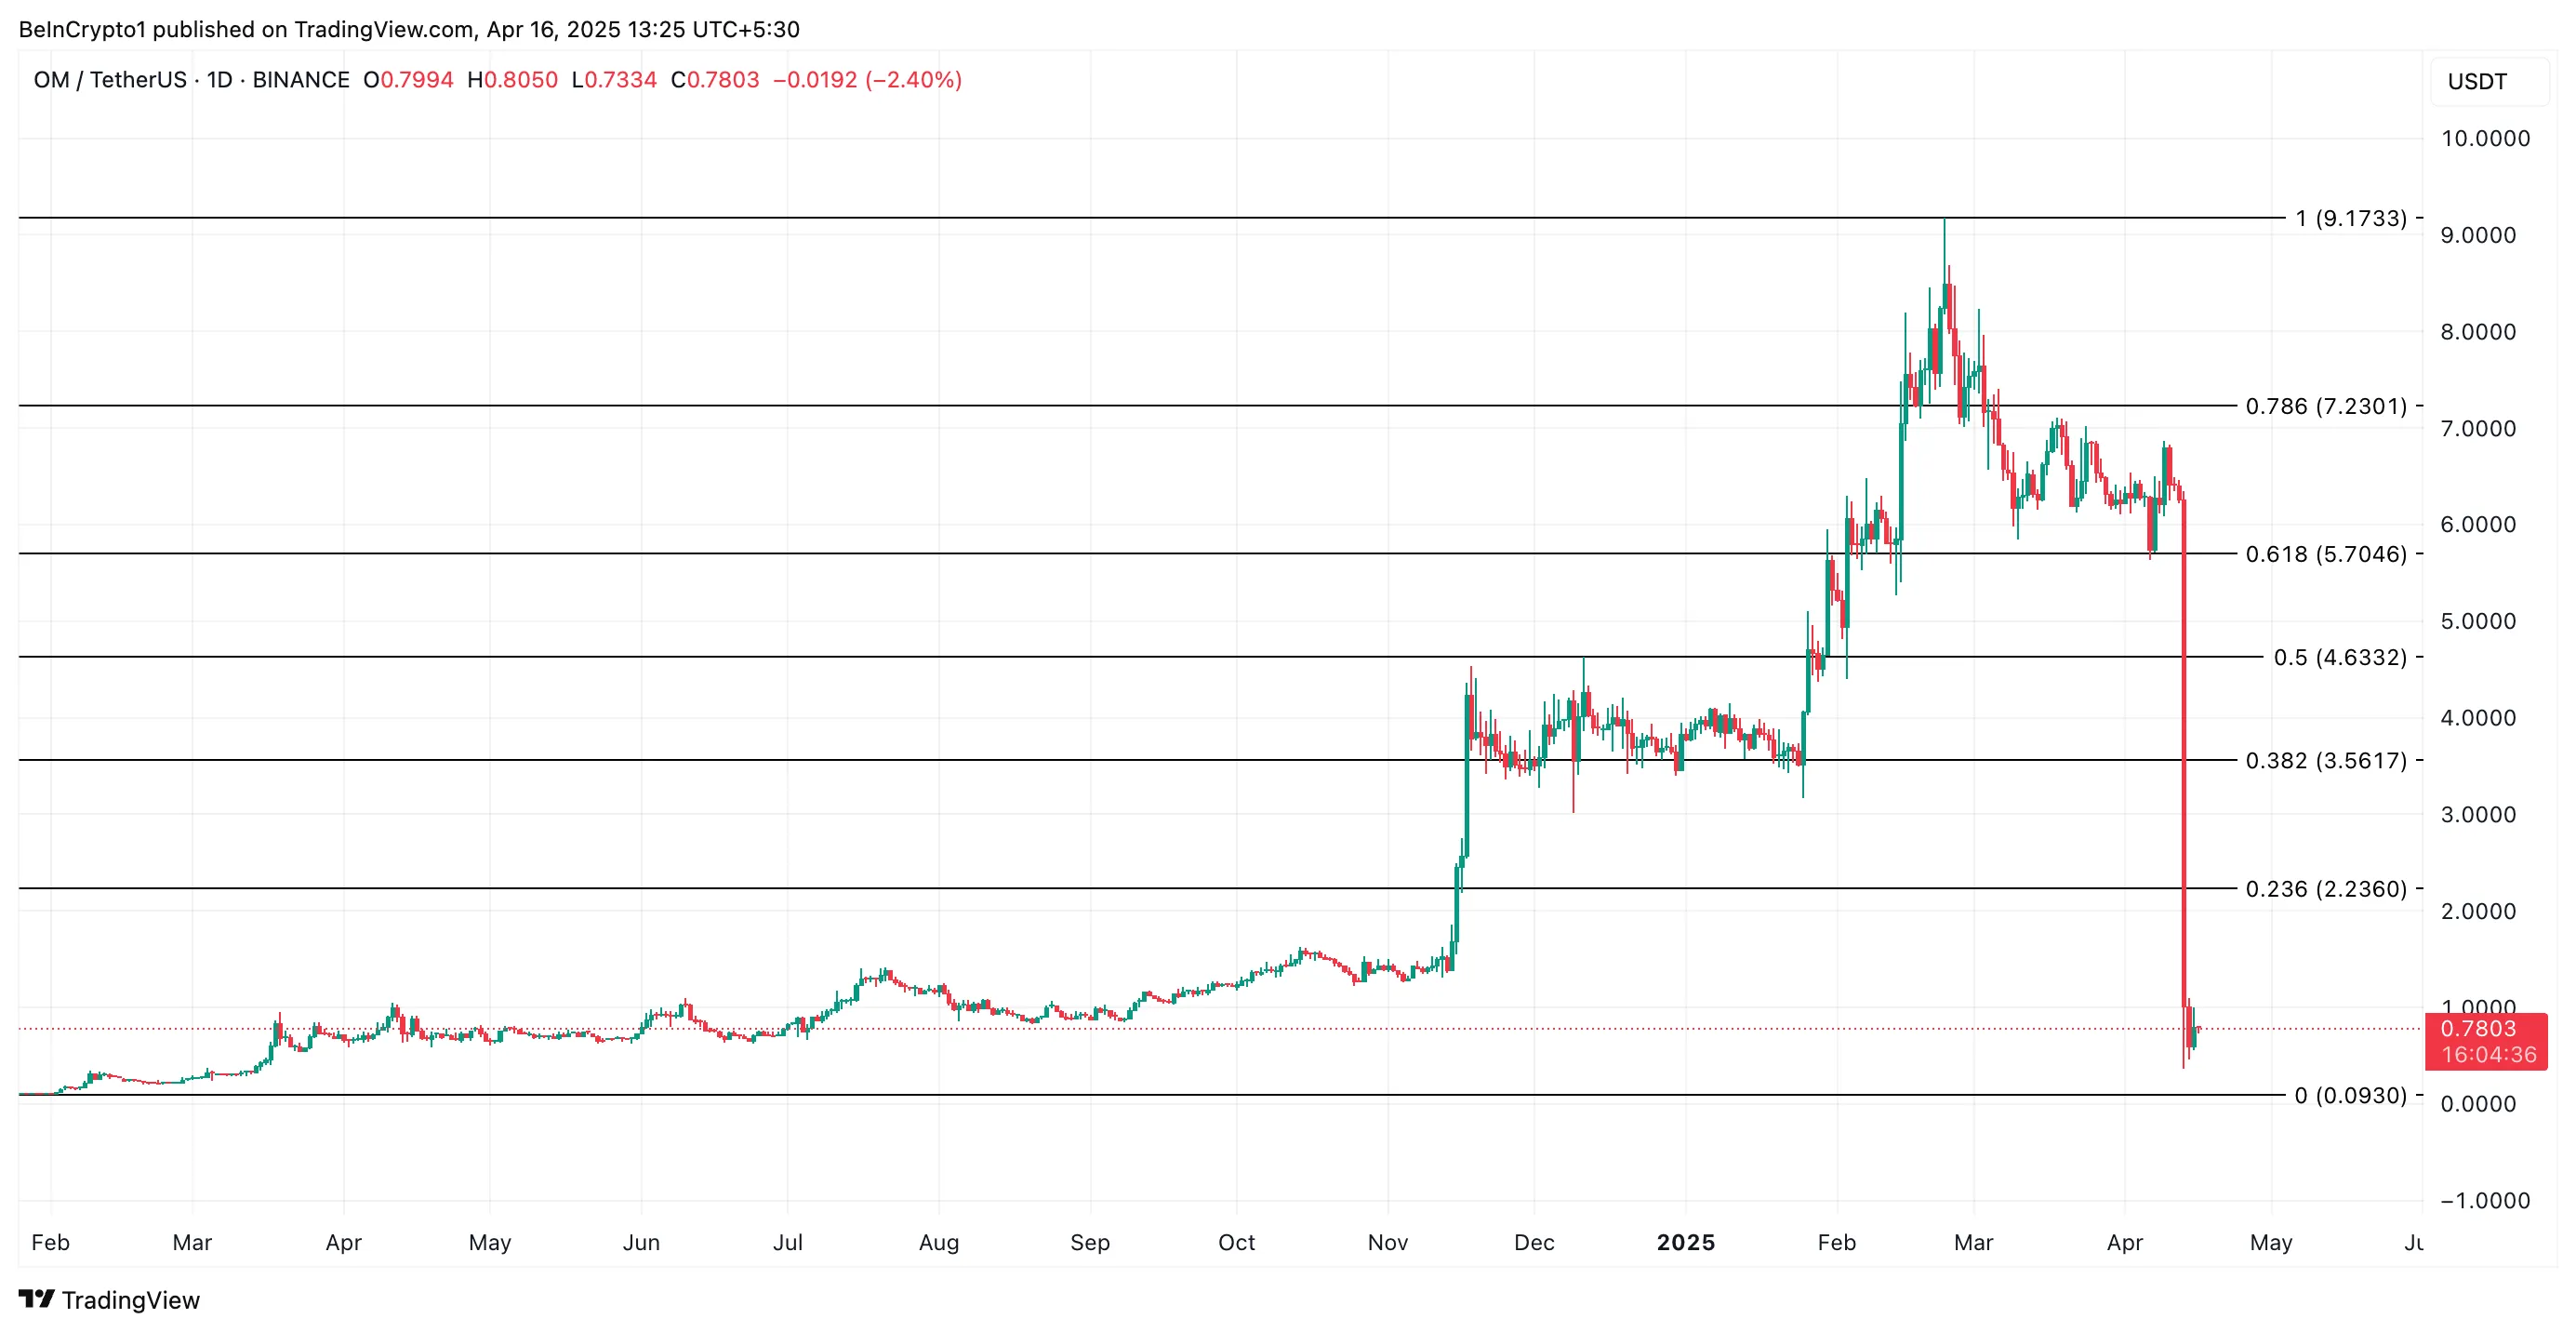
However, if the bears regain market control and increase the downward pressure on OM, it could extend its decline and fall to $0.09, a low it last reached in January 2024.
Disclaimer
In line with the Trust Project guidelines, this price analysis article is for informational purposes only and should not be considered financial or investment advice. BeInCrypto is committed to accurate, unbiased reporting, but market conditions are subject to change without notice. Always conduct your own research and consult with a professional before making any financial decisions. Please note that our Terms and Conditions, Privacy Policy, and Disclaimers have been updated.

Binance co-founder Changpeng Zhao (CZ) announced a major deflationary milestone, confirming the completion of BNB Chain’s 31st quarterly token burn.
In total, 1.57 million BNB, valued at approximately $916 million, was permanently removed from circulation.
BNB Chain Burns $916 Million Worth of Tokens in 31st Quarterly Event
The BNB burn is part of BNB Smart Chain’s long-running commitment to reduce the token’s total supply and potentially bolster long-term value.
According to an official blog post, this quarter’s burn was completed successfully. The remaining total supply of BNB stands at just over 139 million. Former Binance CEO Changpeng Zhao echoed the update with a simple post on X (Twitter).
“$916,000,000 BNB burned,” CZ wrote.
They sent the tokens to a burn address, 0x000…dEaD, making them unrecoverable and effectively reducing the total supply.
The burn occurred under BNB’s Auto-Burn mechanism and marks one of the largest events in the chain’s history. Established under BEP95, BNB’s Auto-Burn system provides transparency and predictability. It adjusts the burn amount based on BNB’s market price and the number of blocks generated on the BNB Smart Chain (BSC) each quarter.
The goal is gradually reducing the token’s circulating supply to 100 million BNB. Once this happens, regular burns will cease.
Deflationary mechanisms are typically bullish, but the market reaction was tepid. BNB’s price slipped 2.11% over the past 24 hours, trading around $578.04 as of this writing.

Impact of BNB Burn on Market Sentiment
The muted response mirrors the aftermath of the 30th burn, suggesting that even billion-dollar reductions in supply are not enough to overcome broader market sentiment or investor fatigue. Meanwhile, community members expressed mixed feelings about the event.
“It actually pains me sometimes to see BNB burns! I know it’s part of the deflationary process… but it still hurts brother CZ,” crypto advocate Shahzad Quadri commented.
Meanwhile, others questioned the utility of such a large burn. Users asked CZ why the BNB chain did not redirect the funds toward marketing efforts.
“It’s not up to me. It was in the whitepaper. A promise is a promise,” CZ replied.
This statement resonated with community leaders, including a MEXC exchange KOL, who responded in a post.
“Saw people wishing it wasn’t burnt. The only way is burning because if it is not burnt, the team won’t be keeping the promise on the whitepaper,” the KOL highlighted.
Changpeng Zhao added a touch of irony, seeming surprised by the size of the burn. Users asked whether this burn was separate from the ongoing gas fee burn introduced under BEP95.
“I have no idea. There are a few different automated burn mechanisms. I learned about this burn on X,” he chimed.
In addition to the quarterly Auto-Burn, BNB implements a real-time burn model that permanently removes a portion of gas fees from circulation. Since its inception, over 259,000 BNB tokens have been burned through this mechanism.

Furthermore, the BNB Pioneer Burn Program continues to cover user losses from accidental token misplacements. It uses quarterly burns to offset such events.
CZ has a personal investment, with 98.6% of his portfolio in BNB as of February. Still, the commitment to scheduled burns and BNB’s critical role across BNB Smart Chain, opBNB Layer 2, and BNB Greenfield blockchain reaffirms the long-term strategy to drive utility, governance participation, and ecosystem growth.

The BNB community is left watching price action, balancing hope in the deflationary model with the reality of market headwinds.
Disclaimer
In adherence to the Trust Project guidelines, BeInCrypto is committed to unbiased, transparent reporting. This news article aims to provide accurate, timely information. However, readers are advised to verify facts independently and consult with a professional before making any decisions based on this content. Please note that our Terms and Conditions, Privacy Policy, and Disclaimers have been updated.
Gold prices have surpassed $3,300 per ounce, setting a historic high as global markets face heightened volatility.
This surge reflects investor anxiety over economic uncertainty and highlights the significant impact of controversial tariff policies under President Trump. Consequently, experts have issued conflicting forecasts on how this may influence Bitcoin.
What’s Driving Gold to Keep Breaking Records?
At the time of writing, gold has surged past $3,000, reaching a peak of $3,317. That marks a 25% increase since the beginning of the year.

According to a report in The New York Times, the global trade war is the primary force behind gold’s continued rise. Retaliatory tariffs among major economies are clouding the global economic outlook.
The US imposed new tariffs, quickly triggering countermeasures from China, the European Union, and Canada. In response, the White House escalated the situation further.
“While general uncertainty and deteriorating economic vibes are improving interest in gold, most of gold’s price action is around the uncertainty related to tariffs,” Helima Croft, head of global commodity strategy at RBC Capital Markets, said.
In addition, there are growing concerns that tariffs could directly target imported gold. This fear has led to gold stockpiling within the United States.
Business Standard reported that major banks like JPMorgan Chase and HSBC have been moving large quantities of gold from London to New York. JPMorgan alone plans to transport $4 billion worth of gold this month.
Besides the tariff war, macro analyst Zerohedge pointed to another factor—the Senate Budget Resolution for FY2025. This resolution allows the US to increase its budget deficit by up to $5.8 trillion over the next ten years. Zerohedge suggested that Gold is responding to this news.
The price spike reflects fears of currency devaluation due to ballooning deficits.
Goldman Sachs has also raised its year-end gold forecast to $3,700. The bank cited stronger-than-expected central bank demand and rising recession risks.
What Are Analysts Saying About Bitcoin as Gold Hits a New Peak?
While gold shines, Bitcoin, often called “digital gold,” has drawn mixed opinions.
Anthony Papillano, CEO of Professional Capital Management, told CNBC on April 15 that Bitcoin has dropped around 10% since the start of the year, while gold has gained 20%. However, both assets have risen approximately 35% over the past year.
He also outlined reasons why Bitcoin might soon rally like gold. These include the US government’s strategic Bitcoin reserve plans and the younger generation’s growing view of Bitcoin as part of a long-term investment strategy.
“History tells us Bitcoin’s returns will skyrocket past Gold in the coming months,” Papillano predicted.
Supporting this view, several analysts noted that Bitcoin often follows gold’s upward momentum with a lag of about 100 days, especially during increased global liquidity. Additionally, companies purchased more than 95,400 BTC in the first quarter of 2025, showing strong institutional demand.
However, not everyone agrees. Economist Peter Schiff, a long-time Bitcoin critic, offered a contrasting view. He claimed the best trade right now is to sell all Bitcoin and other cryptocurrencies and invest entirely in gold and silver mining stocks.
Disclaimer
In adherence to the Trust Project guidelines, BeInCrypto is committed to unbiased, transparent reporting. This news article aims to provide accurate, timely information. However, readers are advised to verify facts independently and consult with a professional before making any decisions based on this content. Please note that our Terms and Conditions, Privacy Policy, and Disclaimers have been updated.
Mantra’s OM Token Surges 25% After Token Burn Announcement

BNB Burn Reduces Circulating Supply by $916 Million

Ethereum Breakout Imminent? Analyst Expects ETH Price Surge To $2,000

Gold Price Hits New All-Time High Above $3,300 Amid Tariff Turmoil

Ethereum Price Dips Again—Time to Panic or Opportunity to Buy?

Did Ethereum Survive The Storm? Analyst Eyes Breakout Next

2.52 Million Altcoins Are Ruining Crypto’s Future

Animoca Brands Valuation Tanks 75% In Two Years, Here’s Why

Crypto exchange BingX hacked for $43 million

Are The Big Players Losing Interest?

Hong Kong’s Securities Association Tips Authorities On Crypto Self-Regulation

Coinbase cbBTC Set to go Live on Solana
2.52 Million Altcoins Are Ruining Crypto’s Future
Animoca Brands Valuation Tanks 75% In Two Years, Here’s Why
Crypto exchange BingX hacked for $43 million
Are The Big Players Losing Interest?
Hong Kong’s Securities Association Tips Authorities On Crypto Self-Regulation
Coinbase cbBTC Set to go Live on Solana
-

 Market21 hours ago
Trump Family Plans Crypto Game Inspired by Monopoly
-

 Market18 hours ago
Bitcoin Eyes $90,000, But Key Resistance Levels Loom
-

 Altcoin22 hours ago
Whispers Of Insider Selling As Mantra DAO Relocates Nearly $27 Million In OM To Binance
-
 Altcoin19 hours ago
Could Tomorrow’s Canada Solana ETF Launch Push SOL Price to $200?
-

 Market20 hours ago
ETH Retail Traders Boost Demand Despite Institutional Outflows
-

 Market22 hours ago
Forget XRP At $3, Analyst Reveals How High Price Will Be In A Few Months
-

 Market24 hours ago
Omri Ross on How eToro Stands Out in the Crypto Exchange Arena
-
 Market23 hours ago
XRP Early Investors Continue To Sell As Price Holds Above $2
