
Market
BRETT Price Enters Overbought Zone, Potential Correction Looms

BRETT price has been experiencing significant momentum, with the current uptrend showing strength across multiple technical indicators. The trend appears to be intensifying, supported by a strong surge in price over the last few days.
However, there are signs that the asset could be overbought, which may lead to a correction. Traders should keep an eye on both the uptrend signals and any signs of a potential pullback in the near future.
BRETT Current Uptrend Is Strong
BRETT’s ADX (Average Directional Index) currently sits at 46.87, a significant increase from just 20 two days ago. This sharp rise in the ADX indicates that the strength of the current trend is intensifying quickly.
During the same two-day period, BRETT’s price surged from $0.086 to $0.1124, marking a 30% increase. An ADX value nearing 50 is considered strong, which implies that the upward trend is powerful and likely to continue unless there’s a major shift in market conditions.
The ADX, or Average Directional Index, is a technical indicator used to quantify the strength of a market trend. It doesn’t indicate the direction of the trend, whether it’s up or down, but rather measures how strong the trend is.
Read more: 7 Hot Meme Coins and Altcoins that are Trending in 2024
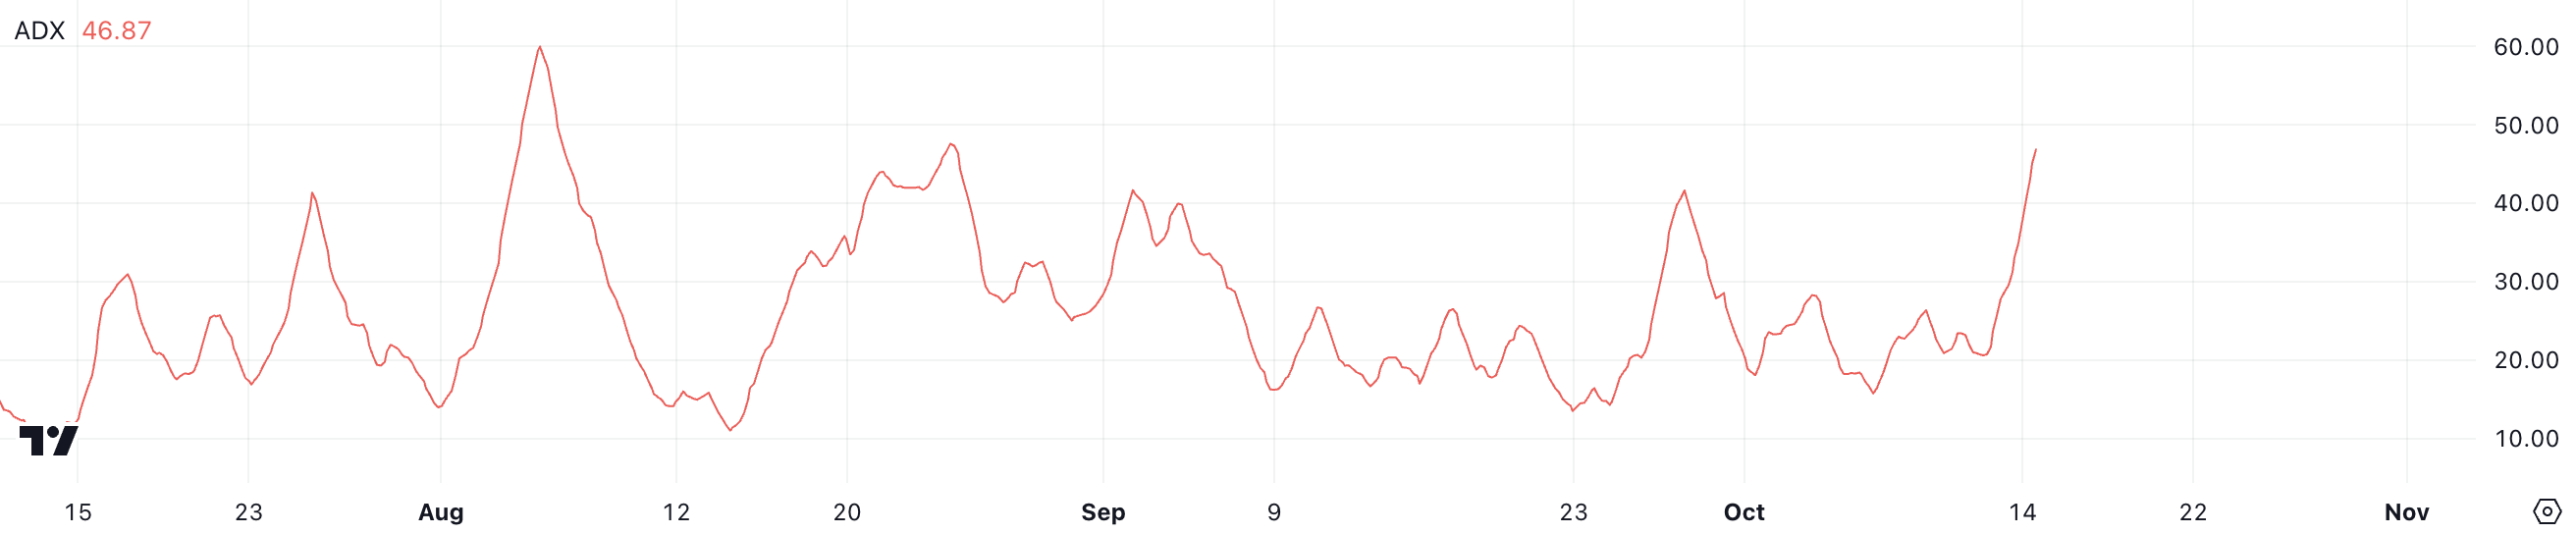
An ADX value below 20 generally points to a weak or non-trending market, while values above 25 signal a strong trend. When the ADX climbs above 40, it indicates a very powerful trend, which traders often use as a sign of increased buying or selling pressure depending on the direction of price movement.
With BRETT’s ADX now at 46.87, it indicates that the current uptrend is exceptionally strong. A strong ADX value combined with an upward price trend suggests that the buying momentum is increasing, making it likely that the bullish trend could be sustained in the near term.
BRETT RSI Just Surged into Overbought Territory
Alongside the strong ADX, BRETT’s RSI (Relative Strength Index) has surged dramatically. Just four days ago, the RSI stood at 40, but it has now climbed to 75.69. That suggests that the buying momentum has intensified quickly. This significant increase in the RSI, coupled with a high ADX, paints a mixed picture of both strength and caution in BRETT’s market conditions.
The RSI, or Relative Strength Index, is a technical indicator used to measure the speed and change of price movements. It ranges from 0 to 100 and helps indicate whether an asset is overbought or oversold.
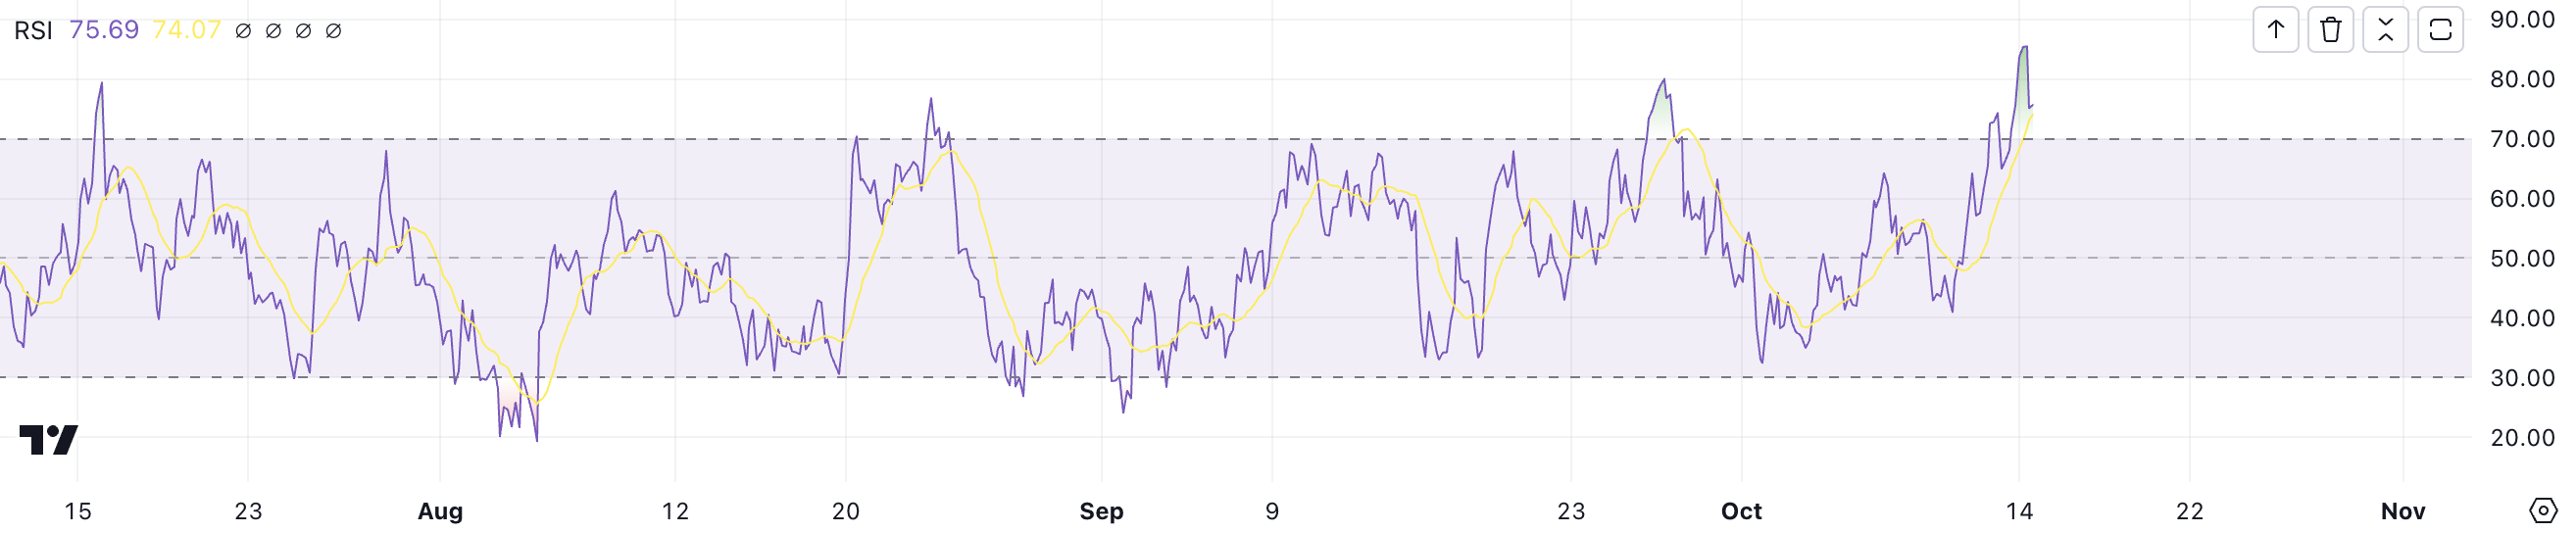
Typically, an RSI below 30 indicates that an asset is oversold, signaling a potential buying opportunity. An RSI above 70 suggests that the asset might be overbought, potentially leading to a price correction.
With BRETT’s RSI now at 75.69, it suggests that the asset has entered the overbought territory. This elevated RSI points to strong recent buying pressure. It also hints that the price may have risen too far, too quickly. Although the ADX confirms the current uptrend is strong, the high RSI level could mean that BRETT is due for a correction.
BRETT Price Prediction: A Potential 32% Correction Ahead?
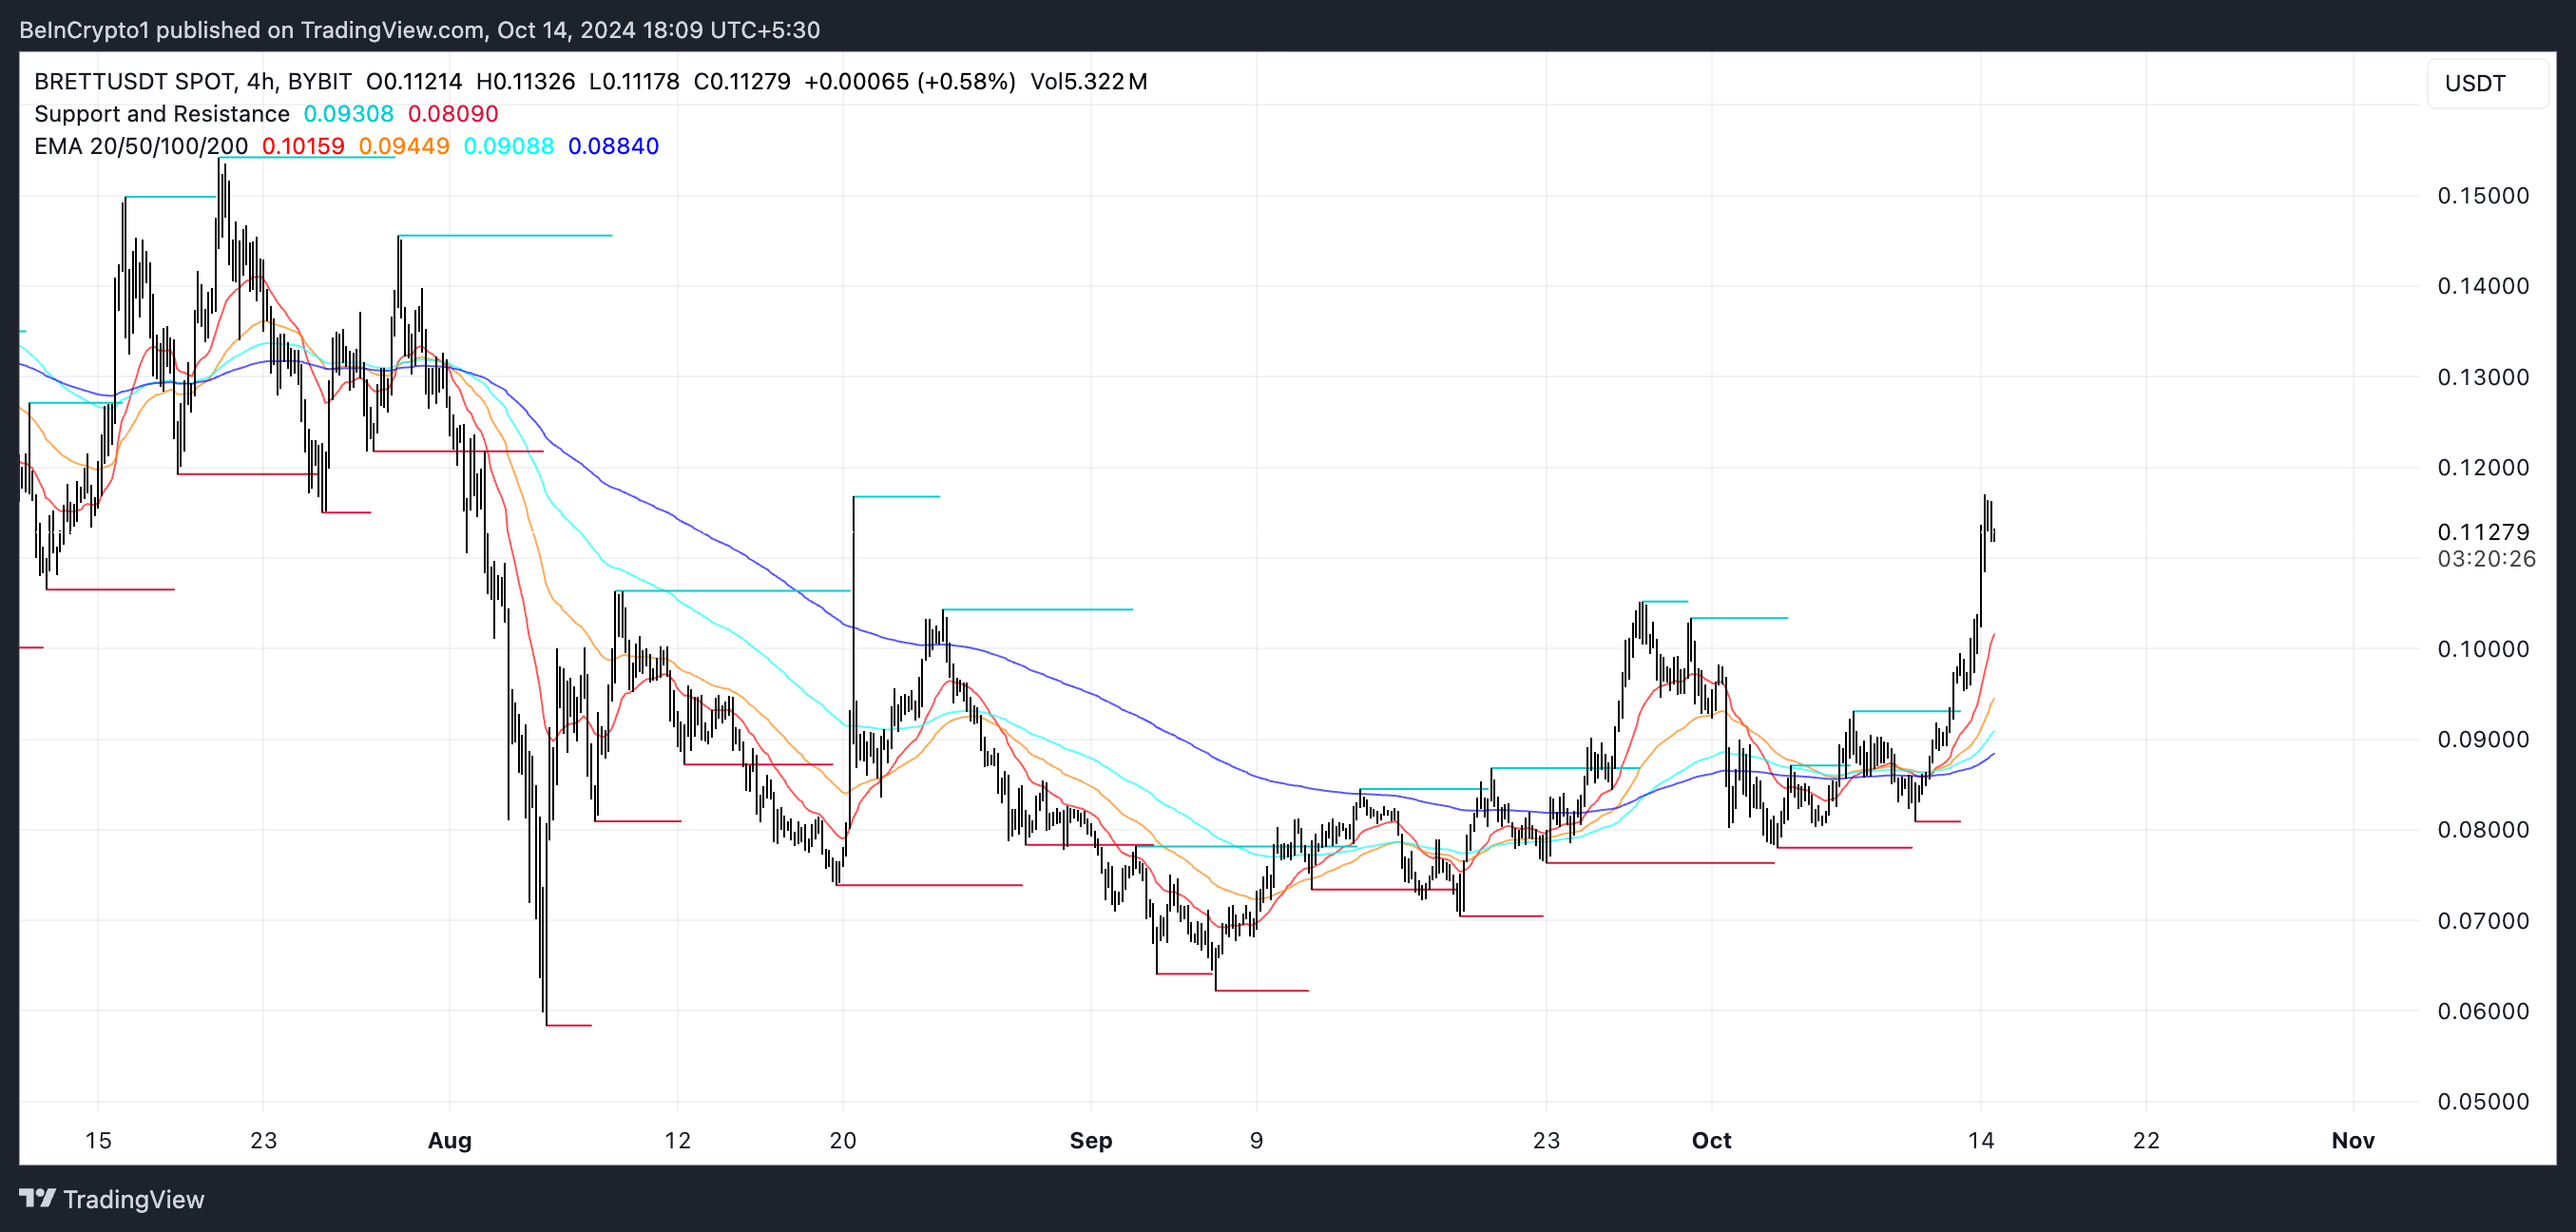
BRETT’s EMA lines are currently showing a strong uptrend, highlighting a bullish sentiment in the market. On October 11, BRETT experienced a significant technical event known as a “golden cross,” where its short-term EMA (Exponential Moving Average) crossed above its long-term EMA.
This crossover is typically seen as a bullish indicator, signaling the potential for sustained upward momentum. EMA lines themselves are tools used by traders to gauge the average price movement of an asset over a set period, giving more weight to recent data points to capture current market trends better.
A golden cross is a bullish technical pattern that occurs when a short-term EMA crosses above a longer-term EMA. This event is generally interpreted as a sign that positive momentum is building. The presence of a golden cross suggests that BRETT’s uptrend could continue. That could potentially drive its price to test the next resistance level around $0.1455.
Read more: 7 Best Base Chain Meme Coins to Watch in October 2024
However, despite the strong uptrend indicated by the EMA lines and the golden cross, the RSI points to a different potential outcome. With the RSI currently at 75.69, BRETT is in overbought territory. That indicates that the recent buying pressure may be reaching unsustainable levels. If this overbought condition leads to a reversal, BRETT could see a significant price correction.
In such a scenario, key support levels are likely to be tested. That would start around $0.087 and potentially drop to $0.076, which would represent a 32% correction from its current value. This mix of bullish and overbought signals means traders should watch closely, as the market could either continue to push towards higher targets or enter a phase of sharp retracement.
Disclaimer
In line with the Trust Project guidelines, this price analysis article is for informational purposes only and should not be considered financial or investment advice. BeInCrypto is committed to accurate, unbiased reporting, but market conditions are subject to change without notice. Always conduct your own research and consult with a professional before making any financial decisions. Please note that our Terms and Conditions, Privacy Policy, and Disclaimers have been updated.


Lorenzo Protocol’s native token, BANK, has recorded a 150% price surge within six hours of its official launch.
The token’s rapid climb follows its listing on multiple platforms, including Binance’s Alpha Market and the launch of a BANKUSDT perpetual contract on Binance Futures with up to 50x leverage.
What is the New BANK Token on Binance Futures?
The Token Generation Event (TGE) for BANK took place today, April 18, via Binance Wallet, in partnership with PancakeSwap. Lorenzo Protocol raised $200,000 through the sale of 42 million BANK tokens—2% of the total supply—priced at $0.0048 each.
The token is now trading on PancakeSwap, Bitget, and CoinEx. Following its debut, BANK reached a market cap of approximately $22 million.
BANK is the governance and utility token for Lorenzo Protocol, a DeFi platform focused on enhancing Bitcoin liquidity.
The protocol allows users to earn yield on BTC without giving up custody. It uses financial primitives like Liquid Principal Tokens (LPTs) and Yield-Accruing Tokens (YATs).
According to its claims, BANK holders can stake their tokens to receive veBANK, which provides governance rights and a share of future emissions.
Also, Lorenzo Protocol is built on a Cosmos-based Ethermint appchain. It enables BTC restaking and interoperability with Bitcoin’s Layer 1. The design supports on-chain issuance and settlement of BTC-backed assets.
The listing of the BANK/USDT perpetual contract on Binance Futures adds further momentum to the token. Binance Futures is a derivatives platform that allows users to trade perpetual contracts with high leverage.
Binance has historically preferred new tokens on the BNB chain for early futures trading. BANK’s sharp price increase and rapid market integration highlight strong early interest in Lorenzo Protocol’s approach to BTC-based DeFi infrastructure.
Currently, it’s far-fetched to project whether the exchange will list this newly launched token. However, Binance’s new community voting on token listing has offered positive hopes for small market cap projects.
Disclaimer
In adherence to the Trust Project guidelines, BeInCrypto is committed to unbiased, transparent reporting. This news article aims to provide accurate, timely information. However, readers are advised to verify facts independently and consult with a professional before making any decisions based on this content. Please note that our Terms and Conditions, Privacy Policy, and Disclaimers have been updated.


HashKey Capital has launched the HashKey XRP Tracker Fund, the first fund in Asia focused exclusively on tracking the performance of XRP.
The fund is now open to professional investors. Ripple is backing the initiative as an early investor.
Institutional Interest in XRP Investment Continues to Grow
According to HashKey, XRP offers a faster and more cost-effective alternative to traditional cross-border payment systems. The new tracker fund aligns with HashKey Capital’s goal of connecting conventional finance with digital asset markets.
The fund allows investors to subscribe using either cash or in-kind contributions. Investors can redeem or subscribe to shares on a monthly basis.
CF Benchmarks, known for its role in global ETF markets, will provide the fund’s benchmark.
“XRP stands out as one of the most innovative cryptocurrencies in today’s market, attracting global enterprises who use it to transact, tokenize, and store value. With the first XRP Tracker Fund available in the region, we simplify access to XRP, catering to the demand for investment opportunities in the very best digital assets,” said Vivien Wong, Partner at HashKey Capital.
Most recently, Ripple acquired prime brokerage platform Hidden Road for $1.25 billion. It was one of the largest acquisition deals in the crypto and blockchain space.
Earlier today, Hidden Road secured a broker-dealer license from the Financial Industry Regulatory Authority (FINRA).
Meanwhile, XRP continues to gain traction with institutional investors. Standard Chartered recently forecast that XRP could surpass Ethereum by 2028, citing increased demand for efficient cross-border payment solutions and growing disruption in global trade.
“XRP is uniquely positioned at the heart of one of the fastest-growing uses for digital assets – facilitation of cross-border and cross-currency payments. In this way, XRPL is similar to the main use case for stablecoins such as Tether. This stablecoin use has grown 50% annually over the past two years, and we expect stablecoin transactions to increase 10x over the next four years. We think this bodes well for XRPL’s throughput growth, given the similar use cases for stablecoins and XRPL,” Geoff Kendrick, Standard Chartered’s Head of Digital Assets Research, told BeInCrypto.
Interest in XRP ETFs is also increasing. Teucrium Investment Advisors recently received NYSE Arca approval for the Teucrium 2x Long Daily XRP ETF (XXRP), the first leveraged XRP ETF in the United States.
Also, attention is now turning to spot XRP ETFs. Grayscale and 21Shares are both awaiting decisions from the SEC on their XRP-based products.
The SEC has up to 240 days to review the Grayscale XRP Trust and the 21Shares Core XRP Trust, with final deadlines set for October 18 and 19, 2025.
XRP’s price has declined by nearly 20% over the past month, but institutional confidence remains high.
Ripple recently confirmed progress in resolving its long-standing legal battle with the SEC. A joint motion to pause court proceedings was approved, giving both parties 60 more days to finalize a settlement.
Disclaimer
In adherence to the Trust Project guidelines, BeInCrypto is committed to unbiased, transparent reporting. This news article aims to provide accurate, timely information. However, readers are advised to verify facts independently and consult with a professional before making any decisions based on this content. Please note that our Terms and Conditions, Privacy Policy, and Disclaimers have been updated.
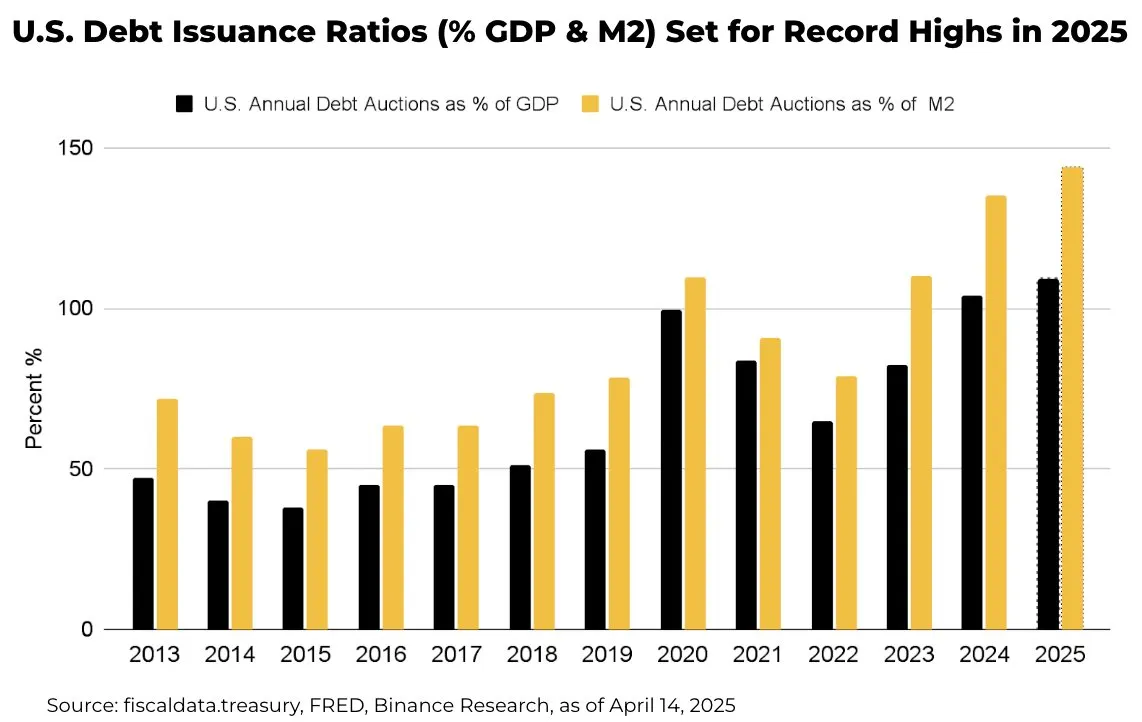
US Treasury plans to issue over $31 trillion in bonds this year—around 109% of GDP and 144% of M2. This would be the highest recorded level of bond issuance in history. How will it impact the crypto market?
Heavy supply may push yields higher, as Treasury financing needs outstrip demand. Higher yields increase the opportunity cost of holding non‑yielding assets like Bitcoin and Ethereum, potentially drawing capital away from crypto.
US Bonds Might Add to the Crypto Market’s Volatility
The whole narrative potentially boils down to foreign demand for US bonds. Overseas investors hold roughly one‑third of US debt.
Any reduction in appetite—whether due to tariffs or portfolio rebalances—could force the Treasury to offer even steeper yields. Rising yields tend to tighten global liquidity, making risk assets like cryptocurrencies less attractive.
When yields climb, equities and crypto can face selling pressure. For example, during the 2022 bond sell‑off, Bitcoin fell more than 50% alongside Treasury yields spiking. A repeat scenario could test crypto’s appeal.
Meanwhile, the US dollar’s strength could compound headwinds. As yields rise, the dollar typically gains. A stronger dollar makes Bitcoin’s USD‑denominated price more expensive for overseas buyers, dampening demand.
Yet crypto offers unique attributes. In periods of extreme monetary expansion, such as post‑pandemic, investors turned to Bitcoin as an inflation hedge.
Even if higher yields curb speculative flows, crypto’s finite supply and decentralized nature may sustain a baseline of buyer interest.
Technically, Bitcoin’s correlation to yields may weaken if Treasury issuance triggers broader macro volatility. When bond markets are hit by trade or fiscal policy shocks, traders may turn to digital assets to diversify since they don’t move in step.
However, that thesis hinges on continued institutional adoption and favorable regulation.
Crypto’s liquidity profile also matters. Large bond sales often drain bank reserves—tightening funding markets.
In theory, tighter liquidity could boost demand for DeFi protocols offering higher yields than traditional money markets.
Overall, record US debt supply points to higher yields and a stronger dollar—volatility for crypto as a risk asset.
Yet crypto’s inflation‑hedge narrative and evolving technical role in diversified portfolios could temper volatility. Market participants should watch foreign demand trends and liquidity conditions as key indicators for crypto’s next moves.
Disclaimer
In adherence to the Trust Project guidelines, BeInCrypto is committed to unbiased, transparent reporting. This news article aims to provide accurate, timely information. However, readers are advised to verify facts independently and consult with a professional before making any decisions based on this content. Please note that our Terms and Conditions, Privacy Policy, and Disclaimers have been updated.

XRP Price History Signals July As The Next Bullish Month
BANK Token Surges 150% After Binance Futures Listing

Asia’s First XRP Investment Fund is Here, Backed by Ripple

What Does This Mean for Altcoins?
How $31 Trillion in US Bonds Could Impact Crypto Markets in 2025

Ethereum Price Stalls In Tight Range – Big Price Move Incoming?

2.52 Million Altcoins Are Ruining Crypto’s Future

Animoca Brands Valuation Tanks 75% In Two Years, Here’s Why

Crypto exchange BingX hacked for $43 million

Are The Big Players Losing Interest?

Hong Kong’s Securities Association Tips Authorities On Crypto Self-Regulation

Coinbase cbBTC Set to go Live on Solana
2.52 Million Altcoins Are Ruining Crypto’s Future
Animoca Brands Valuation Tanks 75% In Two Years, Here’s Why
Crypto exchange BingX hacked for $43 million
Are The Big Players Losing Interest?
Hong Kong’s Securities Association Tips Authorities On Crypto Self-Regulation
Coinbase cbBTC Set to go Live on Solana
-

 Ethereum22 hours ago
Ethereum Whales Offload 143,000 ETH In One Week – More Selling Ahead?
-

 Market21 hours ago
Crypto Ignores ECB Rate Cuts, Highlighting EU’s Fading Influence
-

 Market20 hours ago
Binance Leads One-Third of the CEX Market in Q1 2025
-

 Altcoin19 hours ago
Dogecoin Price Breakout in view as Analyst Predicts $5.6 high
-

 Ethereum18 hours ago
Ethereum Investors Suffer More Losses Than Bitcoin Amid Ongoing Market Turmoil
-
 Market24 hours ago
Crypto Casino Founder Charged With Fraud in New York
-

 Market14 hours ago
Ethereum Price Fights for Momentum—Traders Watch Key Resistance
-
 Altcoin14 hours ago
Expert Predicts Pi Network Price Volatility After Shady Activity On Banxa