
Market
Bitcoin Price Dips After Rally—Is This the Perfect Entry Point?

Reason to trust
![]()
Strict editorial policy that focuses on accuracy, relevance, and impartiality
Created by industry experts and meticulously reviewed
The highest standards in reporting and publishing
Strict editorial policy that focuses on accuracy, relevance, and impartiality
Morbi pretium leo et nisl aliquam mollis. Quisque arcu lorem, ultricies quis pellentesque nec, ullamcorper eu odio.
Bitcoin price started a steady increase above the $85,500 zone. BTC is now correcting gains from $88,750 and might find bids near $86,500.
- Bitcoin started a decent recovery wave above the $85,000 zone.
- The price is trading above $86,500 and the 100 hourly Simple moving average.
- There is a connecting bullish trend line forming with support at $86,800 on the hourly chart of the BTC/USD pair (data feed from Kraken).
- The pair could start another increase if it clears the $87,500 and $88,000 levels.
Bitcoin Price Regains Traction
Bitcoin price remained stable above the $83,200 level. BTC formed a base and recently started a recovery wave above the $85,500 resistance level.
The bulls pushed the price above the $88,000 resistance level. However, the bears were active near the $88,800 resistance zone. A high was formed at $88,750 and the price corrected some gains. There was a move below the $88,000 level.
The price dipped below the 23.6% Fib retracement level of the upward move from the $83,665 swing low to the $88,750 high. Bitcoin price is now trading above $86,200 and the 100 hourly Simple moving average. There is also a connecting bullish trend line forming with support at $86,800 on the hourly chart of the BTC/USD pair.
On the upside, immediate resistance is near the $87,200 level. The first key resistance is near the $87,500 level. The next key resistance could be $88,000.

A close above the $88,000 resistance might send the price further higher. In the stated case, the price could rise and test the $88,800 resistance level. Any more gains might send the price toward the $89,500 level or even $90,000.
More Losses In BTC?
If Bitcoin fails to rise above the $87,500 resistance zone, it could start a fresh decline. Immediate support on the downside is near the $86,800 level and the trend line. The first major support is near the $86,200 level or the 50% Fib retracement level of the upward move from the $83,665 swing low to the $88,750 high.
The next support is now near the $85,500 zone. Any more losses might send the price toward the $85,000 support in the near term. The main support sits at $84,500.
Technical indicators:
Hourly MACD – The MACD is now losing pace in the bullish zone.
Hourly RSI (Relative Strength Index) – The RSI for BTC/USD is now above the 50 level.
Major Support Levels – $86,800, followed by $86,200.
Major Resistance Levels – $87,500 and $88,000.


A financial analyst has publicly criticized the use of global M2 money supply data to predict Bitcoin (BTC) price movements, calling such analyses mathematically unsound and misleading.
The criticism comes amid a surge in the global M2 money supply to an all-time high. Several analysts are forecasting similar trends for BTC.
Is Global M2 Money Data a Reliable Predictor for Bitcoin Price Movements?
The analyst, known as TXMCtrades, shared his thoughts on X (formerly Twitter). He specifically pointed to a chart by macro investor Raoul Pal that compared Bitcoin’s price to global M2.
TXMCtrades argued that charting global M2 daily or weekly is fundamentally flawed due to the inconsistent update frequencies of the underlying data. According to him, doing so distorts the information by amplifying short-term fluctuations instead of providing an accurate, long-term trend.
“People, you can’t create a daily or weekly time series of “Global M2” when the United States is only updating M2 on a weekly basis and all others are monthly!” the post read.
He explained that many countries have yet to update their figures beyond February, creating significant gaps in the dataset. TXMCtrades contended that this inconsistency results in a metric that largely reflects foreign exchange (FX) fluctuations rather than actual money supply dynamics.
“You’re looking at an M2 weighted inverse dollar exchange rate 95% of the time. Be better at math!” he added.
He also highlighted broader concerns about the misuse of global M2. The analyst stressed that China, which constitutes 46% of global M2, is the only major economy with a broad money supply above its post-COVID peak in dollar terms.
“They are currently trying to ease out of an ongoing multi-year debt deflation and doing a pretty shit job of it. Their M2 goes straight up,” TXMCtrades remarked.
Meanwhile, US M2 remains below its 2022 peak. In addition, the analyst emphasized that it is growing at its slowest pace since Bitcoin’s inception, excluding the 2022-2024 period. This suggests that the US is not experiencing rapid money supply growth, which could impact inflation or other economic trends.
This disparity, TXMCtrades argues, further undermines the reliability of global M2 as a predictor of Bitcoin price movements. The analyst also disputed the use of “random offsets” to align global M2 with Bitcoin price movements, a method employed by several analysts.
For instance, Raoul Pal has suggested a 12-week lag between global M2 and Bitcoin’s price. Meanwhile, Colin Talks Crypto proposes a 15.4-week lag. Meanwhile, Mr. Wall Street estimates the lag to be between 10.7 and 15 weeks. Some have even extended the M2 correlation to predict altcoin prices, such as Solana (SOL).
“SOL has been following Global M2 Money Supply (+100 days) its last two legs up. If this continues, SOL is set to pump massively within the next 2 weeks,” analyst Curb posted.
Nonetheless, the analyst stated that offsets are often arbitrary and don’t reflect the actual dynamics of money supply or asset prices.
“Money is money, it doesn’t have a wait time,” he claimed.
The analyst suggested that such models are overfitted to recent historical data and lack a strong foundation for forecasting. Lastly, TXMCtrades called for greater rigor in financial analysis. He urged analysts to “stop proliferating scammy analysis” and adopt more mathematically sound approaches to understanding cryptocurrency price dynamics.
Disclaimer
In adherence to the Trust Project guidelines, BeInCrypto is committed to unbiased, transparent reporting. This news article aims to provide accurate, timely information. However, readers are advised to verify facts independently and consult with a professional before making any decisions based on this content. Please note that our Terms and Conditions, Privacy Policy, and Disclaimers have been updated.

Reason to trust
![]()
Strict editorial policy that focuses on accuracy, relevance, and impartiality
Created by industry experts and meticulously reviewed
The highest standards in reporting and publishing
Strict editorial policy that focuses on accuracy, relevance, and impartiality
Morbi pretium leo et nisl aliquam mollis. Quisque arcu lorem, ultricies quis pellentesque nec, ullamcorper eu odio.
Ethereum price started a fresh decline below the $1,650 zone. ETH is now consolidating and might decline further below the $1,550 support zone.
- Ethereum started a fresh decline below the $1,650 and $1,620 levels.
- The price is trading below $1,600 and the 100-hourly Simple Moving Average.
- There is a new connecting bearish trend line forming with resistance at $1,600 on the hourly chart of ETH/USD (data feed via Kraken).
- The pair could start a fresh increase if it clears the $1,655 resistance zone.
Ethereum Price Faces Resistance
Ethereum price struggled to continue higher above $1,700 and started a fresh decline, like Bitcoin. ETH declined below the $1,620 and $1,600 support levels. It even spiked below $1,550.
A low was formed at $1,538 and the price is now correcting some losses. There was a move above the $1,565 level. The price climbed above the 23.6% Fib retracement level of the downward move from the $1,690 swing high to the $1,538 low.
Ethereum price is now trading below $1,600 and the 100-hourly Simple Moving Average. On the upside, the price seems to be facing hurdles near the $1,600 level. There is also a new connecting bearish trend line forming with resistance at $1,600 on the hourly chart of ETH/USD.
The next key resistance is near the $1,615 level or the 50% Fib retracement level of the downward move from the $1,690 swing high to the $1,538 low. The first major resistance is near the $1,650 level. A clear move above the $1,650 resistance might send the price toward the $1,690 resistance.

An upside break above the $1,690 resistance might call for more gains in the coming sessions. In the stated case, Ether could rise toward the $1,750 resistance zone or even $1,800 in the near term.
Another Decline In ETH?
If Ethereum fails to clear the $1,600 resistance, it could start another decline. Initial support on the downside is near the $1,560 level. The first major support sits near the $1,535 zone.
A clear move below the $1,535 support might push the price toward the $1,500 support. Any more losses might send the price toward the $1,420 support level in the near term. The next key support sits at $1,400.
Technical Indicators
Hourly MACD – The MACD for ETH/USD is losing momentum in the bearish zone.
Hourly RSI – The RSI for ETH/USD is now above the 50 zone.
Major Support Level – $1,535
Major Resistance Level – $1,650
Federal Reserve Chair Jerome Powell signaled on Tuesday that crypto banking regulations will be partially relaxed. He also made it seemingly clear that a near-term interest rate cut remains unlikely.
Speaking at the Economic Club of Chicago, Powell addressed mounting uncertainty stemming from trade policy and reinforced the central bank’s cautious stance.
Fed’s Powell Maitains a Hawkish Outlook
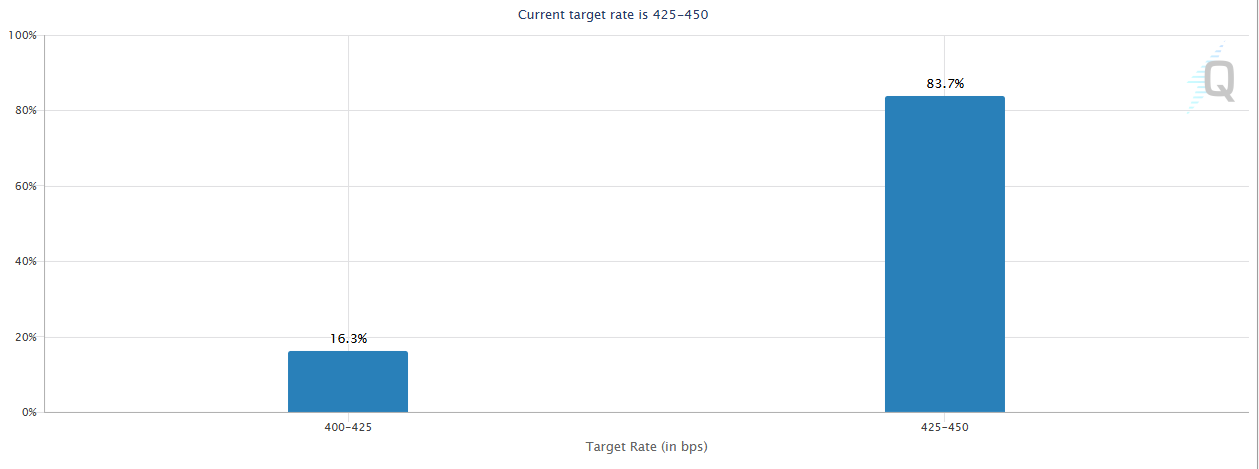
Powell’s remarks come as market expectations for a May rate cut have collapsed, with CME FedWatch data pricing in just a 16% chance. US equities dipped modestly following the speech. The equity market currently reflects investor disappointment over the lack of dovish signals.
“We should not rush to lower interest rates,” Powell said. “We have every reason to wait for more clarity before considering any changes to Fed policy.”
The crypto market, however, remained relatively steady. Rate cut optimism had already been priced out after last week’s hawkish FOMC minutes and cooler-than-expected CPI print.
Powell also offered direct comments on digital assets.
“Cryptocurrency is becoming more popular. A legal framework for stablecoins is a good idea.”
He added that the Federal Reserve supports relaxing certain banking regulations on crypto. The Feds agree that the sector is maturing and requires more defined oversight rather than constraint.
The dual message—no imminent policy easing but a positive outlook for crypto regulation—was met with a muted response across digital asset markets.
Bitcoin hovered near $84,500, showing resilience despite risk-off sentiment in equities. Powell acknowledged that economic growth had likely slowed at the start of 2025 and warned that Trump’s tariffs are a “key source of uncertainty.”
He also noted the Fed is not close to ending quantitative tightening and may need to make difficult policy choices if inflation resurges.
While the Fed reaffirmed its readiness to provide dollar liquidity to global central banks if needed, Powell dismissed the idea of a Fed “put.” He said the central bank’s independence is “a matter of law.”
For crypto markets, the regulatory tone was a silver lining in an otherwise hawkish macro environment.
Disclaimer
In adherence to the Trust Project guidelines, BeInCrypto is committed to unbiased, transparent reporting. This news article aims to provide accurate, timely information. However, readers are advised to verify facts independently and consult with a professional before making any decisions based on this content. Please note that our Terms and Conditions, Privacy Policy, and Disclaimers have been updated.

Bitcoin and Global M2 Money Supply: A Misleading Connection?

Semler Scientific Files To Buy $500-M In Bitcoin

77K Ethereum Moved to Derivatives—Is Another Price Crash Looming?

Ethereum Price Struggles to Rebound—Key Hurdles In The Way

No Rate Cut Soon, Crypto Banking Rules to Ease

XRP Dips To $1.97 – A Golden Opportunity Before The Next Rally?

2.52 Million Altcoins Are Ruining Crypto’s Future

Animoca Brands Valuation Tanks 75% In Two Years, Here’s Why

Crypto exchange BingX hacked for $43 million

Are The Big Players Losing Interest?

Hong Kong’s Securities Association Tips Authorities On Crypto Self-Regulation

Coinbase cbBTC Set to go Live on Solana
2.52 Million Altcoins Are Ruining Crypto’s Future
Animoca Brands Valuation Tanks 75% In Two Years, Here’s Why
Crypto exchange BingX hacked for $43 million
Are The Big Players Losing Interest?
Hong Kong’s Securities Association Tips Authorities On Crypto Self-Regulation
Coinbase cbBTC Set to go Live on Solana
-
 Altcoin17 hours ago
Mantra (OM) Price Pumps As Founder Reveals Massive Token Burn Plan
-
 Altcoin23 hours ago
Expert Reveals Current Status Of 9 Ripple ETFs
-

 Ethereum20 hours ago
Ethereum Breakout Imminent? Analyst Expects ETH Price Surge To $2,000
-

 Bitcoin24 hours ago
Is Bitcoin the Solution to Managing US Debt? VanEck Explains
-

 Bitcoin22 hours ago
China Liquidates Seized Crypto to Boost Struggling Treasury
-
 Altcoin22 hours ago
Bitcoin & Others Slip As Trump Imposes Up To 245% Tariff On China
-

 Market21 hours ago
Ethereum Price Dips Again—Time to Panic or Opportunity to Buy?
-

 Market19 hours ago
BNB Burn Reduces Circulating Supply by $916 Million
