
Market
Binance’s CZ Sparks TST Meme Coin Frenzy, Traders Reap Huge

Binance founder and former CEO Changpeng Zhao (CZ) inadvertently triggered a trading frenzy around a test token, TST. Interestingly, One lucky trader turned $35,000 into nearly $700,000, representing gains of almost 1,900%.
The news centers around Four.meme, which advertises as the first meme coin fair launch platform on Binance Smart Chain (BSC).
Binance’s CZ Claims Accidental Exposure
The incident stemmed from an educational video made by the BNB team demonstrating how to launch a meme token on the Four.meme platform. However, it resulted in an unexpected surge in the test token TST’s market capitalization.
Changpeng Zhao took to social media platform X (Twitter) to clarify how TST gained traction. He cited a now-deleted video tutorial posted on the Four.meme platform.
“In this video, we launched a token named TST as the example….,” CZ explained, citing a BNB Chain team member.
Following an accidental reveal by the BNB team, members of the Chinese crypto community identified the token and began actively trading and promoting it. CZ emphasized that neither he nor Binance exchange holds any of the tokens.
“This is NOT an endorsement from me for the token…no one on the team (or Binance) holds any of that token. This is NOT an official token by the BNB Chain team or anyone. It is a test token used just for that video tutorial,” he articulated.
Reportedly, a team member also deleted the private key for the tutorial wallet. However, this did little to stop speculators from jumping in, sending TST’s market cap to nearly $500,000 within hours.
Crypto analyst Ai shed light on an intriguing transaction. A trader, identified by the wallet address 0xeBB…74711c, purchased $35,000 worth of TST just minutes before CZ’s tweet. As the hype built up, the trader’s holdings skyrocketed to a floating profit of $657,000—a staggering 1,885% return. Ai speculated whether this was pure luck or if the trader had inside knowledge about the video leak.
“Lucky/smart money 0xeBB…74711c happened to open a position of 35,000 USD in tokens five minutes before CZ tweeted TST, andnow has a floating profit of 657,000 USD, with a return rate of 1885%! After CZ tweeted, he quickly added 2 BNB. He currently holds 28.82 million TST, making him the top 1 address. I am also impressed by his luck,” Ai remarked.
Adding to the speculation, crypto user 0xSun suggested that the address could be linked to a Binance Chain team member. This speculation fueled suspicions of potential insider trading.
Elliot’s Crypto, another industry veteran, pointed out that BNB community members saw an opportunity, piling in on the trade and fueling a meme-driven price surge.
“Let’s send it for the culture of BNB memes… I mean there could be huge opportunity on these levels. I had just a small bag at dip and still holding…it’s shared by BNB chain first on the video but community found the cat,” the user noted.
Meanwhile, CZ insists that the TST token was purely for demonstration purposes. Nevertheless, the incident reflects his and other industry leaders’ immense influence. Even an unintentional mention can send markets into a frenzy, reinforcing how unpredictable and volatile crypto markets remain.
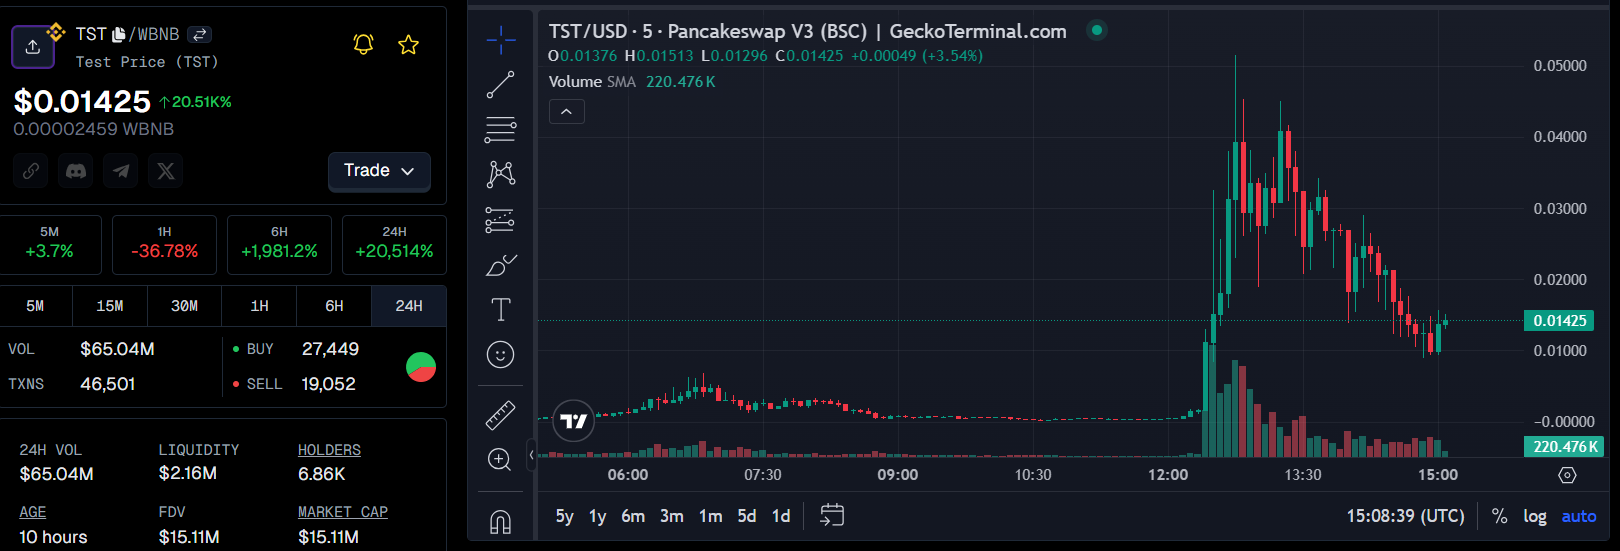
Data on Gecko Terminal shows that TST remains well above its debut price with a market cap of $15.1 million at press time, but the price action shows continued profit booking.
Rise of Token Launchpads and Regulatory Scrutiny
Notably, Four.meme is a BNB chain-based platform that allows users to easily create and launch meme coins. It comes amid a growing trend of token launchpads, which enable users to easily create and launch new cryptocurrencies.
The launchpad joins an already competitive space. Players such as Solana’s Pump.fun, Tron’s SunPump and PancakeSwap’s SpringBoard are already in the market, lowering the barriers for token creation and fostering an explosion of meme coins.
However, the increasing popularity of these platforms has drawn regulatory scrutiny. The UK’s Financial Conduct Authority (FCA) recently warned against Pump.fun. BeInCrypto reported that the regulator cautioned that it may be operating in violation of financial laws.
Additionally, Pump.fun has faced backlash for enabling harmful live streams. Here, bad actors exploited the platform to mislead and manipulate retail investors.
As token launchpads continue to grow, regulatory oversight is expected to increase. Authorities seek to prevent manipulation and protect investors from bad actors.
Disclaimer
In adherence to the Trust Project guidelines, BeInCrypto is committed to unbiased, transparent reporting. This news article aims to provide accurate, timely information. However, readers are advised to verify facts independently and consult with a professional before making any decisions based on this content. Please note that our Terms and Conditions, Privacy Policy, and Disclaimers have been updated.


Reason to trust
![]()
Strict editorial policy that focuses on accuracy, relevance, and impartiality
Created by industry experts and meticulously reviewed
The highest standards in reporting and publishing
Strict editorial policy that focuses on accuracy, relevance, and impartiality
Morbi pretium leo et nisl aliquam mollis. Quisque arcu lorem, ultricies quis pellentesque nec, ullamcorper eu odio.
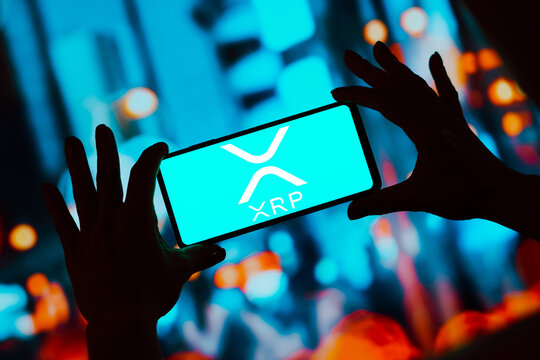
XRP has staged an impressive recovery to reclaim the $2 price level after plunging to a weekly low of $1.657 in a steep midweek correction. The rebound comes at a crucial time for the cryptocurrency, with analysts paying closer attention to historical price behaviors and bullish technical patterns. Among them is EGRAG CRYPTO, a popular XRP analyst on X, who believes that the cryptocurrency could be on the cusp of a monumental surge reminiscent of its previous bull cycles in 2017 and 2021.
The Power Of Time Cycles And Exponential Moving Averages
EGRAG’s technical analysis focuses on a recurring structure seen in XRP’s past cycles, using the 21-period Exponential Moving Average (EMA) and 33-period Moving Average (MA) on the biweekly timeframe. According to his analysis, which was revealed on social media platform X, both the 2017 and 2021 rallies were preceded by similar technical setups: a sustained bottoming process lasting around 770 days followed by a bullish reversal.
Related Reading
These phases were marked by what he described as “blow-off tops,” where XRP posted parabolic gains after bouncing off the 21 and 33 exponential moving averages. The current market structure, EGRAG noted, aligns closely with those previous cycles. After a prolonged bearish trend and a second recorded “bearish cross” in 2022, XRP has once again moved above both the 21 EMA and 33 MA.
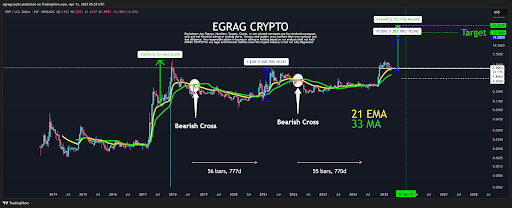
In his view, this sets the stage for a similar breakout scenario, one that could play out before the end of 2025. EGRAG uses this pattern to suggest a timeline of roughly 770 days from the last major crossover in early 2022, placing the projected breakout target around September 29, 2025.
XRP Can Surge To $45
Interestingly, EGRAG’s price prediction based on the premise of how a similar 2017 or 2021 movement can play out for XRP. In 2017, XRP posted a rally of approximately 2,700%, and in 2021, a slightly lower surge of about 1,050%. By mapping those gains onto the current price structure, EGRAG predicted two potential targets: a more conservative $19 level and a bold $45 level. Between these two targets is a mid-range target of $27 which he has previously favored.
Related Reading
However, the analyst warned that while chart patterns offer insight, they are not perfect predictors. In his own words, “Will it rhyme exactly? No, because if it were that easy, everyone would be a multimillionaire.” Still, the emotional patterns of market participants, human reactions and behaviors, tend to repeat to create opportunities where a previous price action might play out again, even if not 100%.
The analyst ended his analysis with a strategic note to long-term holders and short-term traders alike, consider a Dollar-Sell-Average (DSA) approach when the XRP price starts to climb.
At the time of writing, XRP is trading at $2.04, up by 2.6% in the past 24 hours.
Featured image from Adobe Stock, chart from Tradingview.com

Solana plunged to a 12-month low of $95.23 on April 7, marking a sharp decline amid broader market turbulence.
However, as the market embarked on a recovery this week, SOL has witnessed a rebound, with its price climbing as demand surges.
SOL Rebounds 17%, Eyes Further Gains
Since SOL began its current rally, its value has soared by 17%. At press time, the altcoin trades at $124.58, resting atop an ascending trend line.
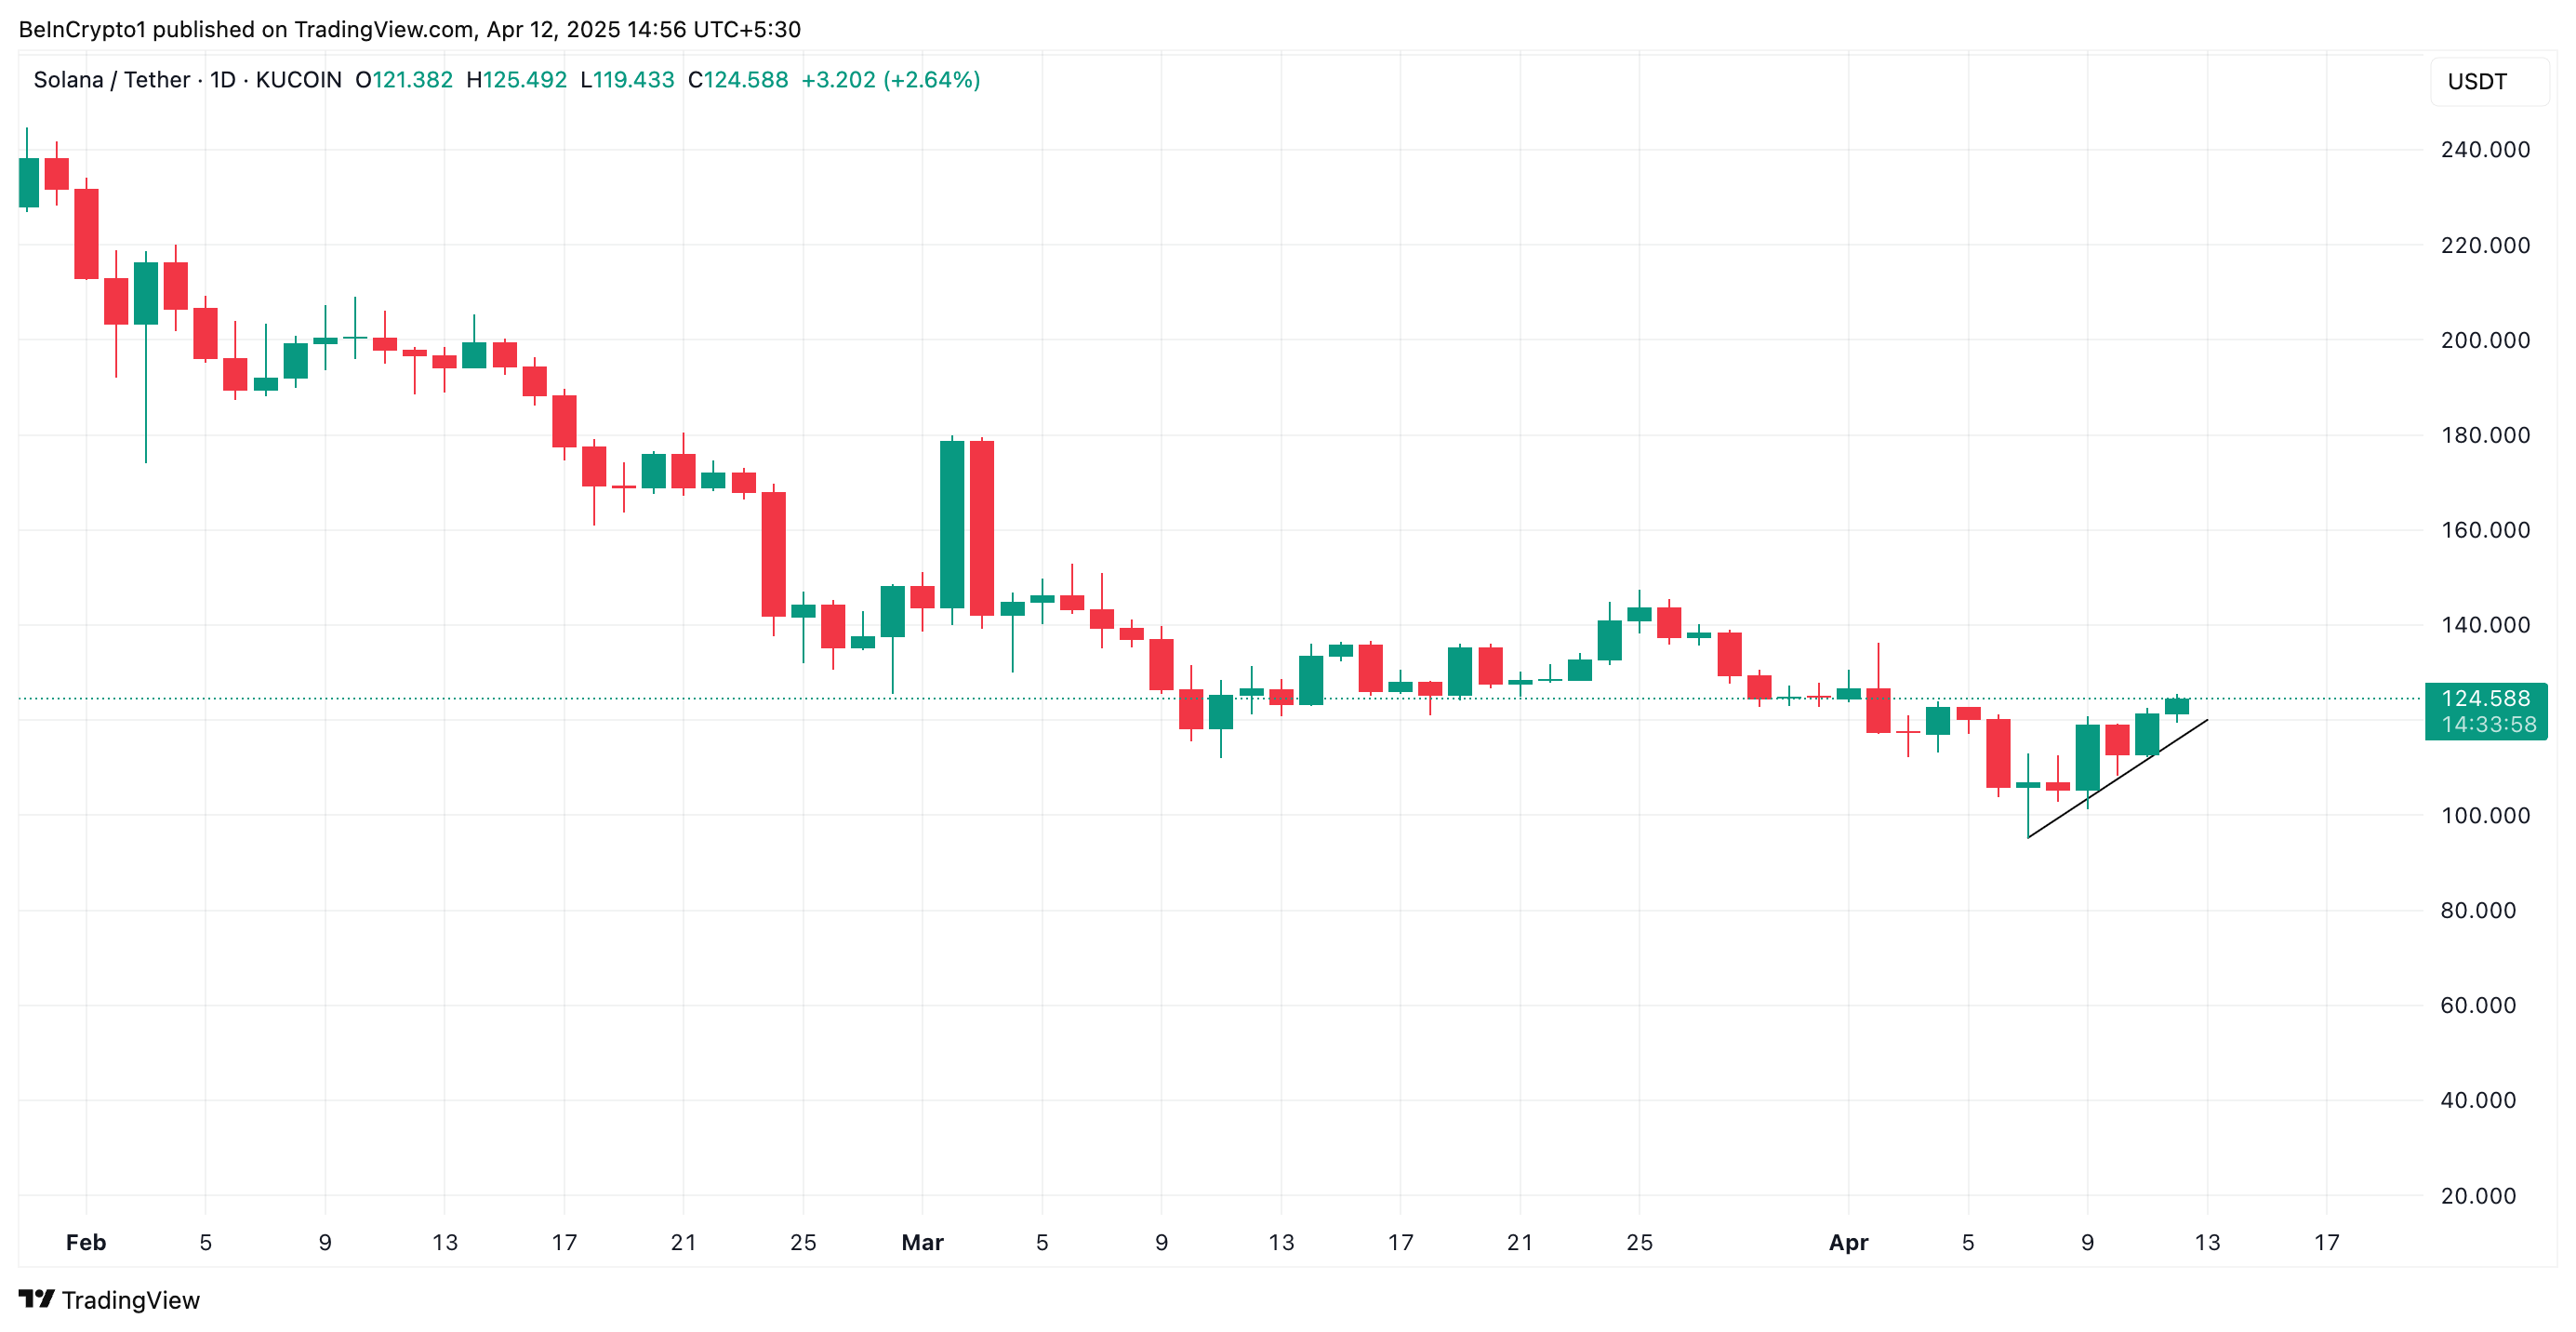
This pattern emerges when the price of an asset consistently makes higher lows over a period of time. It represents an uptrend, indicating that SOL demand is gradually increasing, driving its prices higher. It suggests that the coin buyers are willing to pay more, and it serves as a support level during price corrections.
SOL’s recovery is further supported by its rising Relative Strength Index (RSI), indicating increasing buying interest. This momentum indicator is at 49.58 at press time, poised to break above the 50-neutral line.
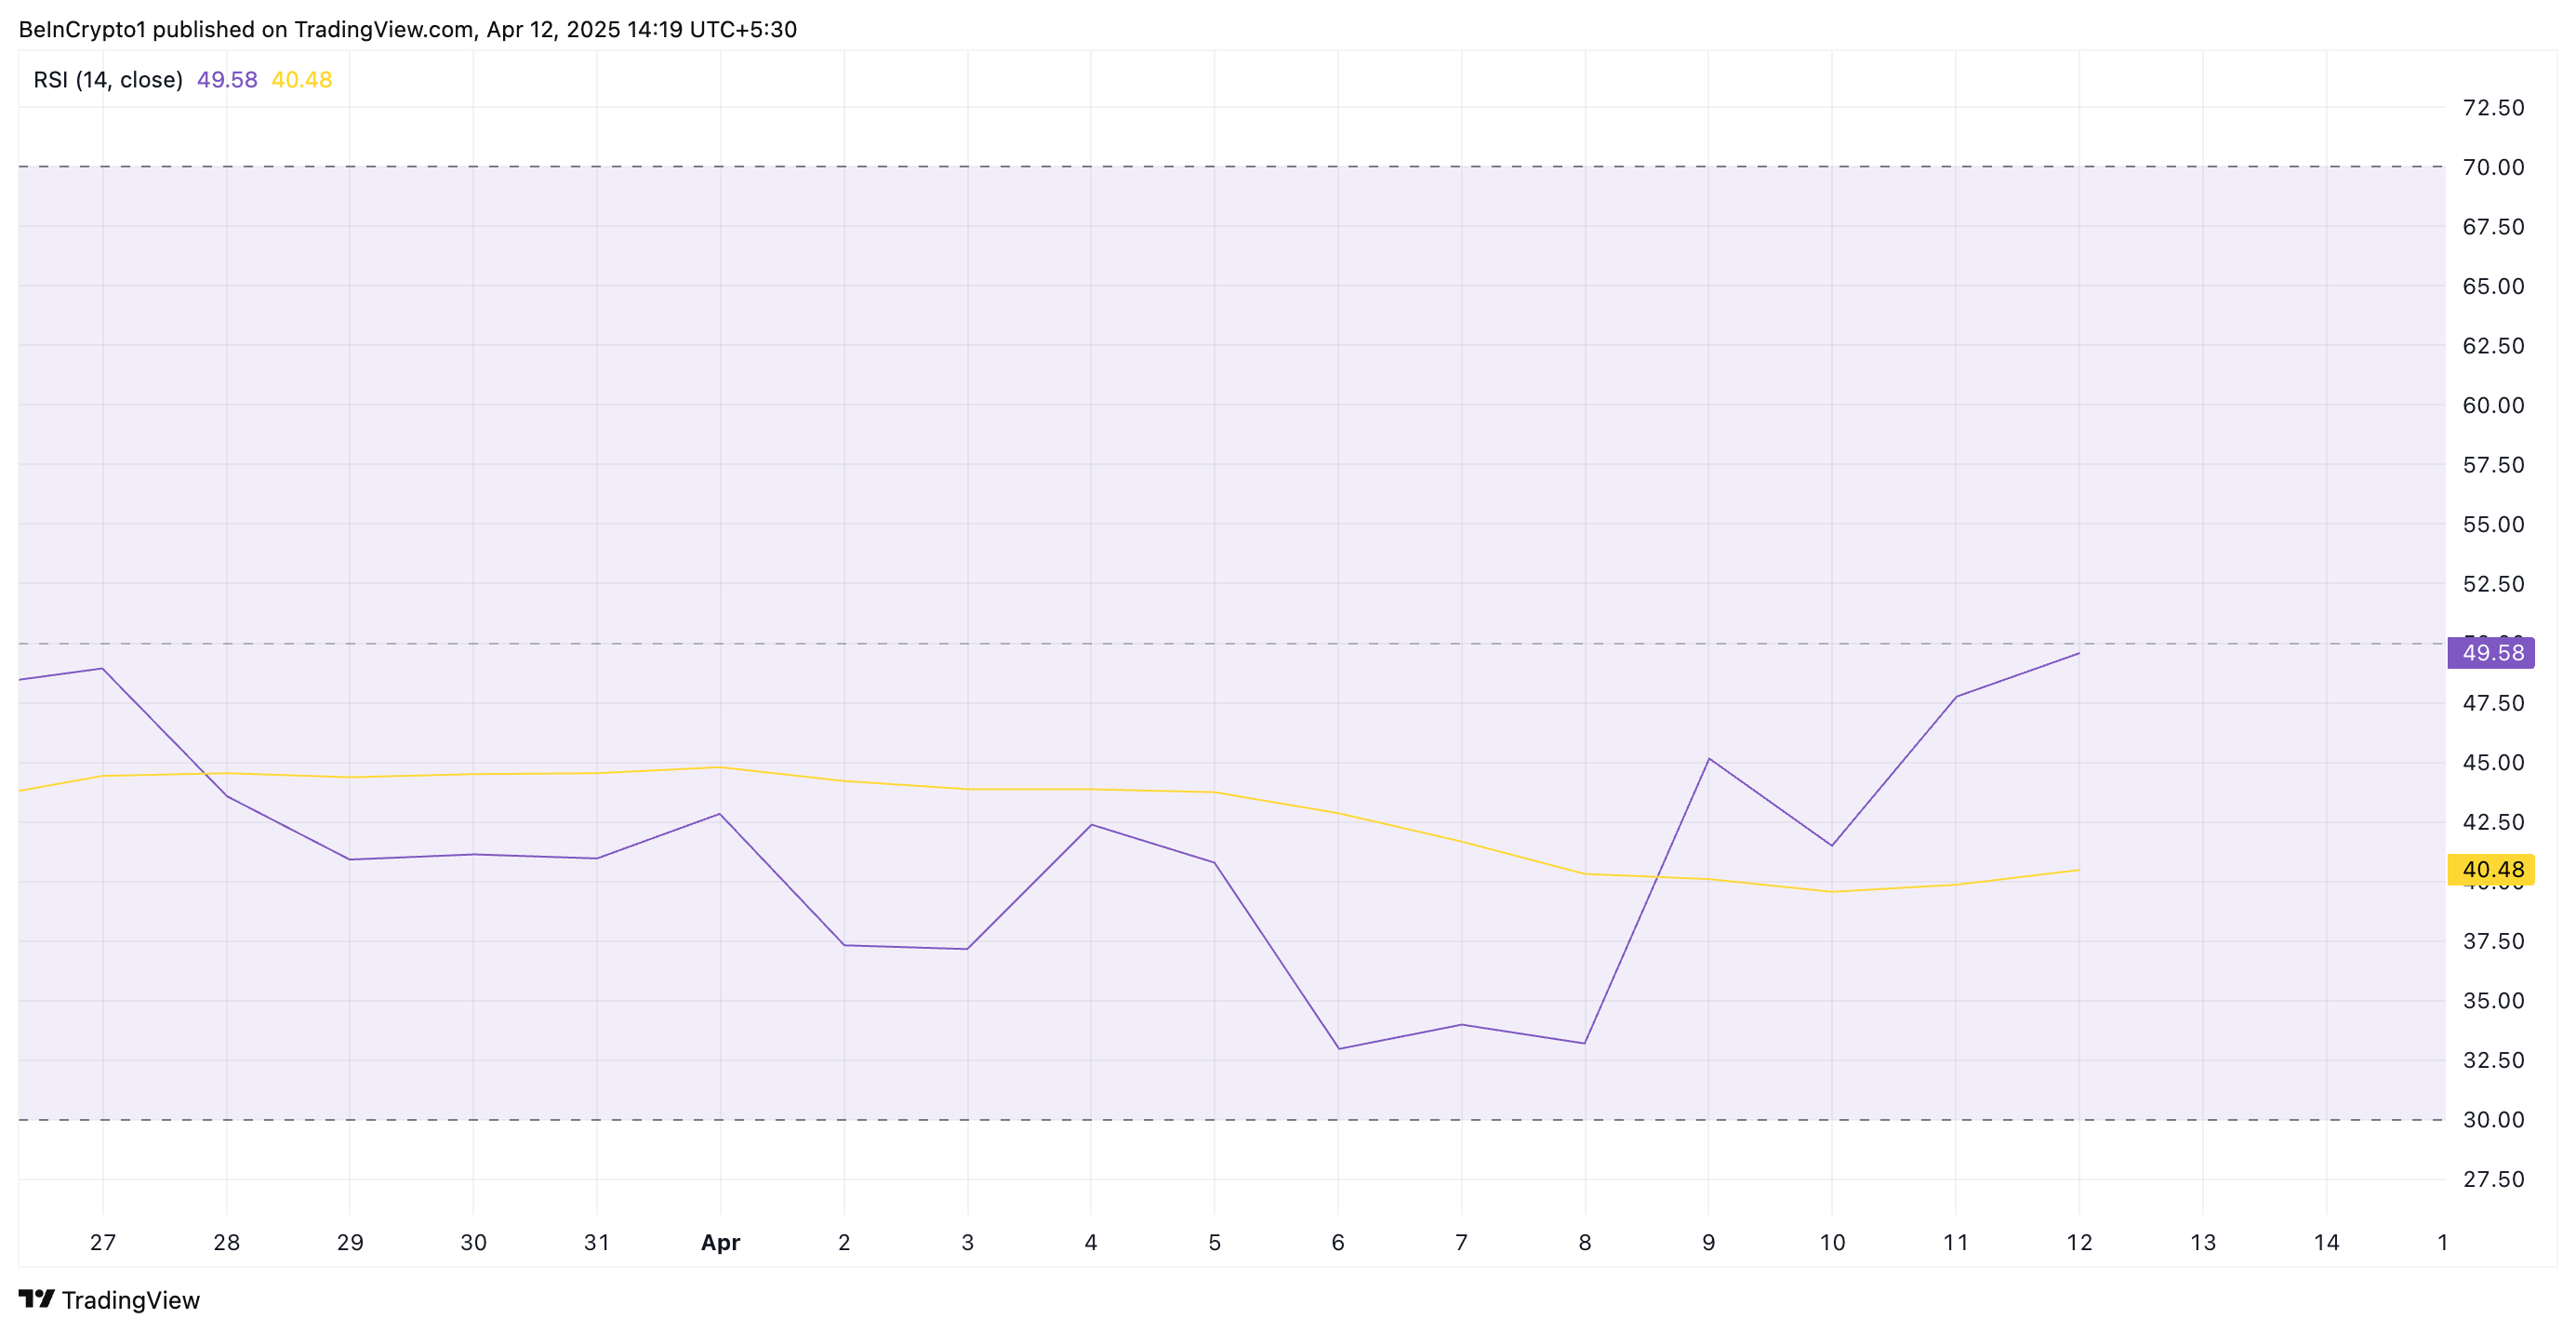
The RSI indicator measures an asset’s overbought and oversold market conditions. It ranges between 0 and 100. Values above 70 suggest that the asset is overbought and due for a price decline, while values under 30 indicate that the asset is oversold and may witness a rebound.
At 49.50 and climbing, SOL’s RSI signals a steady shift in momentum from bearish to bullish. A rise above 50 would confirm increasing buying pressure and a potential for a sustained upward price movement.
Solana Bulls Eye $138
SOL’s ascending trend line forms a solid support floor below its price at $120.74. If demand soars and the bullish presence with the SOL spot markets strengthens, the coin could continue its rally and climb to $138.41.
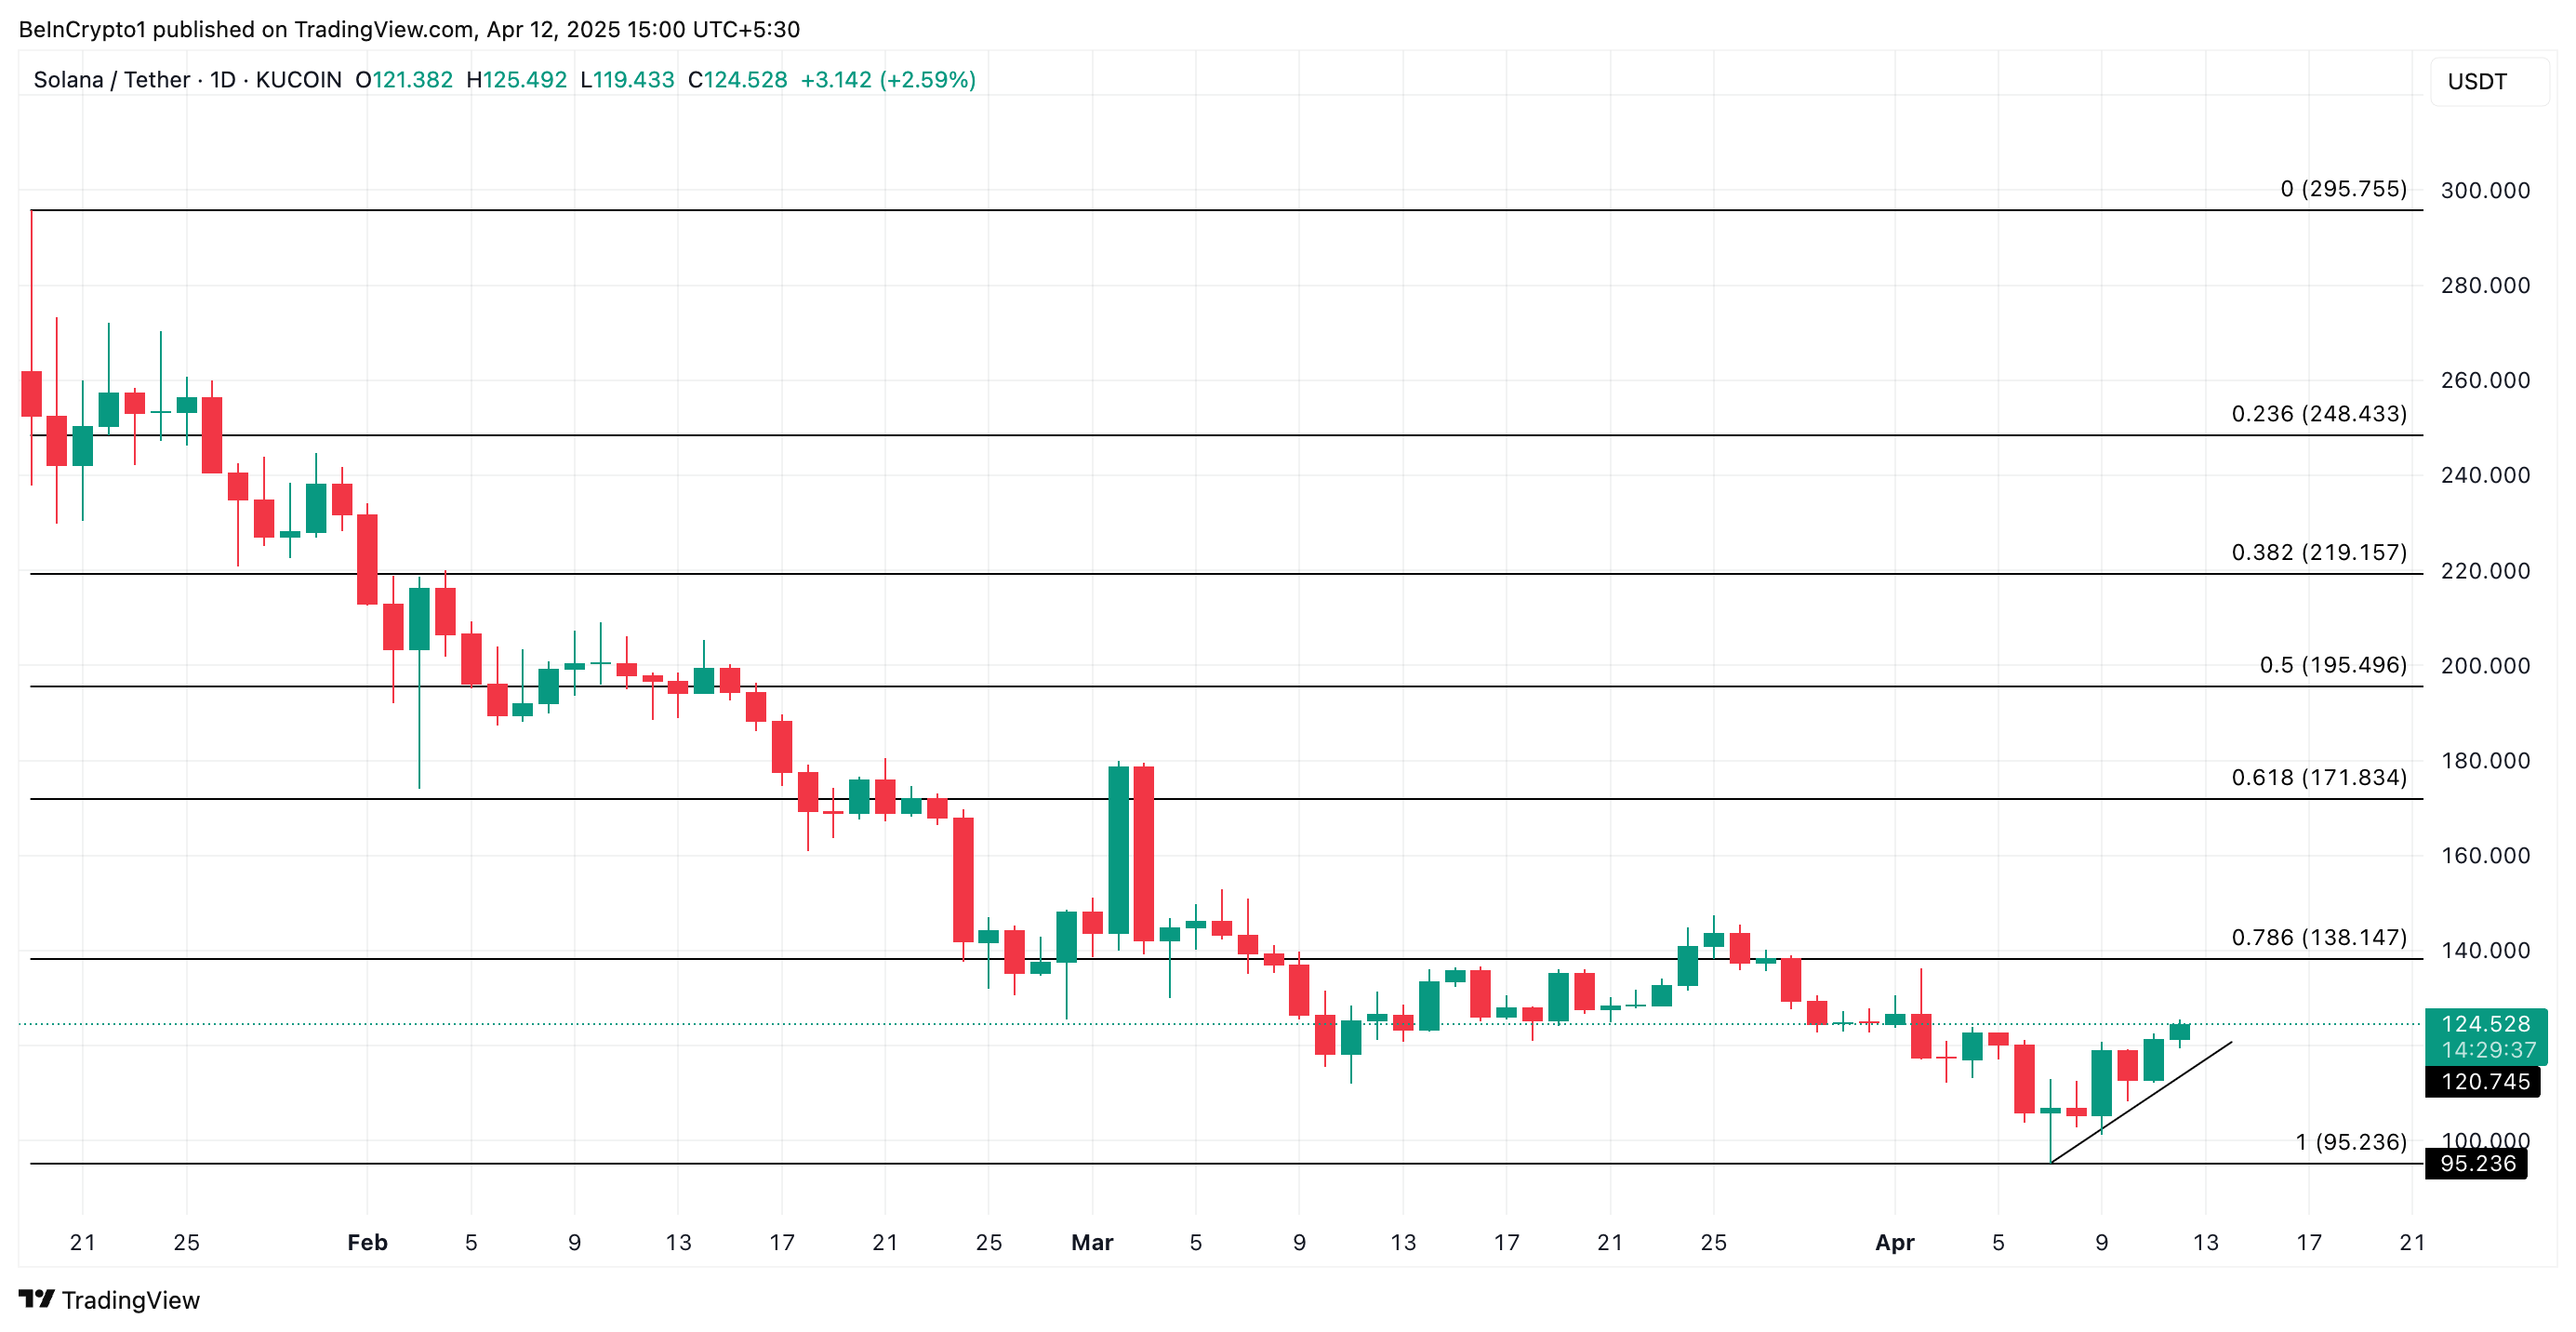
However, if profit-taking commences, the support at $120.74 would be breached, and the SOL’s price could revisit $95.23.
Disclaimer
In line with the Trust Project guidelines, this price analysis article is for informational purposes only and should not be considered financial or investment advice. BeInCrypto is committed to accurate, unbiased reporting, but market conditions are subject to change without notice. Always conduct your own research and consult with a professional before making any financial decisions. Please note that our Terms and Conditions, Privacy Policy, and Disclaimers have been updated.

Ripple’s long-running legal clash with the US Securities and Exchange Commission (SEC) appears to be nearing its final chapter.
However, a surprising detail has emerged from the ongoing settlement talks, which could see Ripple pay its reduced $50 million penalty using its native token, XRP.
Ripple Could Use XRP Token to Pay SEC Fine
On April 11, Ripple CEO Brad Garlinghouse appeared on FOX Business. At the interview, he revealed that the idea of paying the penalty in XRP was floated during settlement discussions.
“The SEC is going to end up with $50 million and the US government gets $50 million and we talked about making that available in XRP,” Garlinghouse stated.
The ongoing negotiations follow Ripple’s and the SEC’s decision to drop their appeals, bringing the multi-year legal battle closer to closure.
“We’re moving past the SEC’s war on crypto and entering the next phase of the market – true institutional flows integrating with decentralized finance,” Garlinghouse added in a post on X.
Judge Analisa Torres originally set the fine at $125 million in 2024, linking it to Ripple’s unregistered XRP sales to institutional investors. Ripple complied by placing the funds in an interest-bearing account, but the appeals process delayed any further action.
With those appeals now abandoned, Ripple is expected to pay a reduced fine of $50 million.
A recent joint court filing confirms that both sides have reached a preliminary agreement. They are now seeking final approval from the SEC’s commissioners.
Once internal reviews are complete, the parties plan to request a formal ruling from the district court.
“There is good cause for the parties’ joint request that this Court put these appeals in abeyance. The parties have reached an agreement-in-principle, subject to Commission approval, to resolve the underlying case, the Commission’s appeal, and Ripple’s cross-appeal. The parties require additional time to obtain Commission approval for this agreement-in-principle, and if approved by the Commission, to seek an indicative ruling from the district court,” the filing stated.
If the commission votes in favor, this case could conclude one of the most closely watched regulatory battles in crypto history. More importantly, the use of XRP for the settlement could mark a significant shift in the SEC’s approach to digital assets.
This turnaround would represent a major regulatory shift and could trigger further bullish momentum for the token.
Since Donald Trump’s election victory in November 2024, investor confidence in XRP has grown sharply, pushing the token’s value up by more than 300%.
At the same time, institutional interest continues to rise, as seen in the wave of spot exchange-traded fund applications tied to the token
Market analysts have linked this performance to the friendlier political climate. They also point to the potential reclassification of XRP as a commodity as a key factor driving the asset’s rise.
Disclaimer
In adherence to the Trust Project guidelines, BeInCrypto is committed to unbiased, transparent reporting. This news article aims to provide accurate, timely information. However, readers are advised to verify facts independently and consult with a professional before making any decisions based on this content. Please note that our Terms and Conditions, Privacy Policy, and Disclaimers have been updated.

Ethereum Price Suffers 77% Crash Against Bitcoin, On-Chain Deep Dive Reveals Reasons Why

Ethereum Slips Below ‘Mayer Multiple’ Level That Preceded Last Rally To $4,000

Shiba Inu Price on The Verge of Breaking $0.00002

Bitcoin Price Volatility Far Lower Than During COVID-19 Crash — What This Means

Ethereum (ETH) Consolidates Within Tight Range As Key Support Level Forms

XRP Price To Hit $45? Here’s What Happens If It Mimics 2017 And 2021 Rallies

2.52 Million Altcoins Are Ruining Crypto’s Future

Animoca Brands Valuation Tanks 75% In Two Years, Here’s Why

Crypto exchange BingX hacked for $43 million

Are The Big Players Losing Interest?

Hong Kong’s Securities Association Tips Authorities On Crypto Self-Regulation

Coinbase cbBTC Set to go Live on Solana
2.52 Million Altcoins Are Ruining Crypto’s Future
Animoca Brands Valuation Tanks 75% In Two Years, Here’s Why
Crypto exchange BingX hacked for $43 million
Are The Big Players Losing Interest?
Hong Kong’s Securities Association Tips Authorities On Crypto Self-Regulation
Coinbase cbBTC Set to go Live on Solana
-

 Altcoin16 hours ago
Binance Issues Important Update On 10 Crypto, Here’s All
-

 Market17 hours ago
Arthur Hayes Expects Bitcoin Surge if Fed Injects Liquidity
-
 Altcoin15 hours ago
Solana Meme Coin Fartcoin Price Could Hit $1.29 If It Holds This Key Level
-

 Ethereum22 hours ago
Ethereum’s True Value? Lower Than You Think
-
 Market14 hours ago
Crypto Whales Position for Gains with DOGE, WLD and ONDO
-

 Market12 hours ago
Ethereum ETFs See Seventh Consecutive Week of Net Outflows
-
 Bitcoin11 hours ago
Bitcoin’s Impact Alarming, Says NY Atty. General—Congress Needs To Act
-
 Altcoin18 hours ago
Shiba Inu Burn Rate Explodes 1000%, Can SHIB Price Hit $0.000015?