
Market
Berachain (BERA) Struggles at $6 Despite Weaker Bearish Signals

Berachain (BERA) is currently trading around $6.05, with a market cap sitting near $653 million, after pulling back from a recent high of $7.08 reached on March 17.
The asset has been consolidating after the recent price drop, as technical indicators suggest mixed signals. While bearish trends are still present, some early signs of bullish momentum are starting to emerge.
Berachain RSI Shows A Bullish Momentum Could Appear Soon
Berachain is showing signs of stabilizing after recent volatility, with its RSI currently sitting at 52, up from 35 just two days ago.
This rebound follows a sharp decline from an overbought level of 70.5, which was reached four days ago before the RSI cooled off.
The rise back above 50 suggests that bullish momentum is starting to regain some control after the recent correction, though the market remains relatively balanced between buyers and sellers for now.
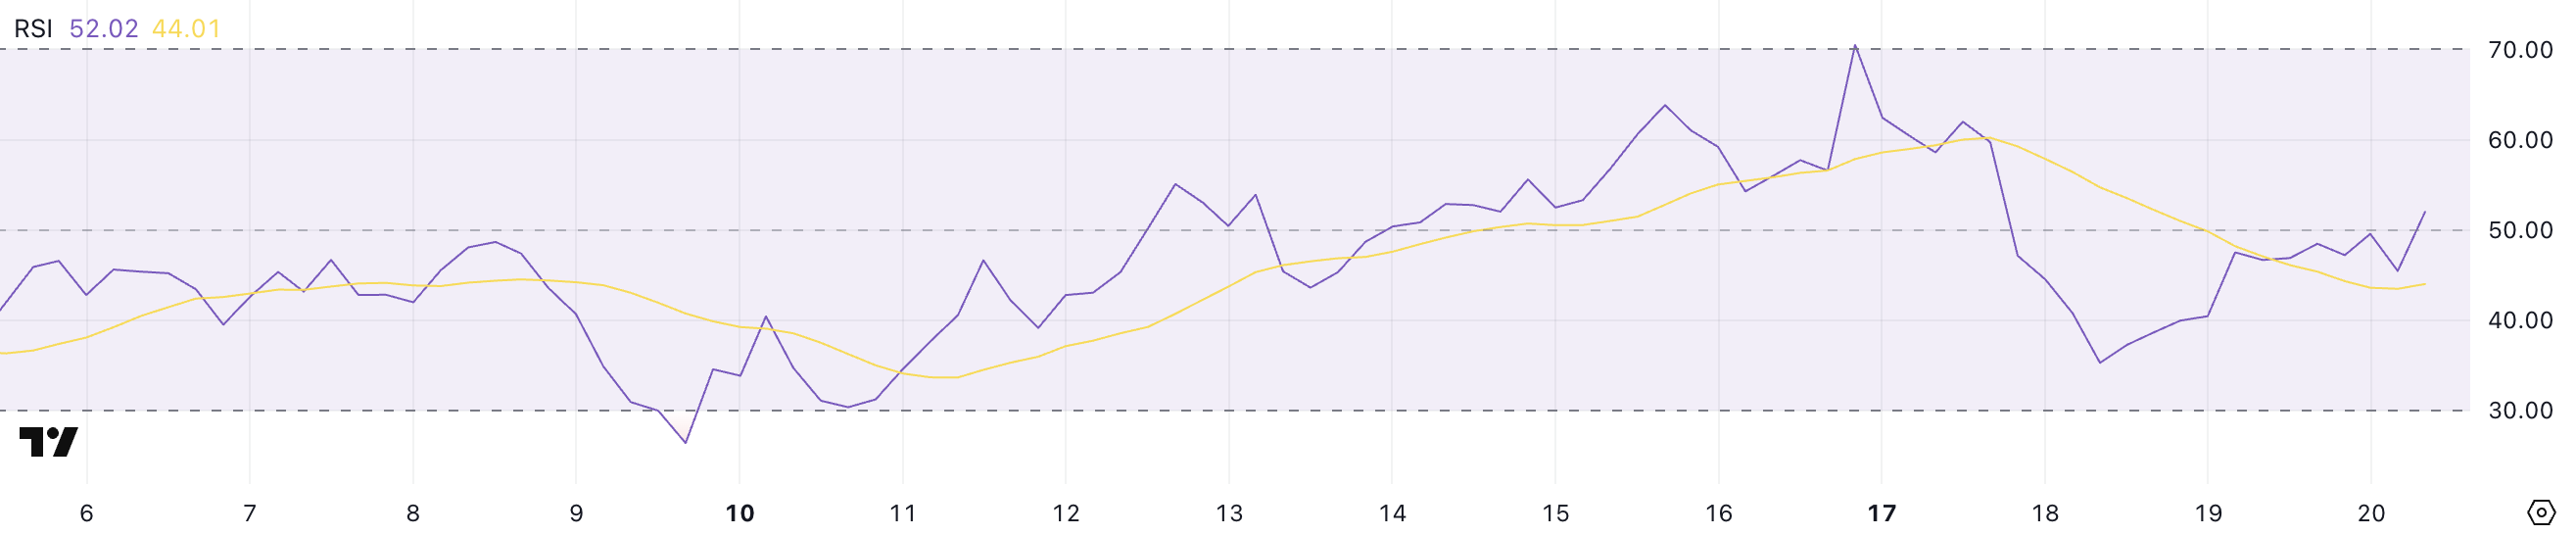
The RSI (Relative Strength Index) is a momentum oscillator that measures the speed and magnitude of recent price changes, helping to identify potential overbought or oversold conditions.
Typically, an RSI above 70 signals that an asset might be overbought and due for a pullback, while an RSI below 30 points to oversold conditions, which could precede a price bounce.
With BERA’s RSI at 52, it is now in neutral territory, signaling neither an overbought nor an oversold condition. This suggests that while the selling pressure has eased, buyers still need to build more momentum to drive a sustained uptrend.
BERA CMF Is Rising, But Buying Pressure Is Still Building
Berachain CMF is currently at -0.01, an improvement from -0.23 yesterday, indicating that selling pressure has started to ease.
However, despite this slight recovery, the CMF is still hovering in negative territory, suggesting that the market is not yet seeing strong capital inflows.
What’s notable is that BERA’s CMF hasn’t climbed above 0.10 since March 14, signaling a prolonged period of weak buying volume and cautious investor sentiment.
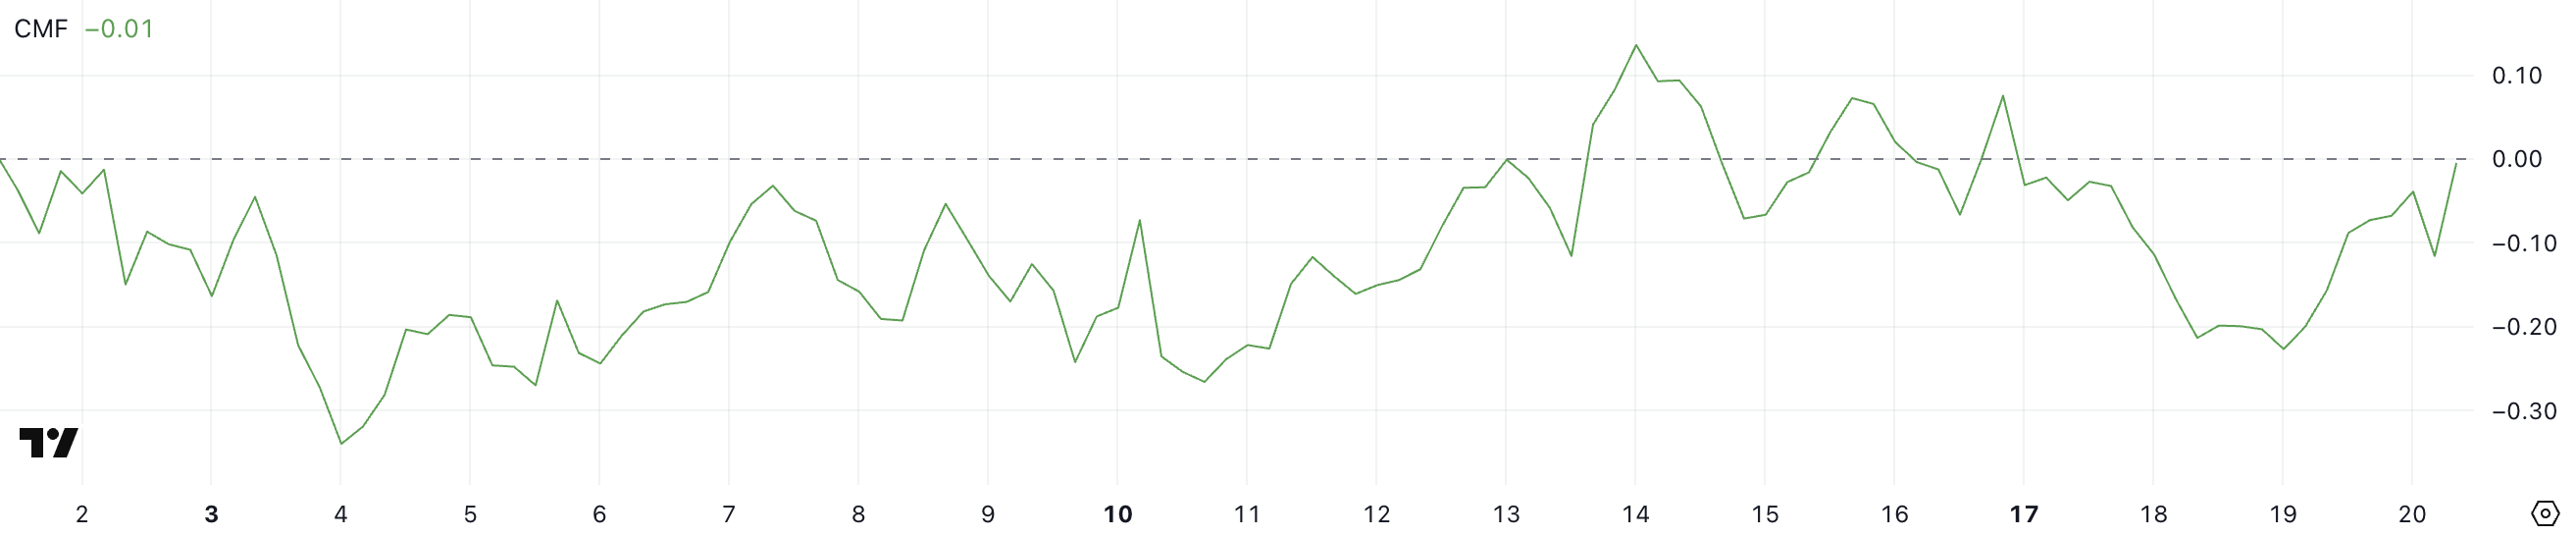
The Chaikin Money Flow (CMF) is a volume-based indicator that measures the flow of money into and out of an asset over a given period.
Values above 0 indicate buying pressure or accumulation, while values below 0 signal selling pressure or distribution. With BERA’s CMF still near neutral but below zero, it shows that while sellers are losing momentum, buyers have yet to take control firmly.
Until the CMF pushes decisively into positive territory – particularly above 0.10 – any upward price movement may struggle to sustain itself without stronger capital inflows.
Can Berachain Surge To $7?
Berachain EMA lines continue to reflect a bearish setup, with short-term moving averages positioned below the long-term ones.
This indicates that downward momentum still dominates the market. However, if Berachain manages to reverse this trend and build bullish momentum, the price could first target the resistance around $7.14.
A breakout above this level could open the door for a move toward $7.50 or even $8, a price level not seen since March 3.
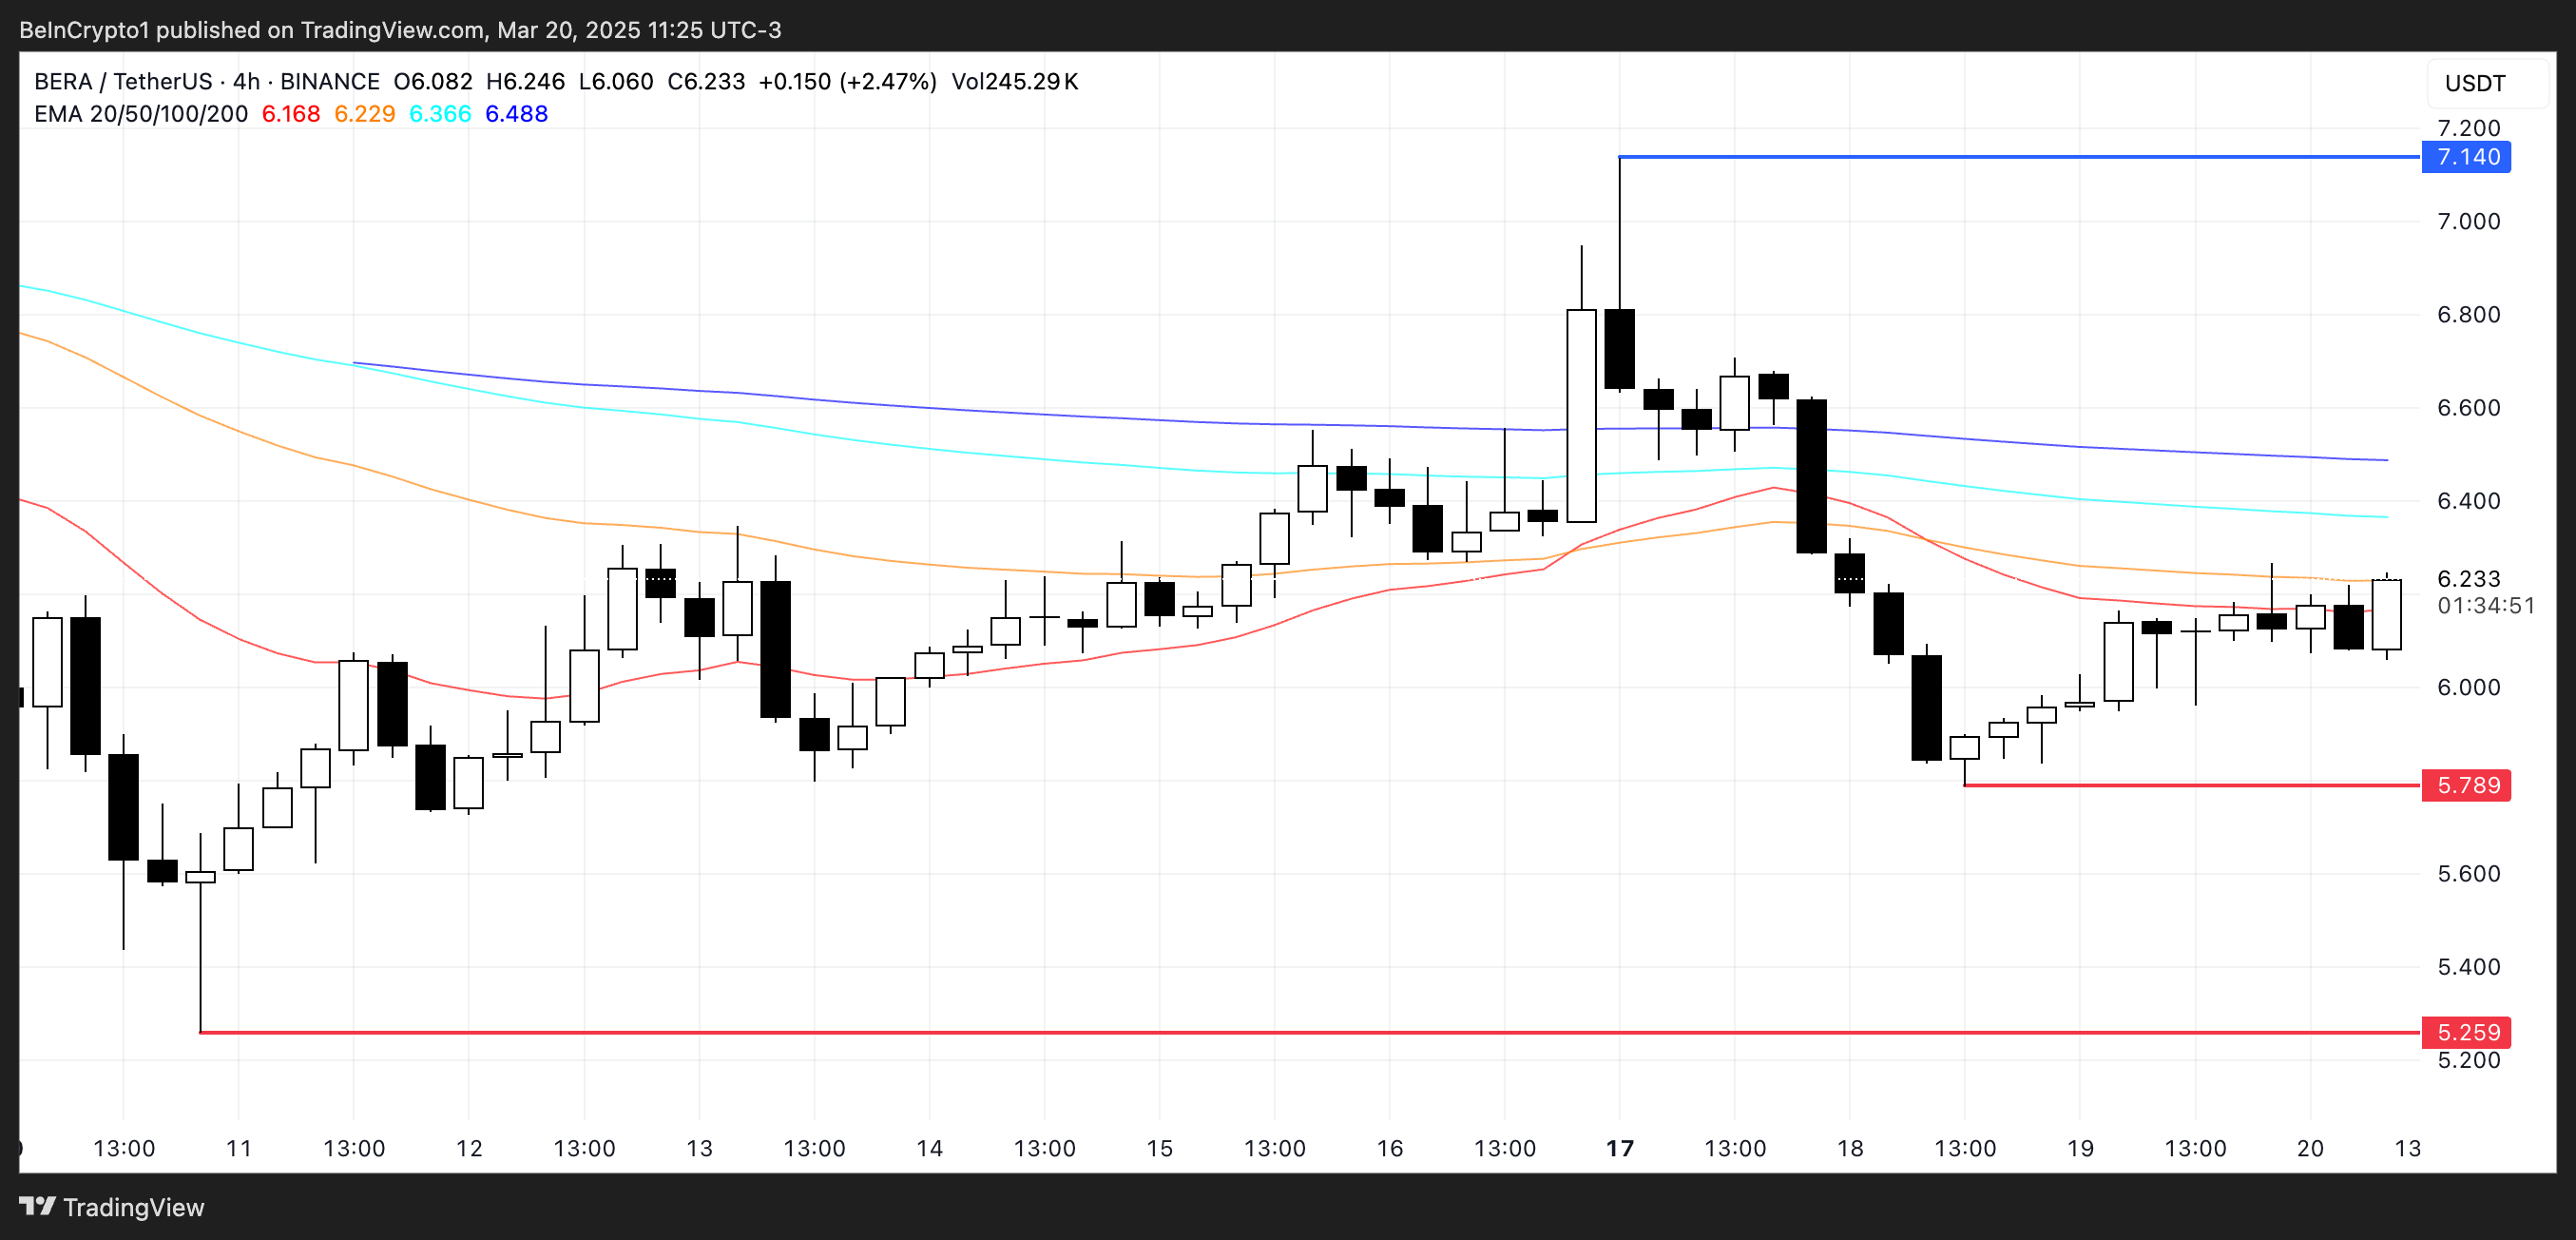
On the downside, if BERA fails to establish an uptrend and bearish momentum persists, the price could fall back to test the key support at $5.78.
Losing this level would likely deepen the bearish outlook, potentially driving Berachain price lower toward $5.25 in the near term.
For now, the EMA alignment suggests that sellers still have the upper hand, but a shift in momentum could quickly change the market structure and trigger a rally.
Disclaimer
In line with the Trust Project guidelines, this price analysis article is for informational purposes only and should not be considered financial or investment advice. BeInCrypto is committed to accurate, unbiased reporting, but market conditions are subject to change without notice. Always conduct your own research and consult with a professional before making any financial decisions. Please note that our Terms and Conditions, Privacy Policy, and Disclaimers have been updated.


Ethena Labs is officially closing its German branch and EU operations after a previous MiCA application rejection. For the past month, the firm has been preparing to withdraw from this market.
Although the exit was anticipated, ENA reacted notably, with the altcoin falling over 7% after today’s announcement.
Ethena Labs Failed MiCA Effort
Ethena Labs has been facing continued regulatory difficulties in Europe. In late March, German authorities rejected Ethena’s application for MiCA compliance.
At the time, the firm suggested that this was a minor setback and that it would focus on other markets. Today, it announced that its German branch is winding down altogether.
“We have agreed with BaFin to wind down all activities of Ethena GmbH and will no longer be pursuing the MiCAR authorization in Germany. All whitelisted… users previously interacting with Ethena GmbH have at their request been onboarded with Ethena (BVI) Limited instead. As a result, Ethena GmbH no longer has any direct customers,” it claimed.
The statement further claimed that Ethena GmbH, the German branch, “has not conducted any mint or redeem activity” since the regulators’ MiCA ruling.
Specifically, regulators banned all sales of the USDe stablecoin, putting serious restrictions on the firm. In other words, this outcome is fairly expected. Ethena (BVI) Limited has taken over the German branch’s users.
The network’s governance token, ENA, has seen notable price swings around its MiCA efforts. In Early March, when Ethena Labs was reportedly on track to receive regulatory approval, ENA broke out of multi-month lows and nearly reached $2.5 billion in mark cap.
However, since the rejection, ENA saw continued bearish pressure, which was exacerbated by the macroeconomic conditions across the market. Today’s announcement drove further decline.

MiCA, the European Union’s new stablecoin regulations, have presented difficulties for several firms besides Ethena. For example, Tether’s stablecoins were delisted from EU exchanges when MiCA took effect, prompting serious changes to its business.
Several other issuers have been racing to fill the gap left by these firms by achieving compliance. Most recently, major centralized exchanges such as Crypto.com and OKX have achieved the license, further strengthening their grasp over the EU market.
Disclaimer
In adherence to the Trust Project guidelines, BeInCrypto is committed to unbiased, transparent reporting. This news article aims to provide accurate, timely information. However, readers are advised to verify facts independently and consult with a professional before making any decisions based on this content. Please note that our Terms and Conditions, Privacy Policy, and Disclaimers have been updated.

Hedera (HBAR) has lost its $7 billion market cap as bearish momentum builds. Trading volume is down 25% in the last 24 hours to $203 million. Key technical indicators are weakening, pointing to growing pressure on the current trend.
The BBTrend has dropped below 10, the RSI is now under 50, and a potential death cross looms on the EMA lines. Unless buying pressure returns soon, HBAR could face deeper corrections in the near term.
Hedera BBTrend Is Still Positive, But Going Down
Hedera’s BBTrend has dropped to 5.84, falling sharply from 11.99 just two days ago. The BBTrend, or Bollinger Band Trend indicator, measures the strength of a trend based on how far the price deviates from its average range.
Readings above 10 typically signal a strong and active trend, while lower values suggest weakening momentum or consolidation.

With BBTrend now sitting below the 10 threshold, it may indicate that Hedera’s recent bullish momentum is losing strength.
The lower reading suggests price volatility is decreasing, which could mean the asset is entering a sideways phase or preparing for a potential pullback.
Unless BBTrend picks up again, HBAR might struggle to sustain upward movement in the short term.
Hedera Is Losing Bullish Momentum
Hedera’s RSI is currently at 44.67, down from 63.12 just three days ago, signaling a notable loss in bullish momentum. The Relative Strength Index (RSI) is a momentum oscillator that measures the speed and magnitude of recent price changes.
It ranges from 0 to 100, with values above 70 typically indicating overbought conditions and values below 30 suggesting the asset is oversold.
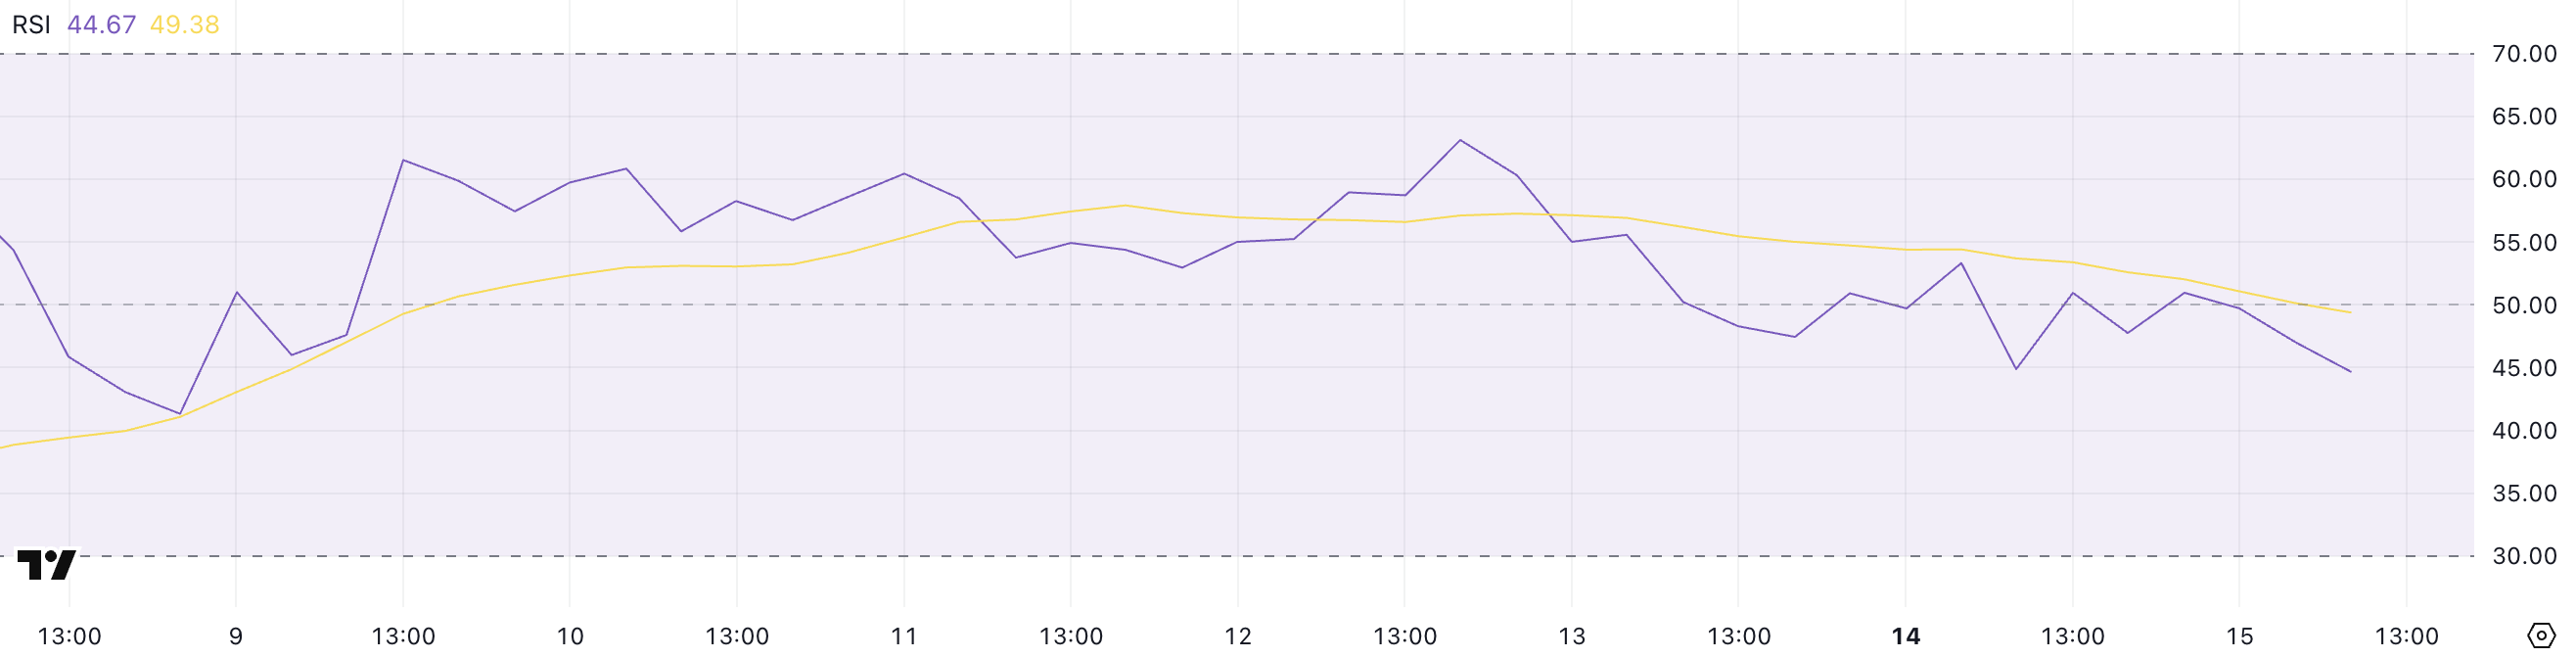
With RSI now below the neutral 50 mark, it suggests that sellers are gaining more control. An RSI around 44.67 points to weakening demand and could mean that HBAR is entering a consolidation phase or facing mild downward pressure.
If the RSI continues to fall, it could lead to a deeper correction unless buyers step back in.
Will Hedera Fall Below $0.15?
Hedera’s EMA lines are signaling a potential death cross, a bearish formation that could lead to increased downside pressure. If this pattern is confirmed, Hedera price may first test two nearby support levels at $0.156 and $0.153.
These levels have recently acted as short-term cushions, and losing them could trigger a sharper drop.

A breakdown below both supports could open the way toward $0.124, especially if selling momentum accelerates. On the flip side, if HBAR can regain strength and push above the $0.168 resistance, it could shift sentiment back in favor of the bulls.
A breakout there may lead to further gains toward $0.178 and potentially $0.20 if the uptrend builds enough momentum.
Disclaimer
In line with the Trust Project guidelines, this price analysis article is for informational purposes only and should not be considered financial or investment advice. BeInCrypto is committed to accurate, unbiased reporting, but market conditions are subject to change without notice. Always conduct your own research and consult with a professional before making any financial decisions. Please note that our Terms and Conditions, Privacy Policy, and Disclaimers have been updated.
Solana (SOL) is up 20% over the past seven days, supported by strong technical indicators and rising on-chain activity. Its Ichimoku Cloud and BBTrend charts both point to bullish momentum, with trend strength and volatility on the rise.
At the same time, Solana is reclaiming the top spot in DEX volume and dominating protocol fee rankings across major DeFi apps. With a recent golden cross on the EMA lines, SOL now looks set to test key resistance levels if momentum holds.
Solana Indicators Paint A Bullish Picture
Solana Ichimoku Cloud chart shows a clear bullish structure, with price trading above both the Tenkan-sen and Kijun-sen. This alignment indicates strong short- and medium-term momentum, with buyers maintaining control.
The Kumo ahead is green and steadily expanding, which supports the continuation of the current uptrend. The distance between the price and the cloud also gives the trend some room before any potential weakness sets in.
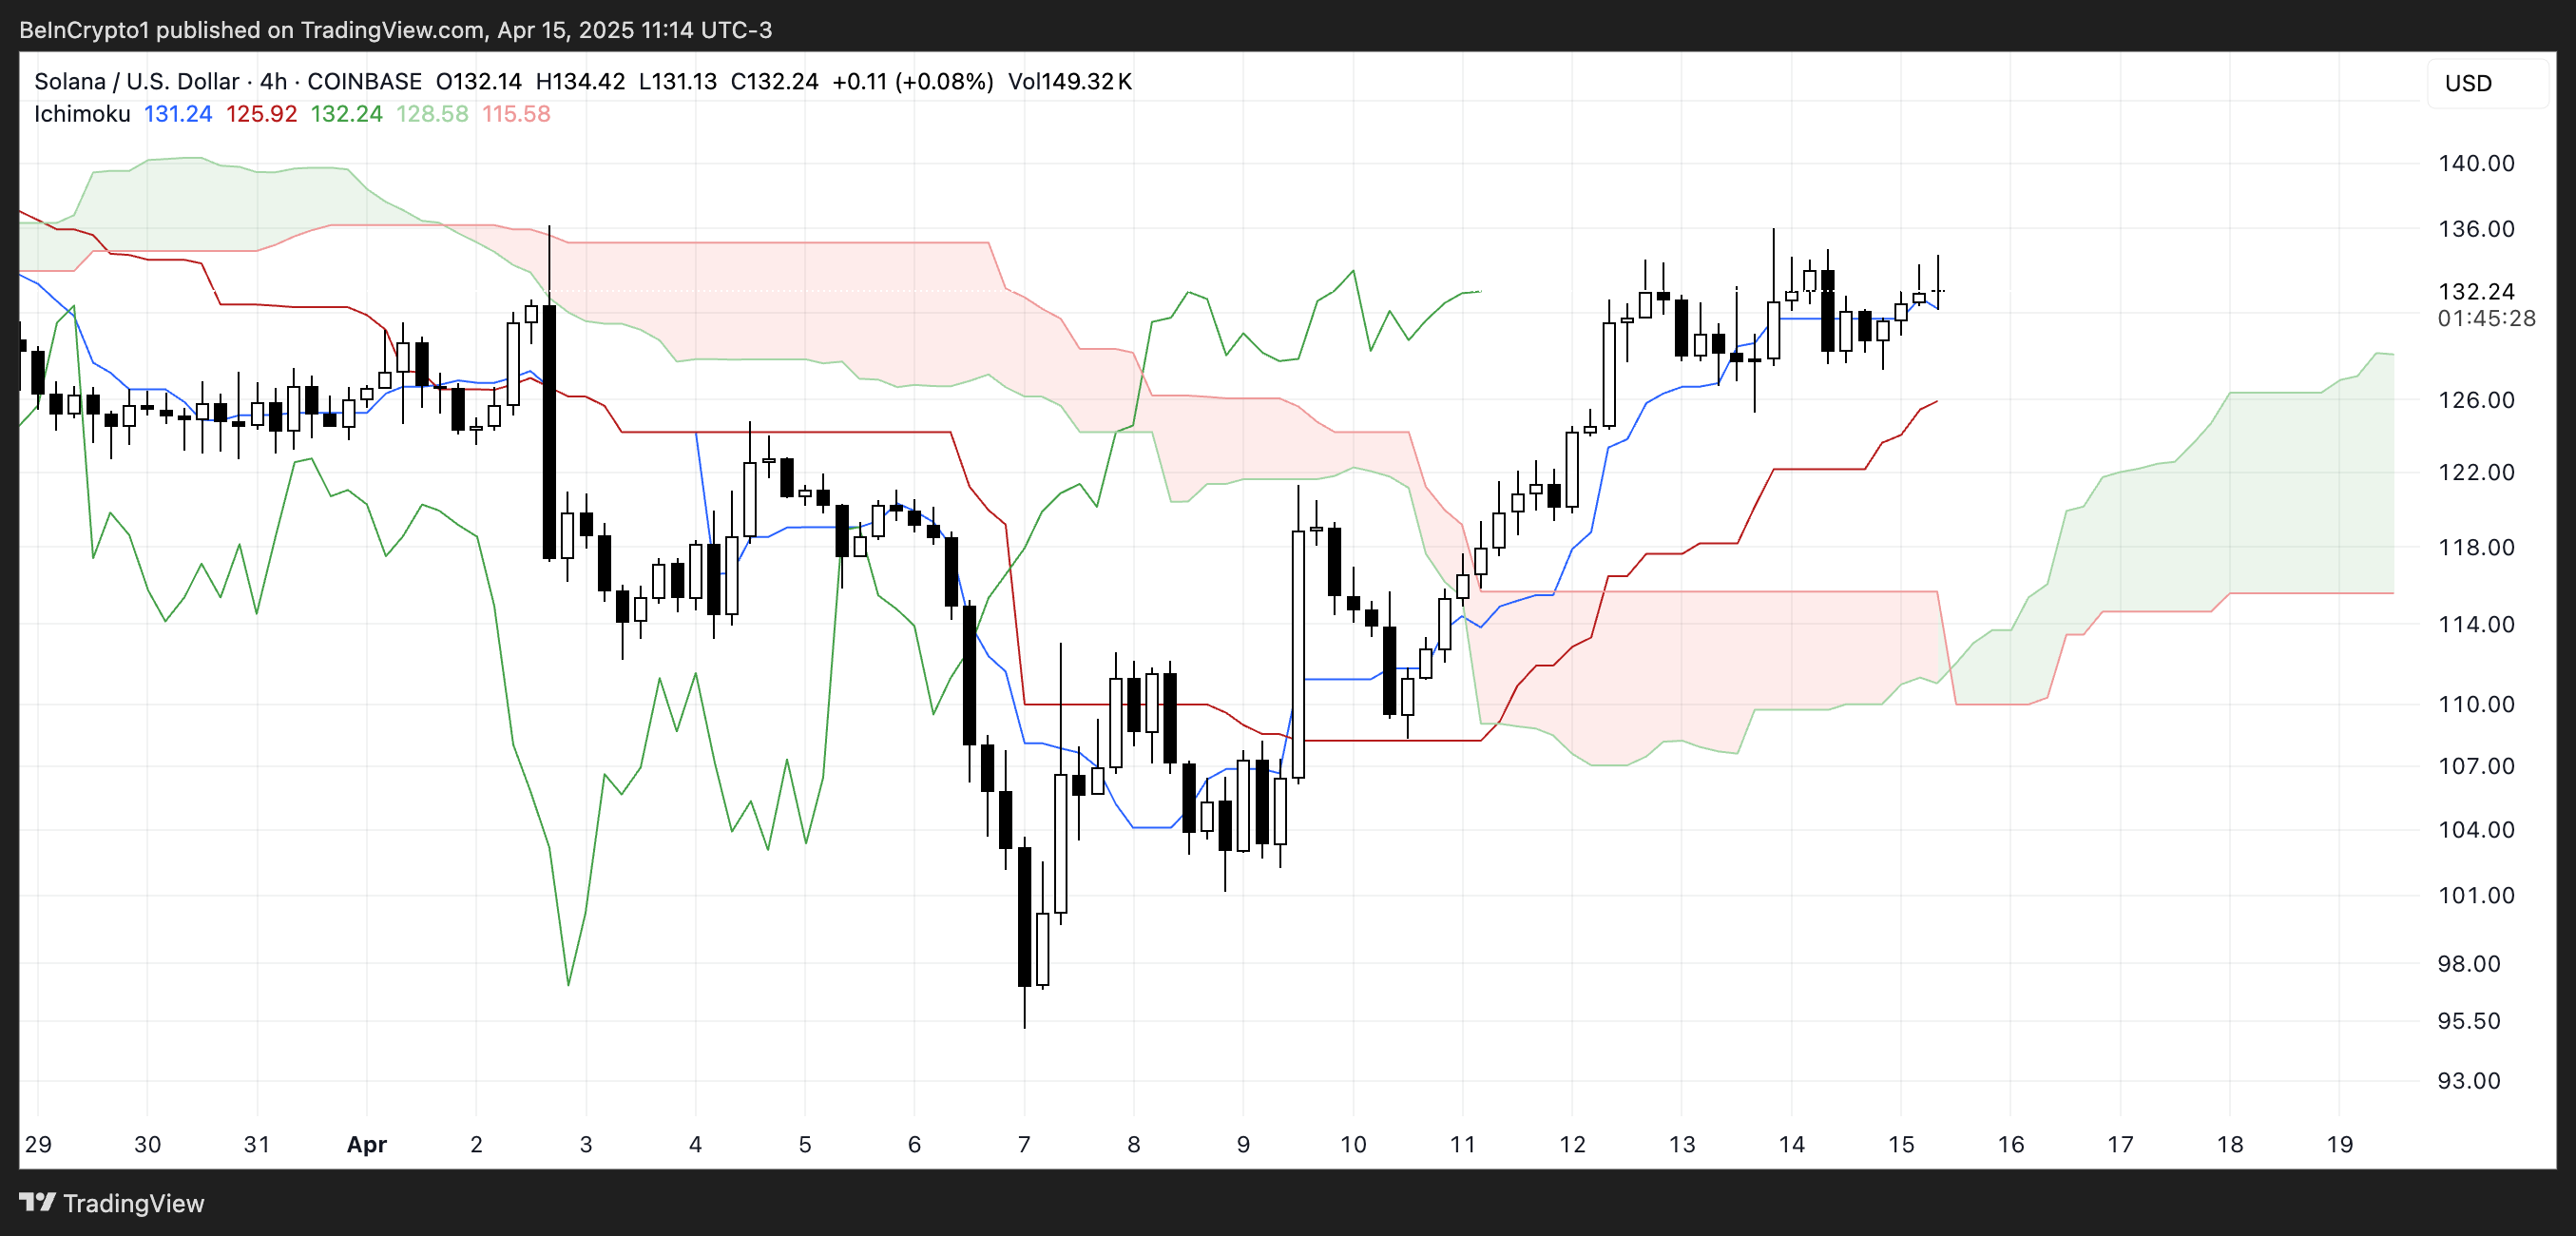
The Chikou Span is positioned above the cloud and candles, confirming bullish confirmation from past price action. As long as Solana stays above the Kijun-sen and the cloud remains supportive, the trend bias remains upward.
Solana’s BBTrend is currently at 16.89, showing a strong increase from 1.88 two days ago, though slightly down from 17.54 yesterday. This sharp rise indicates that volatility and trend strength have recently expanded significantly.
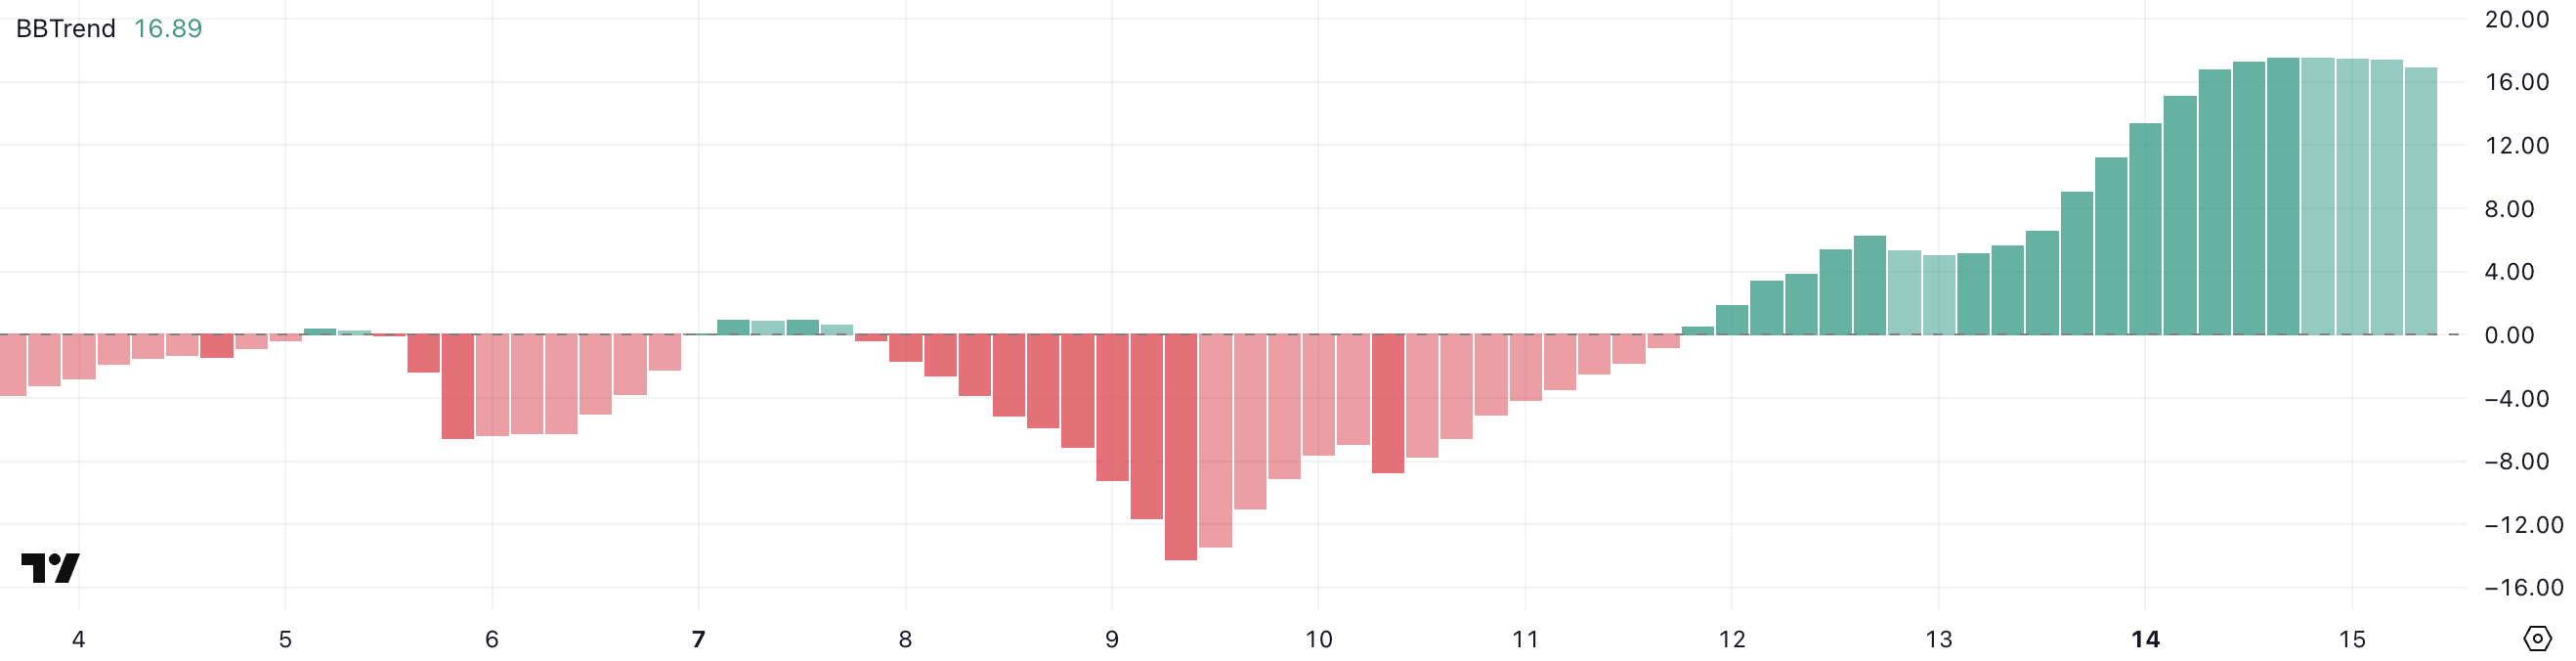
The BBTrend, or Bollinger Band Trend indicator, measures the strength of a trend based on how far price moves away from its average range. Readings above 10 generally signal a strong trend in motion, while lower values reflect a range-bound or weak market.
With SOL’s BBTrend holding near elevated levels, it suggests the asset is still in a strong trending phase. If it remains high or rises again, it could support further upward movement—but a steady decline might hint at a slowing trend or consolidation ahead.
SOL Volumes and Apps Are On The Rise
Solana is firmly reestablishing its dominance in the decentralized exchange (DEX) space, pulling ahead of Ethereum and BNB in daily volume.
Over the past 24 hours, Solana recorded $2.5 billion in DEX activity, marking a 14% increase over the last seven days. That growth outpaces Base’s 10% and contrasts sharply with the declines seen on Ethereum (-3%) and BNB (-9%).

More impressively, Solana’s seven-day DEX volume has surpassed the combined volume of Base, BNB, and Arbitrum.

Beyond trading volume, Solana is also leading in protocol revenue generation. Among the top eight non-stablecoin protocols ranked by fees, five are directly built on Solana: Pump, Axiom, Jupiter, Jito, and Meteora.
Pump stands out in particular, generating $2.73 million in fees in just the past 24 hours and $15 million across the past week.
Can Solana Break Above $150 In The Next Weeks?
Solana’s EMA lines recently formed a golden cross, a bullish signal that often marks the start of a new uptrend.
This crossover suggests momentum is shifting in favor of buyers, with the potential for Solana price to soon test key resistance levels.
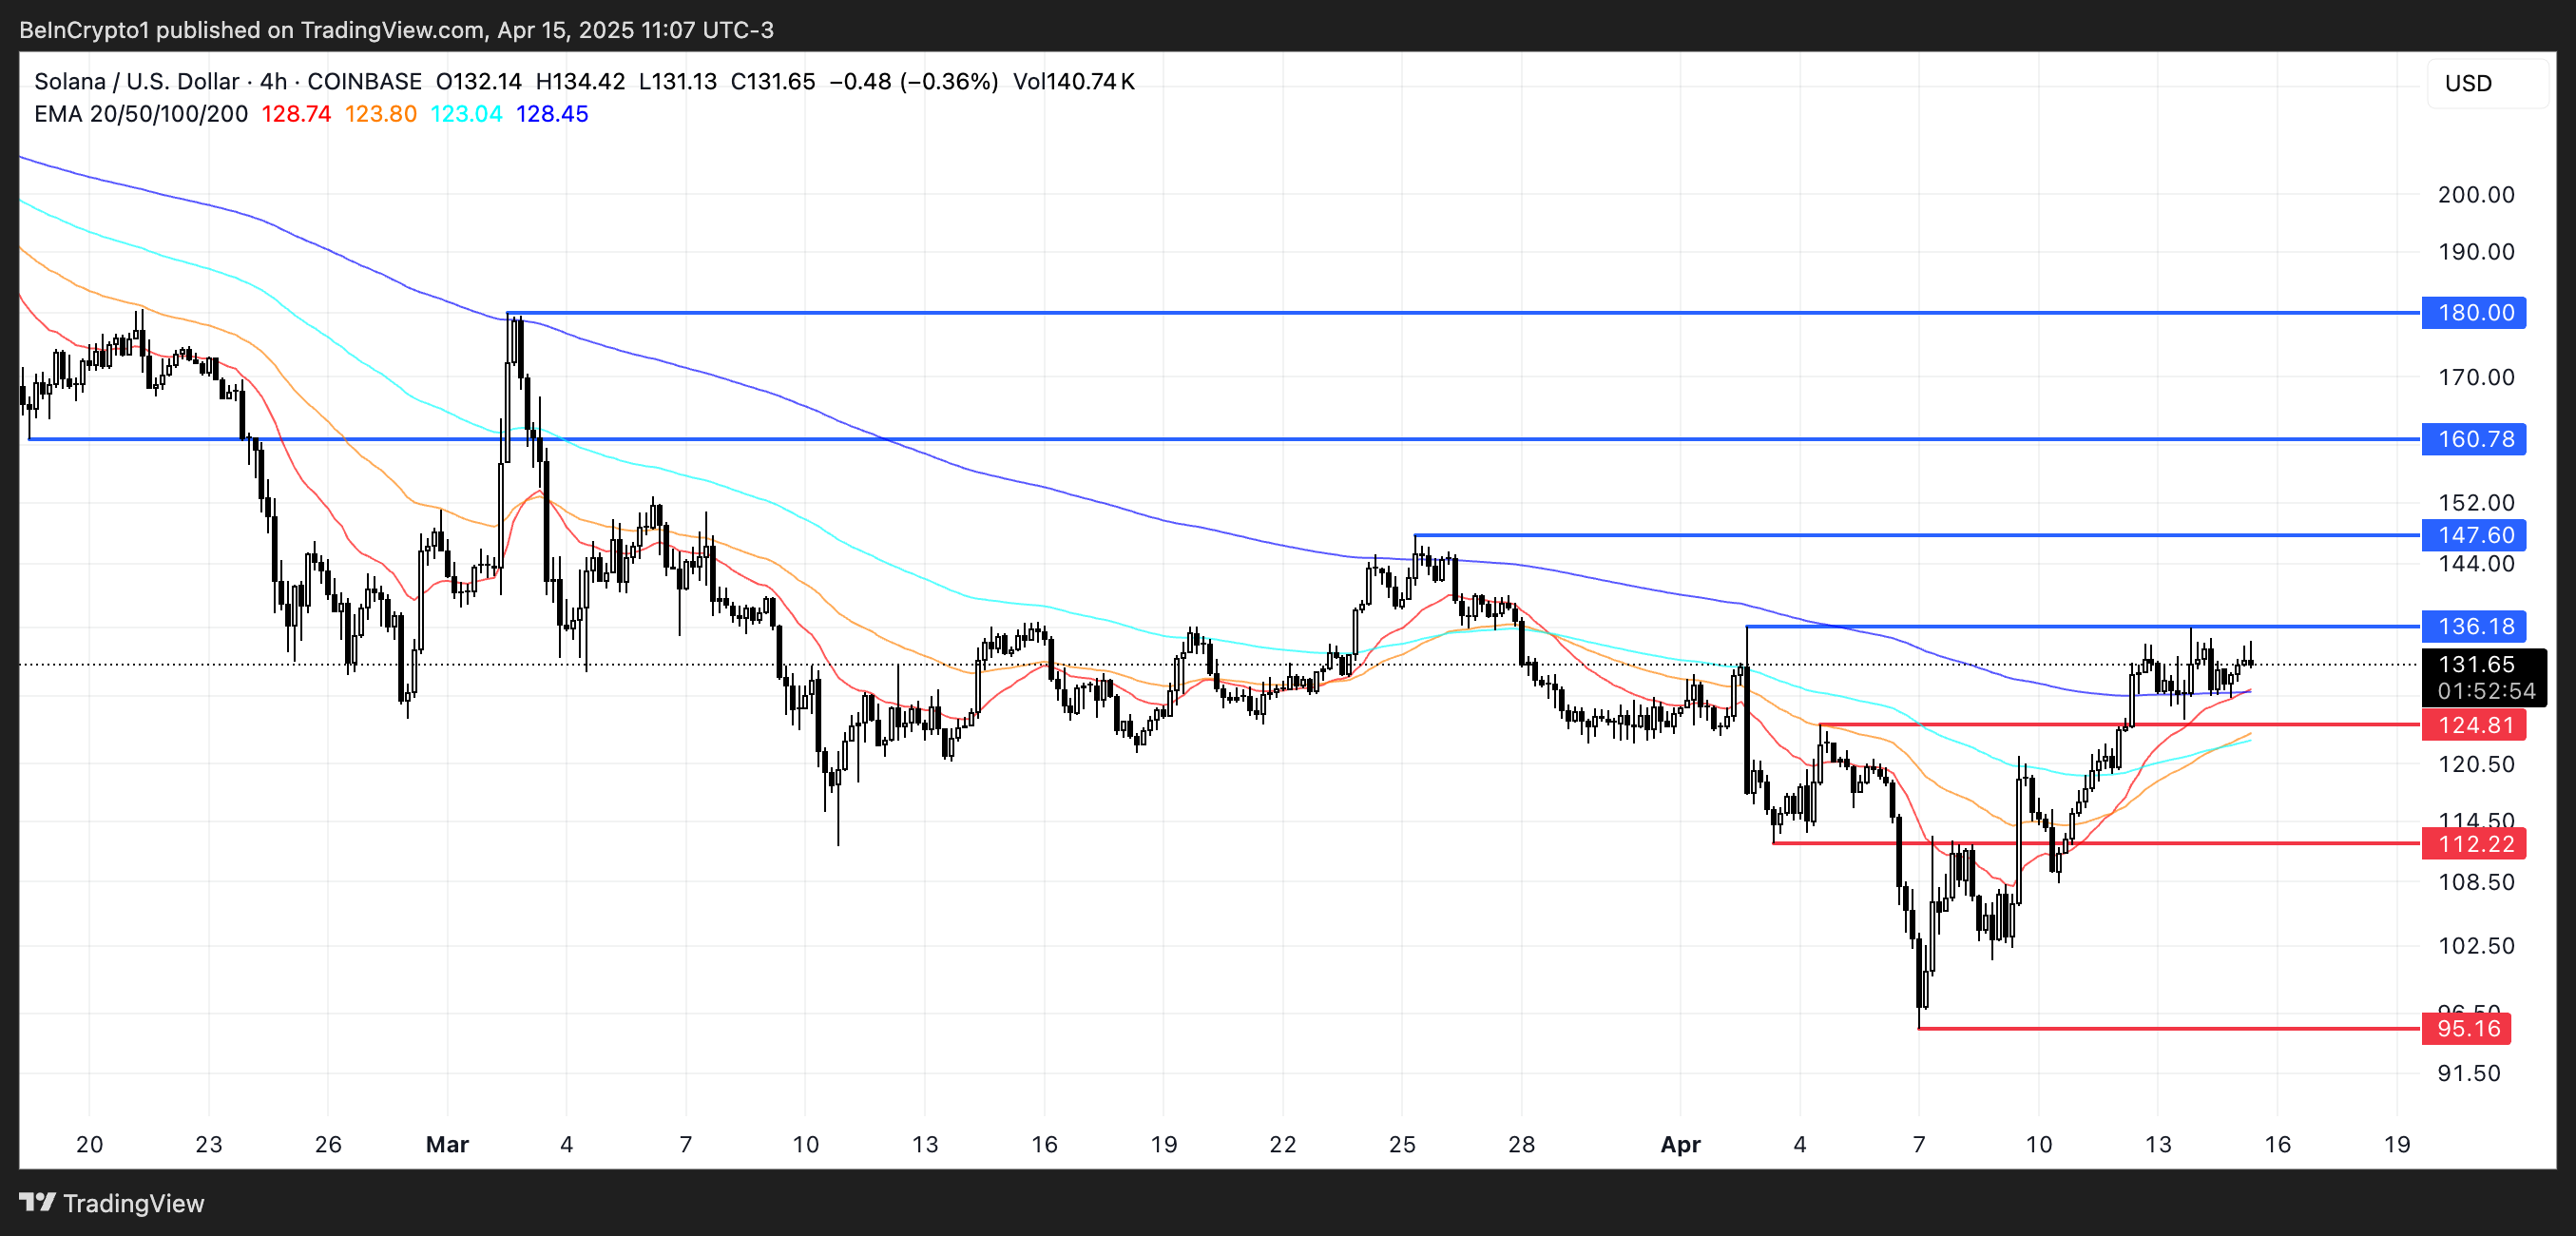
If the current trend holds, Solana could challenge resistance around the $136 zone. A breakout there may open the path toward higher levels such as $147, $160, and even $180 if bullish pressure intensifies.
However, if momentum fades, Solana may face a pullback toward the $124 support zone. A break below that could trigger deeper downside moves, potentially revisiting $112 or even $95 if selling pressure accelerates.
Disclaimer
In line with the Trust Project guidelines, this price analysis article is for informational purposes only and should not be considered financial or investment advice. BeInCrypto is committed to accurate, unbiased reporting, but market conditions are subject to change without notice. Always conduct your own research and consult with a professional before making any financial decisions. Please note that our Terms and Conditions, Privacy Policy, and Disclaimers have been updated.

Ethena Labs Leaves EU Market Over MiCA Compliance

Hedera Under Pressure as Volume Drops, Death Cross Nears

Solana (SOL) Jumps 20% as DEX Volume and Fees Soar

Ethereum Metrics Reveal Critical Support Level – Can Buyers Step In?

Solana Meme Coins Resurge with Rising Trade Volume

China’s De-Dollarization Boosts Bitcoin’s Global Role in 2025

2.52 Million Altcoins Are Ruining Crypto’s Future

Animoca Brands Valuation Tanks 75% In Two Years, Here’s Why

Crypto exchange BingX hacked for $43 million

Are The Big Players Losing Interest?

Hong Kong’s Securities Association Tips Authorities On Crypto Self-Regulation

Coinbase cbBTC Set to go Live on Solana
2.52 Million Altcoins Are Ruining Crypto’s Future
Animoca Brands Valuation Tanks 75% In Two Years, Here’s Why
Crypto exchange BingX hacked for $43 million
Are The Big Players Losing Interest?
Hong Kong’s Securities Association Tips Authorities On Crypto Self-Regulation
Coinbase cbBTC Set to go Live on Solana
-

 Market23 hours ago
Bitcoin Price Eyes Bullish Continuation—Is $90K Within Reach?
-

 Market16 hours ago
Can Pi Network Avoid a Similar Fate?
-
 Altcoin23 hours ago
Expert Urges Pi Network To Learn From The OM Crash Ahead Of Open Mainnet Transition
-

 Market19 hours ago
XRP Price Could Regain Momentum—Is a Bullish Reversal in Sight?
-

 Market24 hours ago
$7 Million Hack Hits Binance-Backed Project
-

 Market21 hours ago
Trump’s Tariffs Spark Search for Jerome Powell’s Successor
-

 Market18 hours ago
Cardano Buyers Eye $0.70 as ADA Rallies 10%
-

 Market17 hours ago
Dogecoin (DOGE) Derailed? Meme Coin Faces New Hurdles to Fresh Surge
