
Market
Back to $1 Billion Market Cap

Helium (HNT) price is up roughly 150% this year and its market capitalization recently reached the $1 billion market cap. The Chaikin Money Flow (CMF) has turned positive at 0.15, signaling strong buying pressure and supporting recent price gains.
If the golden cross forms as EMA lines suggest, HNT could test resistances at $6.5 and $7.2, but a reversal might lead to support levels at $6 or as low as $5.28.
HNT CMF Is Now Positive
HNT CMF has surged to 0.15 from -0.06 in just one day, signaling a significant shift toward positive buying pressure. The CMF, or Chaikin Money Flow, measures the flow of capital into or out of an asset over a specific period, with values above 0 indicating net inflows (buying dominance) and values below 0 reflecting net outflows (selling pressure).
This sharp rise highlights growing confidence among buyers, supporting HNT’s recent 5% price increase.
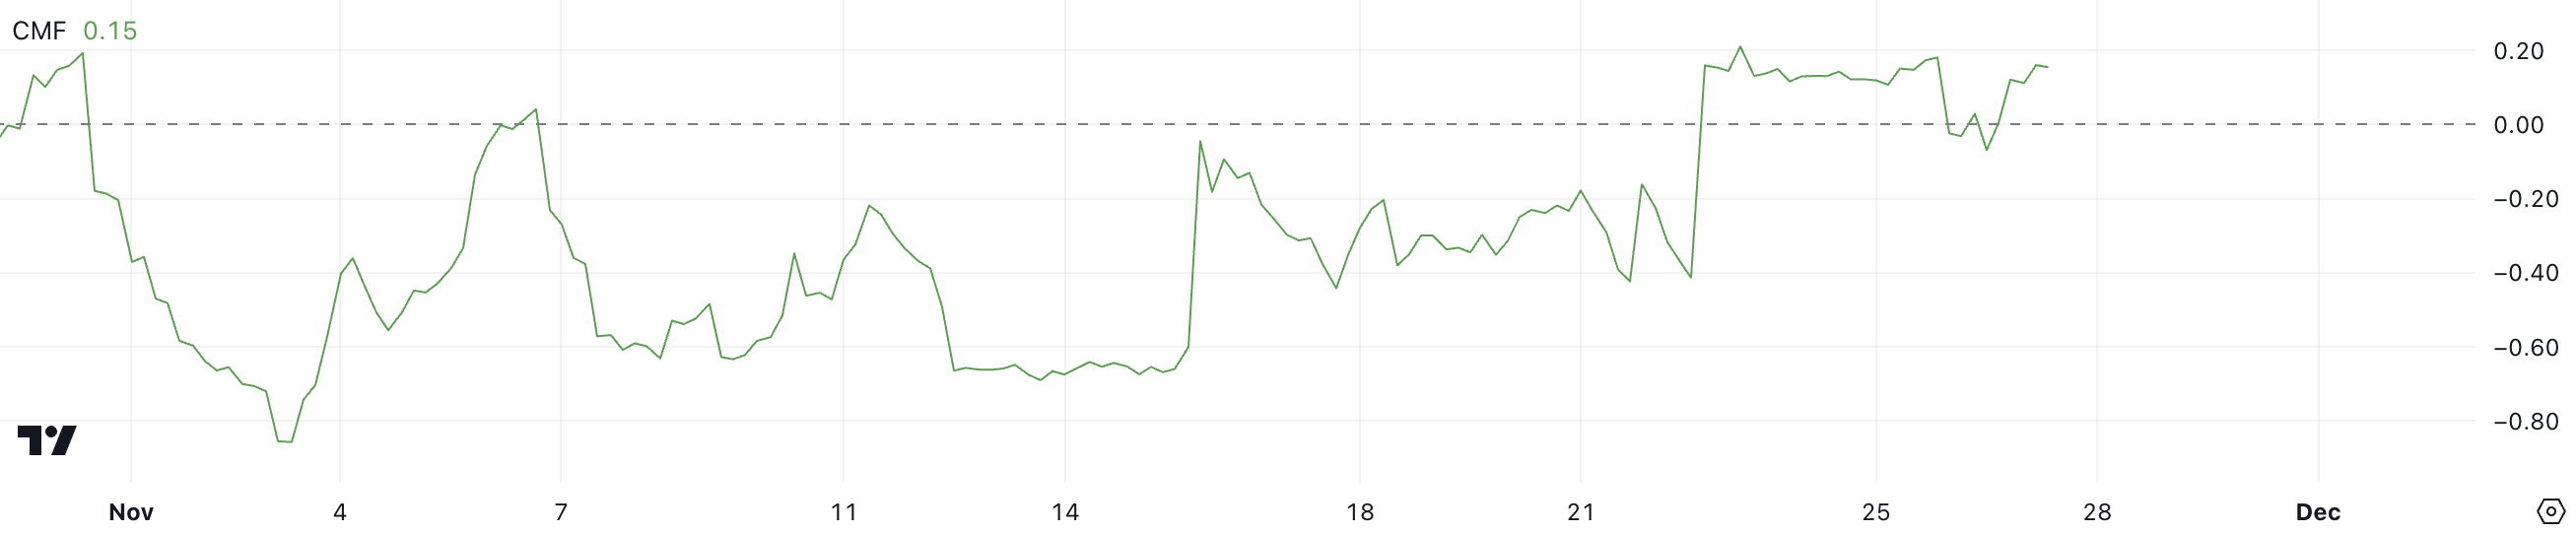
A CMF of 0.15 indicates strong bullish sentiment, suggesting that the current uptrend has solid backing from capital inflows. If the CMF continues rising, it could signal further upward momentum for HNT, potentially resulting in additional price gains.
Helium RSI Shows Potential For More Price Increase
Helium RSI has climbed to 58 from 46 in just one day, reflecting growing bullish momentum. The RSI, or Relative Strength Index, measures the speed and magnitude of price changes on a scale from 0 to 100.
Values above 70 signal overbought conditions and a potential for a correction, while values below 30 indicate oversold levels, often leading to a rebound. An RSI of 58 suggests that HNT is in a healthy uptrend without approaching overbought territory yet.
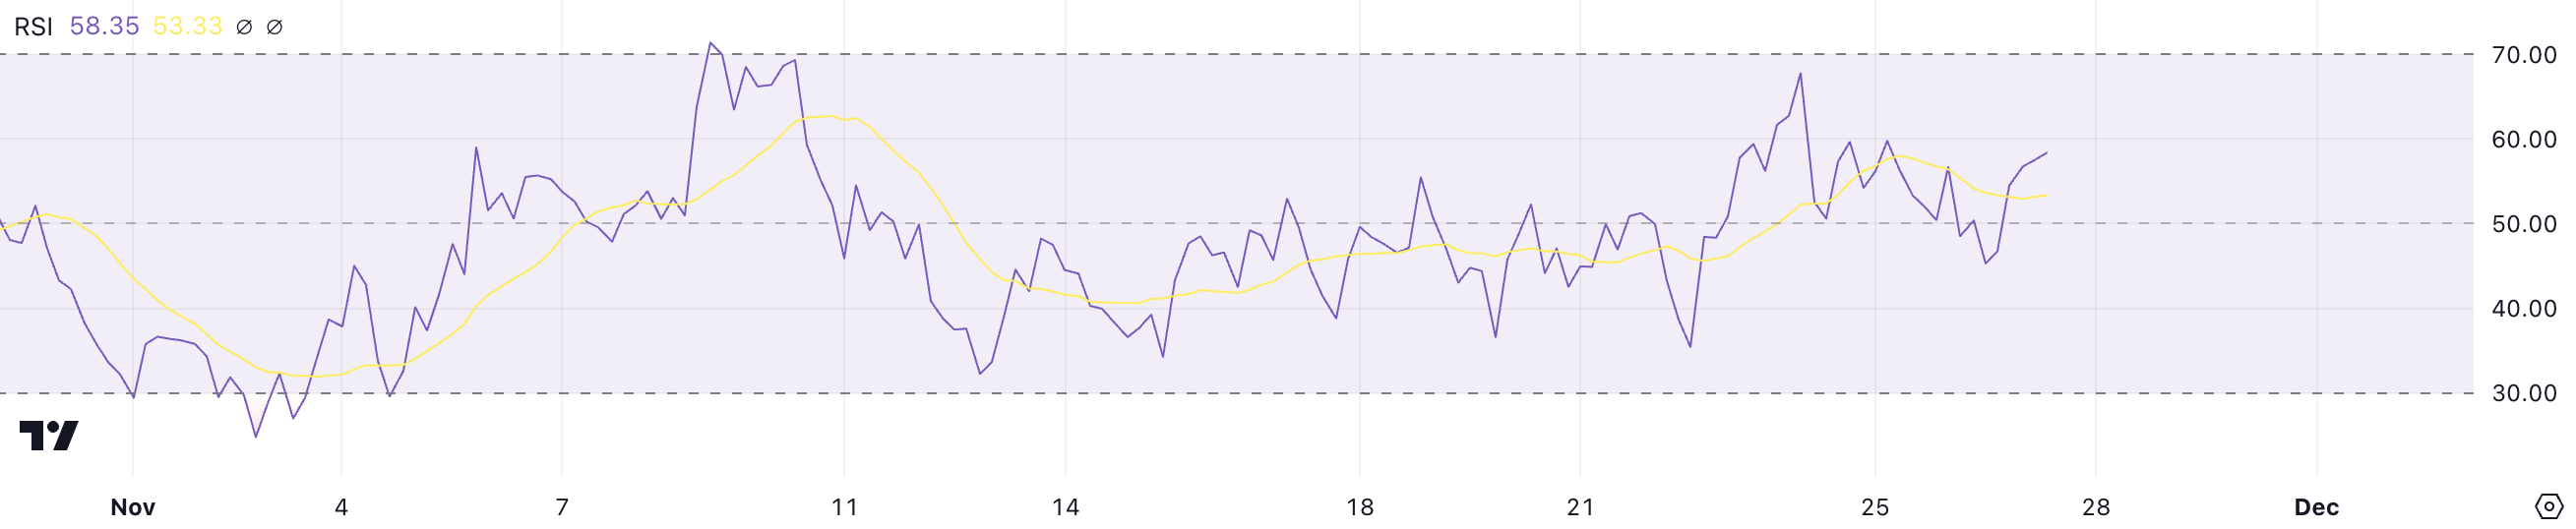
With the RSI still well below 70, HNT’s current uptrend has room to continue before hitting overbought levels. This leaves space for further price growth as buying momentum builds.
If the RSI continues its upward trend, HNT price could see additional gains in the short term, supported by its current bullish sentiment.
HNT Price Prediction: Can HNT Reach $7 Soon?
HNT EMA lines show the potential formation of a golden cross, where a short-term EMA crosses above a long-term EMA. This pattern is a bullish signal, often indicating the start of a sustained uptrend.
If the golden cross forms and momentum continues, Helium price could break through the $6.5 resistance level and potentially climb to $7.2, reinforcing its bullish trajectory and the recent $1 billion market cap milestone. This would also reinforce HNT in the top 10 ranking among DePIN (Decentralized Physical Infrastructure) coins.
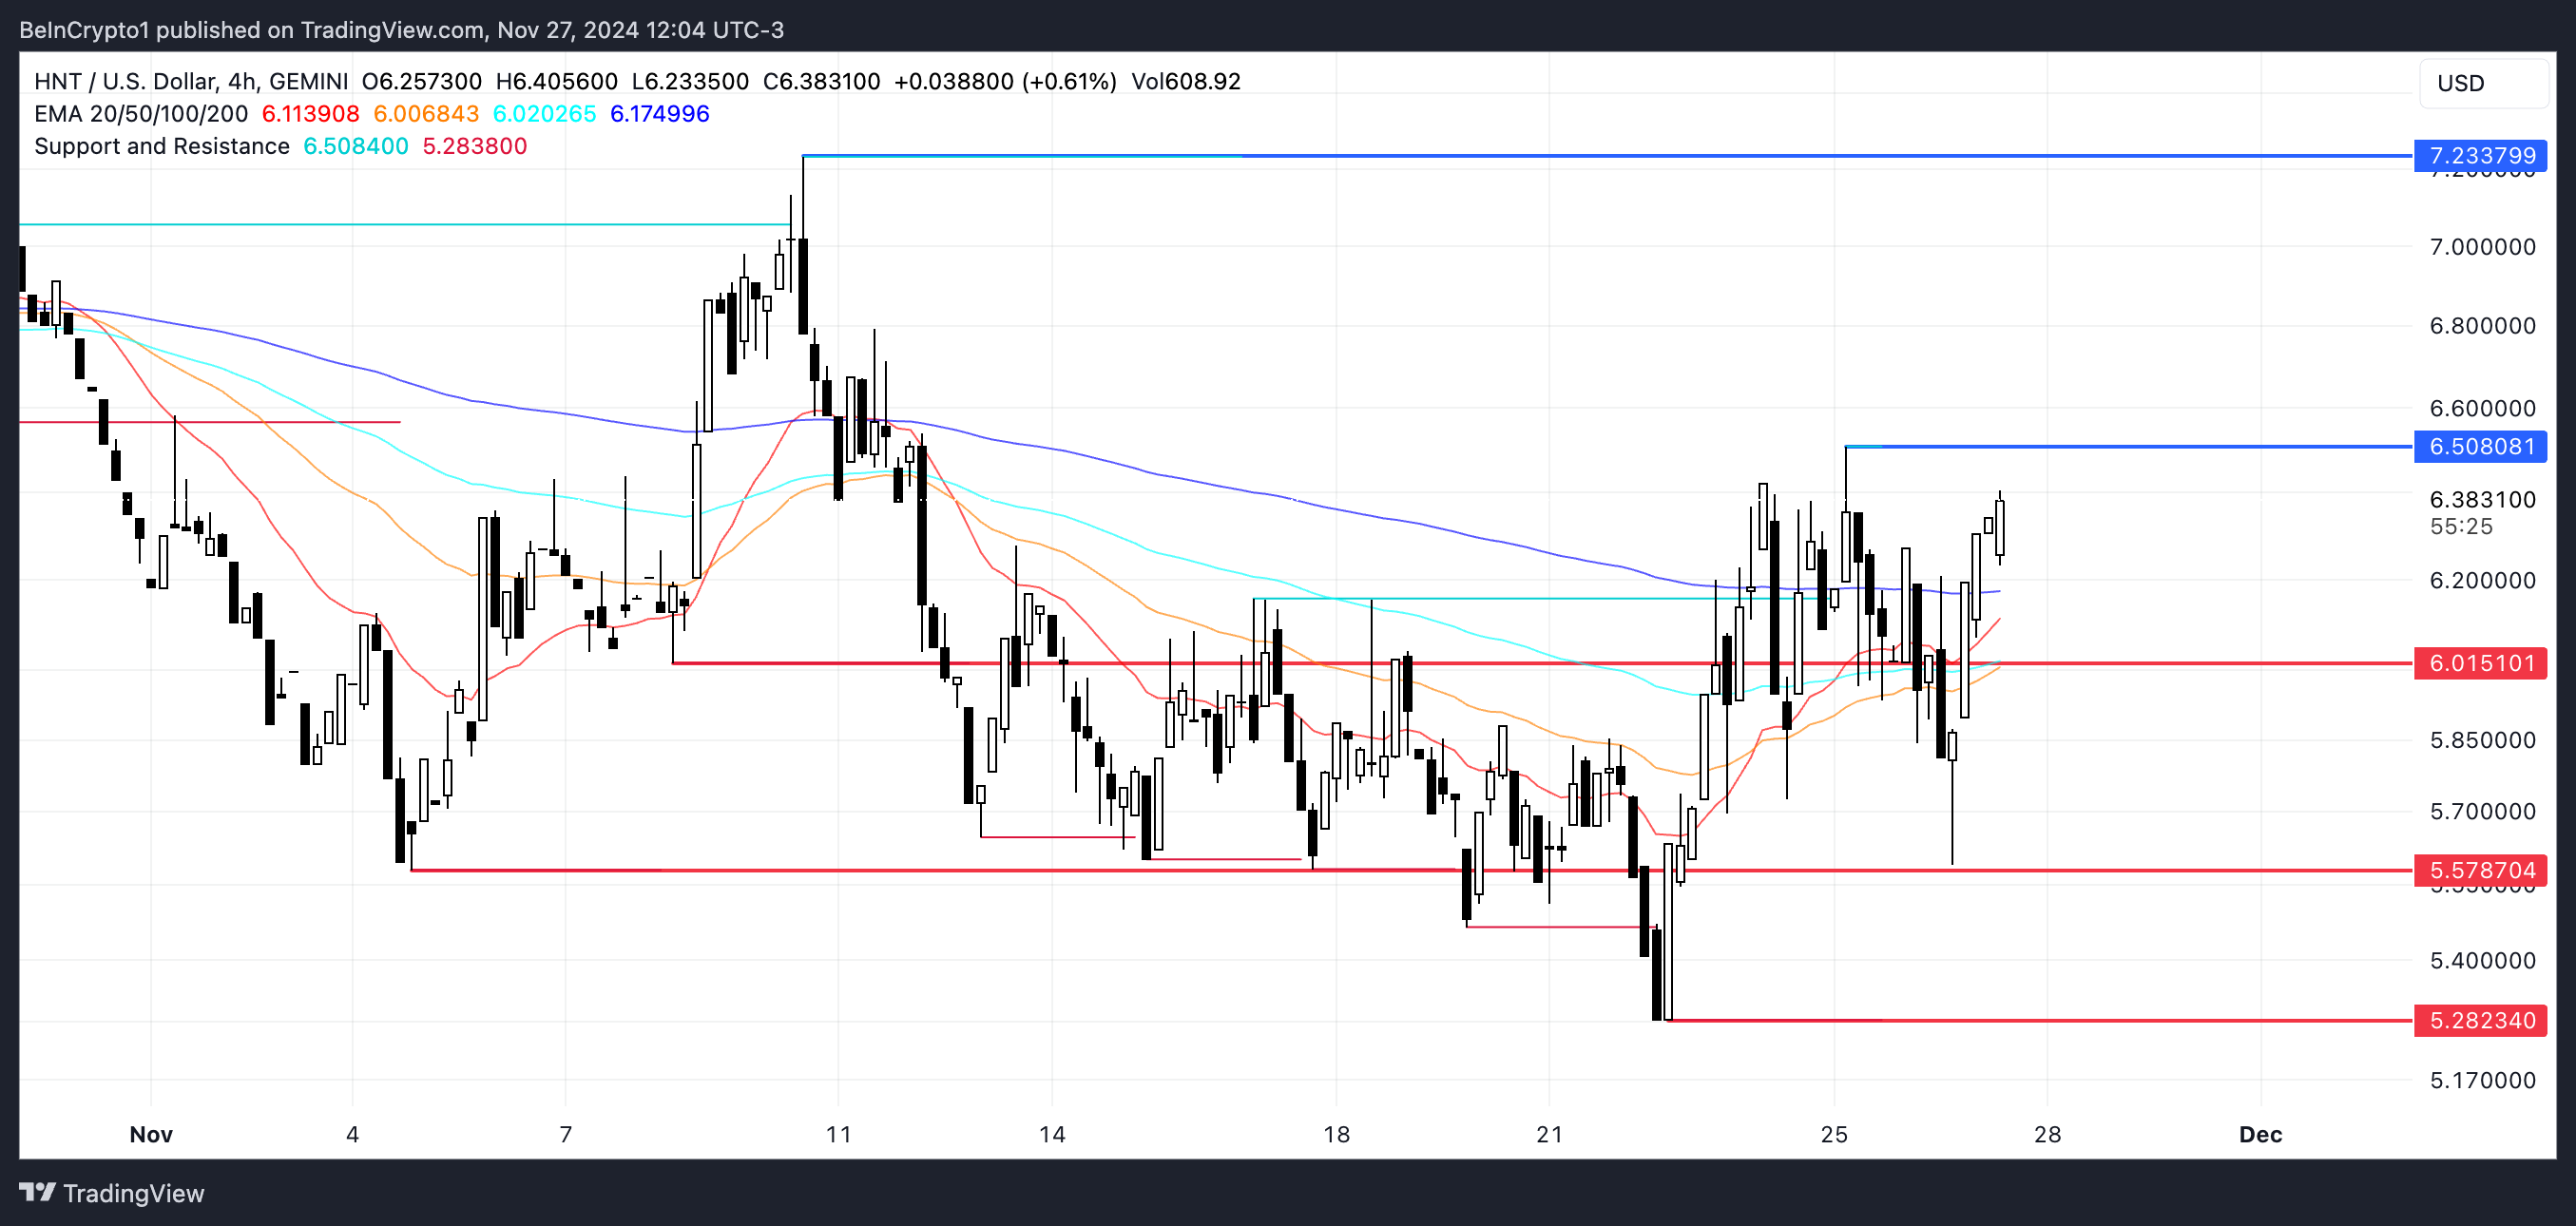
However, if the current uptrend weakens and reverses, HNT price may face critical support levels.
The price could first test $6, and if that fails, it might drop to $5.57 or even $5.28.
Disclaimer
In line with the Trust Project guidelines, this price analysis article is for informational purposes only and should not be considered financial or investment advice. BeInCrypto is committed to accurate, unbiased reporting, but market conditions are subject to change without notice. Always conduct your own research and consult with a professional before making any financial decisions. Please note that our Terms and Conditions, Privacy Policy, and Disclaimers have been updated.


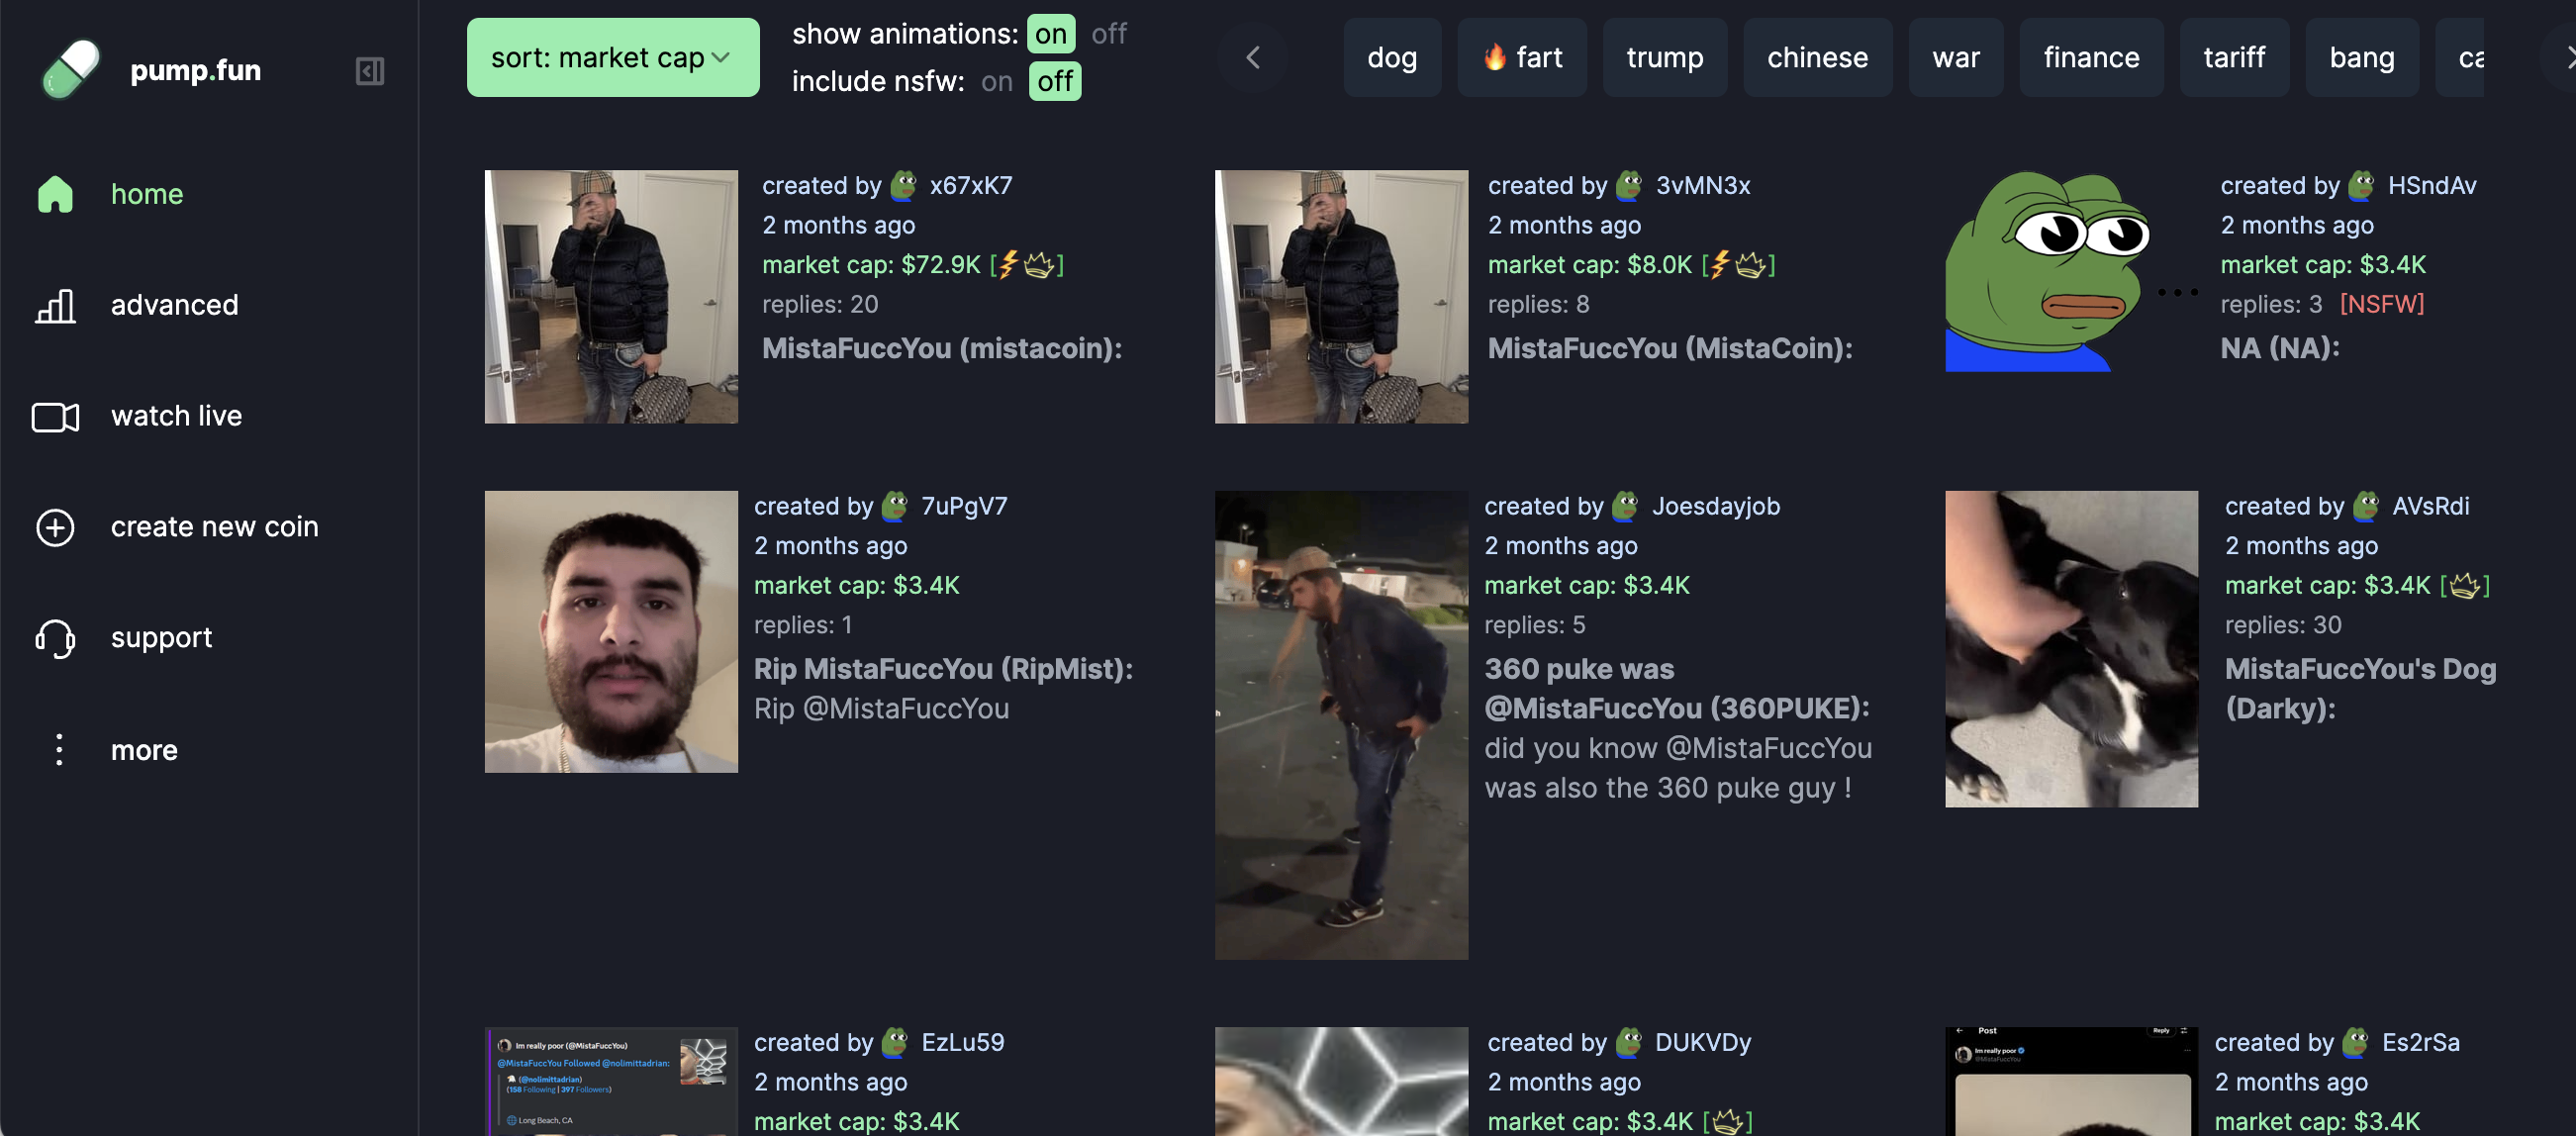
Pump.fun reopened its livestreams today for all users. The platform is now applying proactive guardrails and imposing strict rules around violence, criminal misconduct, and other actions.
Although streaming helped launch Pump.fun’s popularity, it quickly grew to a darker side. Streamers manipulated the market, threatened violence, and escalated to tragic outcomes.
Pump.fun Opens Livestreams Under New Rules
Pump.fun, the meme coin launchpad, has been at the center of a few controversies. Still, the platform enjoys broad popularity, and it’s officially trying to relaunch one of the things that first boosted its notoriety.
After several months of disabling them, Pump.fun is fully enabling livestreams for all the platform’s users:
“Pump.fun livestreaming has been rolled out to 100% of users with industry standard moderation systems in place and transparent guidelines. If you’re a creator and are looking for any support, feel free to message us,” the platform claimed in its official announcement.
Livestreams on Pump.fun might be the most controversial feature of the platform’s history. This function was initially created to help meme coin creators promote their tokens, but it soon faced intense backlash.
Token promoters would use live streams to sell complete scams and engage in market manipulation. However, these were far from the worst offenders.
As these Pump.fun live streams got out of hand, scammers engaged in dangerous and illegal stunts to achieve notoriety. Sexually explicit material and other unlawful activities were just a prelude to further escalation. The most egregious streamers demanded users buy their tokens or threatened violent actions.
These threats included animal abuse, self-harm, and suicide. Thankfully, no one carried through with the most extreme threats. Pump.fun closed down their livestreams last November after a user called “Beni” threatened one such false suicide stunt.
Reputation Hits Continue Despite Platform Closure
Unfortunately, ending the service didn’t stop further incidents. In February, after streaming had been closed, user “MistaFuccYou” livestreamed his genuine suicide on a different platform.
Before taking his life, he encouraged viewers to launch meme coins in his name. Dozens of these products soon went live on Pump.fun, further tarnishing its reputation.
This sordid incident attracted extensive mainstream coverage and may have kept Pump.fun’s livestream service closed even longer. Now, however, it’s ready to try again.
Earlier this week, it quietly rolled out the function to 5% of users, including strict new content guidelines. Today, it was relaunched with full functionality to 100% of the users.
Positively, the platform’s new livestream moderation rules are much stricter, with eight prohibited categories. These include violence, harassment, sexual content, and several types of illegal activity.
Users who violate the policy may have their livestreaming privileges revoked, accounts disabled, and content reported to law enforcement where applicable.
So far, this rollout has received a positive response from the community. Livestreams helped make Pump.fun famous, and it was a great disappointment that bad actors ruined it for everyone.
Hopefully, these new moderations can keep a fun and lighthearted environment, avoiding both “clean” pump and dump schemes and these darker criminal actions.
Disclaimer
In adherence to the Trust Project guidelines, BeInCrypto is committed to unbiased, transparent reporting. This news article aims to provide accurate, timely information. However, readers are advised to verify facts independently and consult with a professional before making any decisions based on this content. Please note that our Terms and Conditions, Privacy Policy, and Disclaimers have been updated.

Since early 2025, exchanges such as Cboe BZX and NYSE Arca have submitted proposals to the US SEC to incorporate staking services into existing spot ETFs. If approved, these funds could accelerate crypto adoption by giving traditional investors streamlined access to ETH.
Brian Fabian Crain, CEO and Co-founder of Chorus One, told BeInCrypto he remains “cautiously optimistic” about the proposals gaining approval before the end of President Trump’s first term. Still, he emphasized that the SEC will likely focus on ensuring strict investor protections before moving forward.
The Push for Staked Ethereum ETFs in the US
In mid-February, both Cboe BZX Exchange and NYSE Arca took steps towards Ethereum staking ETFs. Cboe BZX filed to amend the 21Shares ETF, while NYSE Arca followed two days later with a similar proposal for Grayscale’s ETF offerings.
Staking is a fundamental component of Proof-of-Stake (PoS) blockchains. Instead of relying on energy-intensive mining, such as in Proof-of-Work blockchains like Bitcoin, PoS networks select participants.
These participants act as validators and are in charge of verifying and adding new transactions, or blocks, to the blockchain based on the amount of cryptocurrency they have “staked” or locked up.
If approved, these Ethereum ETFs would allow traditional investors to gain exposure to the cryptocurrency while also earning passive income by contributing to the security of the Ethereum network through staking.
This move would also represent another significant step forward for institutional crypto adoption.
“The approval of an Ethereum staking ETF would mark a watershed for institutional adoption. Indeed, a staking-enabled ETF provides a regulated, easy-to-access exposure to ETH that includes its native yield, all within the familiar ETF framework. This means asset managers and pensions could gain passive ETH exposure without handling private keys or navigating crypto exchanges, significantly lowering operational barriers,” Crain told BeInCrypto.
It would also enhance Ethereum’s market position relative to other crypto assets.
Can Staking Yield Revitalize Ethereum’s Market Position?
Throughout much of 2024 and early 2025, Ethereum’s price appreciation lagged significantly behind Bitcoin. The ETH/BTC ratio hit a record low in early April 2025, indicating that Bitcoin was outperforming Ethereum.
Fluctuations in the broader crypto market further complicated Ethereum’s market position. Earlier this month, the network reached its lowest price in two years, eroding investor confidence.

With increasing support from exchanges and asset managers for an Ethereum-staking ETF, a development of this scale can potentially reposition Ethereum.
“One key differentiator of Ethereum is its ability to generate yield through staking — something Bitcoin doesn’t offer. Enabling that feature within an ETF makes Ethereum-based products more attractive and competitive. Ethereum’s ~3% annual staking yield is a major draw for investors and a clear distinction from Bitcoin. It means that even if ETH’s price growth trails Bitcoin’s, staked ETH can still deliver higher total returns thanks to the yield. By packaging this yield into an ETF, Ethereum becomes a more compelling investment option for institutions focused on income,” Crain explained.
Allowing staking within an ETF structure would spur greater ETH demand and investor appetite and enhance Ethereum’s security by expanding the validator pool and decentralizing staking across a wider range of holders.
Increased total staked ETH would further strengthen the network against attacks.
With other jurisdictions already legally permitting staking services, the United States might see their early adoption as a reason to act quickly and maintain a competitive edge.
How Hong Kong’s Staking Approval Impacts the US SEC
This week, Hong Kong’s Securities and Futures Commission (SFC) announced new guidance allowing licensed crypto exchanges and funds in the city to offer staking services. Platforms must meet strict conditions before providing these services.
“The SFC’s framework emphasizes investor protection while embracing innovation. For example, Hong Kong requires that platforms retain full control of client assets (no outsourcing) and disclose all staking risks transparently,” Crain explained.
Hong Kong set itself apart from other jurisdictions like Singapore, which banned retail staking in 2023, and the previous SEC’s administration on Gary Gensler, which took a historically restrictive approach.
Crain believes this new development will primarily exert competitive pressure on the SEC to follow accordingly.
“As a major international financial hub, Hong Kong’s adoption of regulated staking sends a message: it is possible to allow staking in a compliant manner. US regulators often watch regimes like Hong Kong as bellwethers for emerging best practices. The SEC will take note that Hong Kong is not only allowing staking but even paving the way for staking services in ETFs (the SFC’s rules mention authorized virtual asset funds can offer staking under certain caps and conditions),” he said.
Incorporating staking into Hong Kong-listed crypto ETFs would put US funds and exchanges at a competitive disadvantage if the SEC maintains its prohibition.
When reviewing the 21Shares and Grayscale applications, the SEC may need to consider that global investors could turn to international markets to access these staking ETF products if the US doesn’t eventually allow them.
While the competitive aspect is a factor, the SEC will also need to address various complexities inherent in Ethereum staking, which may be obstacles to final approval.
The “Investment Contract” Conundrum
Among the most important factors the SEC will consider is whether staking programs constitute investment contracts.
The previous administration’s SEC targeted centralized exchanges like Kraken and Coinbase for operating staking services considered unregistered profit schemes and violating US securities laws.
In centralized exchanges, users must effectively transfer custody of their cryptocurrency to a third-party entity that manages staking and the distribution of rewards. However, this model is distinct from the process inherent in Ethereum, a decentralized blockchain.
“Unlike exchange staking programs, an ETF staking its own assets isn’t ‘selling’ a staking service to others, it’s directly participating in network consensus. This nuance, emphasized in recent filings and comment letters, is contributing to the SEC’s willingness to reconsider its stance. Essentially, the argument is that staking is a core technical feature of Ethereum, not an ancillary investment product,” Crain told BeInCrypto.
While an ETF staking its assets presents a different model, the SEC will look closely for security violations. Addressing this concern requires demonstrating that protocol rewards originate inherently from the decentralized network, not the sponsor’s business efforts.
This issue, though largely conceptual, is critical; SEC approval hinges on satisfying securities law requirements regarding staking.
Meanwhile, slashing risks are another issue of concern.
Slashing Risks: A Unique Challenge for Ethereum Staking ETFs?
A key difference from traditional commodity funds is that a staking ETF must actively participate in network consensus, exposing it to the potential for slashing.
Slashing is a penalty where a portion of the staked ETH can be destroyed if a validator acts improperly or makes mistakes. For investors, the ETF’s principal could suffer partial losses due to operational errors, a risk not present in non-staking ETFs.
“The SEC will assess how significant this risk is and whether it’s been mitigated. Filings note that the Sponsor will not cover slashing losses on behalf of the trust, meaning investors bear that risk. This forces the SEC to consider if average investors can tolerate the possibility of losing funds not due to market movement but due to a technical protocol penalty. This risk must be transparently disclosed and managed in any approved product,” Crain explained.
Typically, custodians have insurance for asset loss due to theft or cyberattacks. However, slashing is a protocol-enforced penalty, not traditional “theft,” and many custody insurance policies might not cover it. Therefore, the SEC will likely inquire about the safeguards should a slashing event occur.
This novel aspect of Ethereum staking creates certain ambiguities in accounting treatment.
“The SEC will scrutinize how the custodian reports on staked holdings. The ETF’s [net asset value accounting needs to capture both the base ETH and the accumulated rewards. Custodians will likely provide reporting on how much ETH is staked versus liquid, and any rewards received. The SEC will require independent audits or attestations confirming that the custodian indeed holds the ETH it claims (both original and any newly awarded ETH) and that controls around staking are effective,” Crain explained.
Liquidity risks associated with Ethereum staking are another factor to consider.
Further SEC Considerations
A key detail the SEC will examine is that staked ETH lacks instant liquidity.
Even after the Shanghai upgrade enabled withdrawals in 2023, the Ethereum protocol still incorporates delays and queues that prevent staked ETH from being instantly liquid upon initiating the unstaking process.
“The SEC will examine how the fund handles redemption requests if a large portion of assets are locked in staking. For example, exiting a validator position can take from days to weeks if there’s a backlog (due to the network’s exit queue and “churn limit” on how many validators can unlock per epoch),” Chain told BeInCrypto.
During heavy outflows, the fund might not immediately access all its ETH to meet redemptions. The SEC sees this as a structural complexity that could harm investors if not planned for.
“In a worst-case scenario, if the ETF had to wait days or weeks to fully exit staking positions, an investor redeeming could either wait longer for their proceeds or get paid in-kind with staked ETH (which they then must figure out how to redeem themselves). This isn’t a typical concern in ETFs and is a potential downside for investors expecting high liquidity,” Crain added.
Finally, there are also security risks that must be addressed responsibly.
The “Point-and-Click” Model
Securing custody for Ethereum in an ETF is already crucial, and adding staking will increase the SEC’s scrutiny.
“The SEC will examine how the ETF’s custodian secures the ETH private keys, especially since those keys (or derivative keys) will be used to stake. Normally, custodians use cold storage for crypto assets, but staking requires keys to be online in a validator. The challenge is to minimize exposure while still participating in staking,” Crain said.
Recognizing the vulnerability of keys during validator activation, the SEC will most likely require custodians to use cutting-edge security modules to prevent hacking. Any prior incidents of security breaches involving a custodian would raise serious concerns.
Aiming to lessen these risks, some exchanges have proposed that the ETH for staking remain within the custodian’s control at all times. This model is largely referred to as a “point-and-click” mechanism.
“NYSE Arca’s proposal to allow the Grayscale Ethereum Trust (and a smaller ‘Mini’ trust) to stake its Ether via a ‘point-and-click’ mechanism is a test case that will significantly inform the SEC’s evaluation of staking in an ETF context. The point-and-click staking model is essentially a way to stake without altering the fundamental custody or introducing extra complexities for investors. In practice, this means the trust’s custodian would simply enable staking on the held ETH through an interface. The coins don’t leave the custody wallet, and the process is as straightforward as clicking a button,” Crain explained.
The proposal directly tackles the SEC’s security worries by emphasizing that the ETH never leaves the custodian, thereby minimizing the theft risk. Furthermore, it clarifies that the yield is generated automatically by the network, not through the entrepreneurial endeavors of a third party.
When Will the SEC Approve Staking in Ethereum ETFs?
Despite the complexities and technical details of staking in Ethereum ETFs, the prevailing political climate in the US could lead to a more favorable environment for their eventual approval.
“On balance, it now seems more likely than not that the SEC will approve a staking feature for Ethereum ETFs in the relatively near future. A more receptive SEC leadership post-2025, strong political backing for staking in ETPs, and well-crafted proposals addressing earlier concerns — such as the point-and-click model — all tilt the odds toward approval. A year or two ago, the SEC was firmly opposed. Now, the conversation has shifted to ‘how to do this safely,’ which marks a significant change,” Crain told BeInCrypto.
That said, Crain cautioned that the SEC will not approve an ETF of this kind until it’s fully satisfied with the investor protections in place. Even so, the overall outlook remains positive.
“Considering all the factors discussed, the outlook for an Ethereum staking ETF approval appears cautiously optimistic. The likelihood of eventual approval is growing, though the timing remains a subject of debate,” Crain concluded.
In the best-case scenario, an Ethereum staking ETF could gain approval by the end of 2025.
Disclaimer
Following the Trust Project guidelines, this feature article presents opinions and perspectives from industry experts or individuals. BeInCrypto is dedicated to transparent reporting, but the views expressed in this article do not necessarily reflect those of BeInCrypto or its staff. Readers should verify information independently and consult with a professional before making decisions based on this content. Please note that our Terms and Conditions, Privacy Policy, and Disclaimers have been updated.


The SEC and Binance filed a joint motion to pause their lawsuit for 60 days. They requested a prior pause 60 days ago and have “been in productive discussions” since then.
Both parties have asked for more time to finalize an agreement and consider all the relevant policy implications. In the main, however, it’s a substantially similar agreement to the one between the SEC and Ripple yesterday.
Binance and SEC Discussing a Settlement
The SEC has been dropping a lot of its most prominent enforcement actions lately, such as its lawsuit against Ripple. Still, despite this progress, a few outstanding cases remain.
The SEC has been ending lawsuits against prominent exchanges like Coinbase and Kraken, and now it’s preparing to drop one against Binance:
“Pursuant to the Court’s February 13, 2025 Minute Order, Plaintiff Securities and Exchange Commission and Defendants Binance Holdings Limited… and Changpeng Zhao submit this joint status report and jointly move to continue to stay this case for a period of 60 additional days,” a motion filed today read.
Binance is the world’s largest crypto exchange, and it has been engaged in this fight since 2023. The SEC sued Binance in June of that year, alleging that it committed a few serious crimes.
In addition to violating securities laws, the Commission also claims that Binance deliberately lied to regulators. This caused serious problems for its business, prompting a lengthy battle.
The SEC, however, is under new management now. Paul Atkins is the Commission’s new Chair, and he’s prioritized friendly crypto regulation.
Before his confirmation, the SEC, under Acting Chair Mark Uyeda, filed a joint request with Binance to pause the lawsuit 60 days ago, and they’re asking for another extension.
Today’s filing is slightly shorter than the previous one, but it suggests that real progress has been made. It claims that Binance and the SEC “have been in productive discussions” concerning the Crypto Task Force and broader policy implications of a settlement. However, they still need more time to fully consider a resolution.
This agreement is similar to the one filed yesterday. Specifically, the Commission also requested a 60-day pause in a cross-appeal from Ripple, attempting to tie up loose ends without wasting the court’s resources.
There are a few subtle differences, but Binance’s filing with the SEC attempts to meet the same basic goals.
Disclaimer
In adherence to the Trust Project guidelines, BeInCrypto is committed to unbiased, transparent reporting. This news article aims to provide accurate, timely information. However, readers are advised to verify facts independently and consult with a professional before making any decisions based on this content. Please note that our Terms and Conditions, Privacy Policy, and Disclaimers have been updated.

Ethereum Leads Market-Wide Drawdown As Altcoin Correlation Spikes – Details

Pump.fun Reopens Livestreams with Strict Moderation
Will the SEC Approve Ethereum ETF Staking?
US SEC and Binance Agree To Pause Legal Proceedings for 60 More Days

Binance and the SEC File for Pause in Lawsuit

Crypto Whales Are Buying These Altcoins Post Tariffs Pause


-
 Altcoin22 hours ago
XRP Price Risks 40% Drop to $1.20 If It Doesn’t Regain This Level
-

 Market21 hours ago
President Trump Signs First-Ever Crypto Bill into Law
-

 Market20 hours ago
XRP Price Ready to Run? Bulls Eyes Fresh Gains Amid Bullish Setup
-

 Market22 hours ago
Ethereum Price Cools Off—Can Bulls Stay in Control or Is Momentum Fading?
-
 Altcoin20 hours ago
BNB Chain Completes Lorentz Testnet Hardforks; Here’s The Timeline For Mainnet
-

 Market15 hours ago
HBAR Buyers Fuel Surge with Golden Cross, Suggesting Upside
-

 Market17 hours ago
How Vitalik Buterin Plans to Enhance Ethereum’s Privacy
-
 Bitcoin19 hours ago
Over $2.5 Billion in Bitcoin and Ethereum Options Expire Today
 Arabic
 Chinese (Simplified)
 Dutch
Dutch English
 French
 German
 Italian
 Portuguese
 Russian
 Spanish
 Vietnamese