
Market
Artificial Intelligence Coins on the Rise: DIA, DEAI, and LAMB
As the first week of October 2024 wraps up, several Artificial Intelligence (AI) coins are making waves with standout price performances and increasing investor interest.
In this analysis, BeInCrypto highlights the top three AI coins dominating the market, examining the key drivers behind their rise and what could be on the horizon in the coming weeks.
DIA
DIA is a company specializing in cross-chain oracles for Web3. It delivers services like digital asset price feeds, adjustable NFT floor price feeds, multi-chain randomness for DeFi and GameFi applications, and the creation of bespoke oracles for decentralized apps.
DIA surged 47.79% over the past seven days, ranking it among the top-performing artificial intelligence coins during this period. Its price skyrocketed from $0.41 on September 29 to $0.92 by October 1, marking an impressive 124% gain. Following this surge, the price corrected back to $0.59.
Despite this retracement, DIA’s Exponential Moving Average (EMA) lines remain bullish. The short-term EMAs continue to stay above the long-term ones, signaling that the bullish trend is still intact, although it has weakened compared to the earlier peak.
Read more: How Will Artificial Intelligence (AI) Transform Crypto?
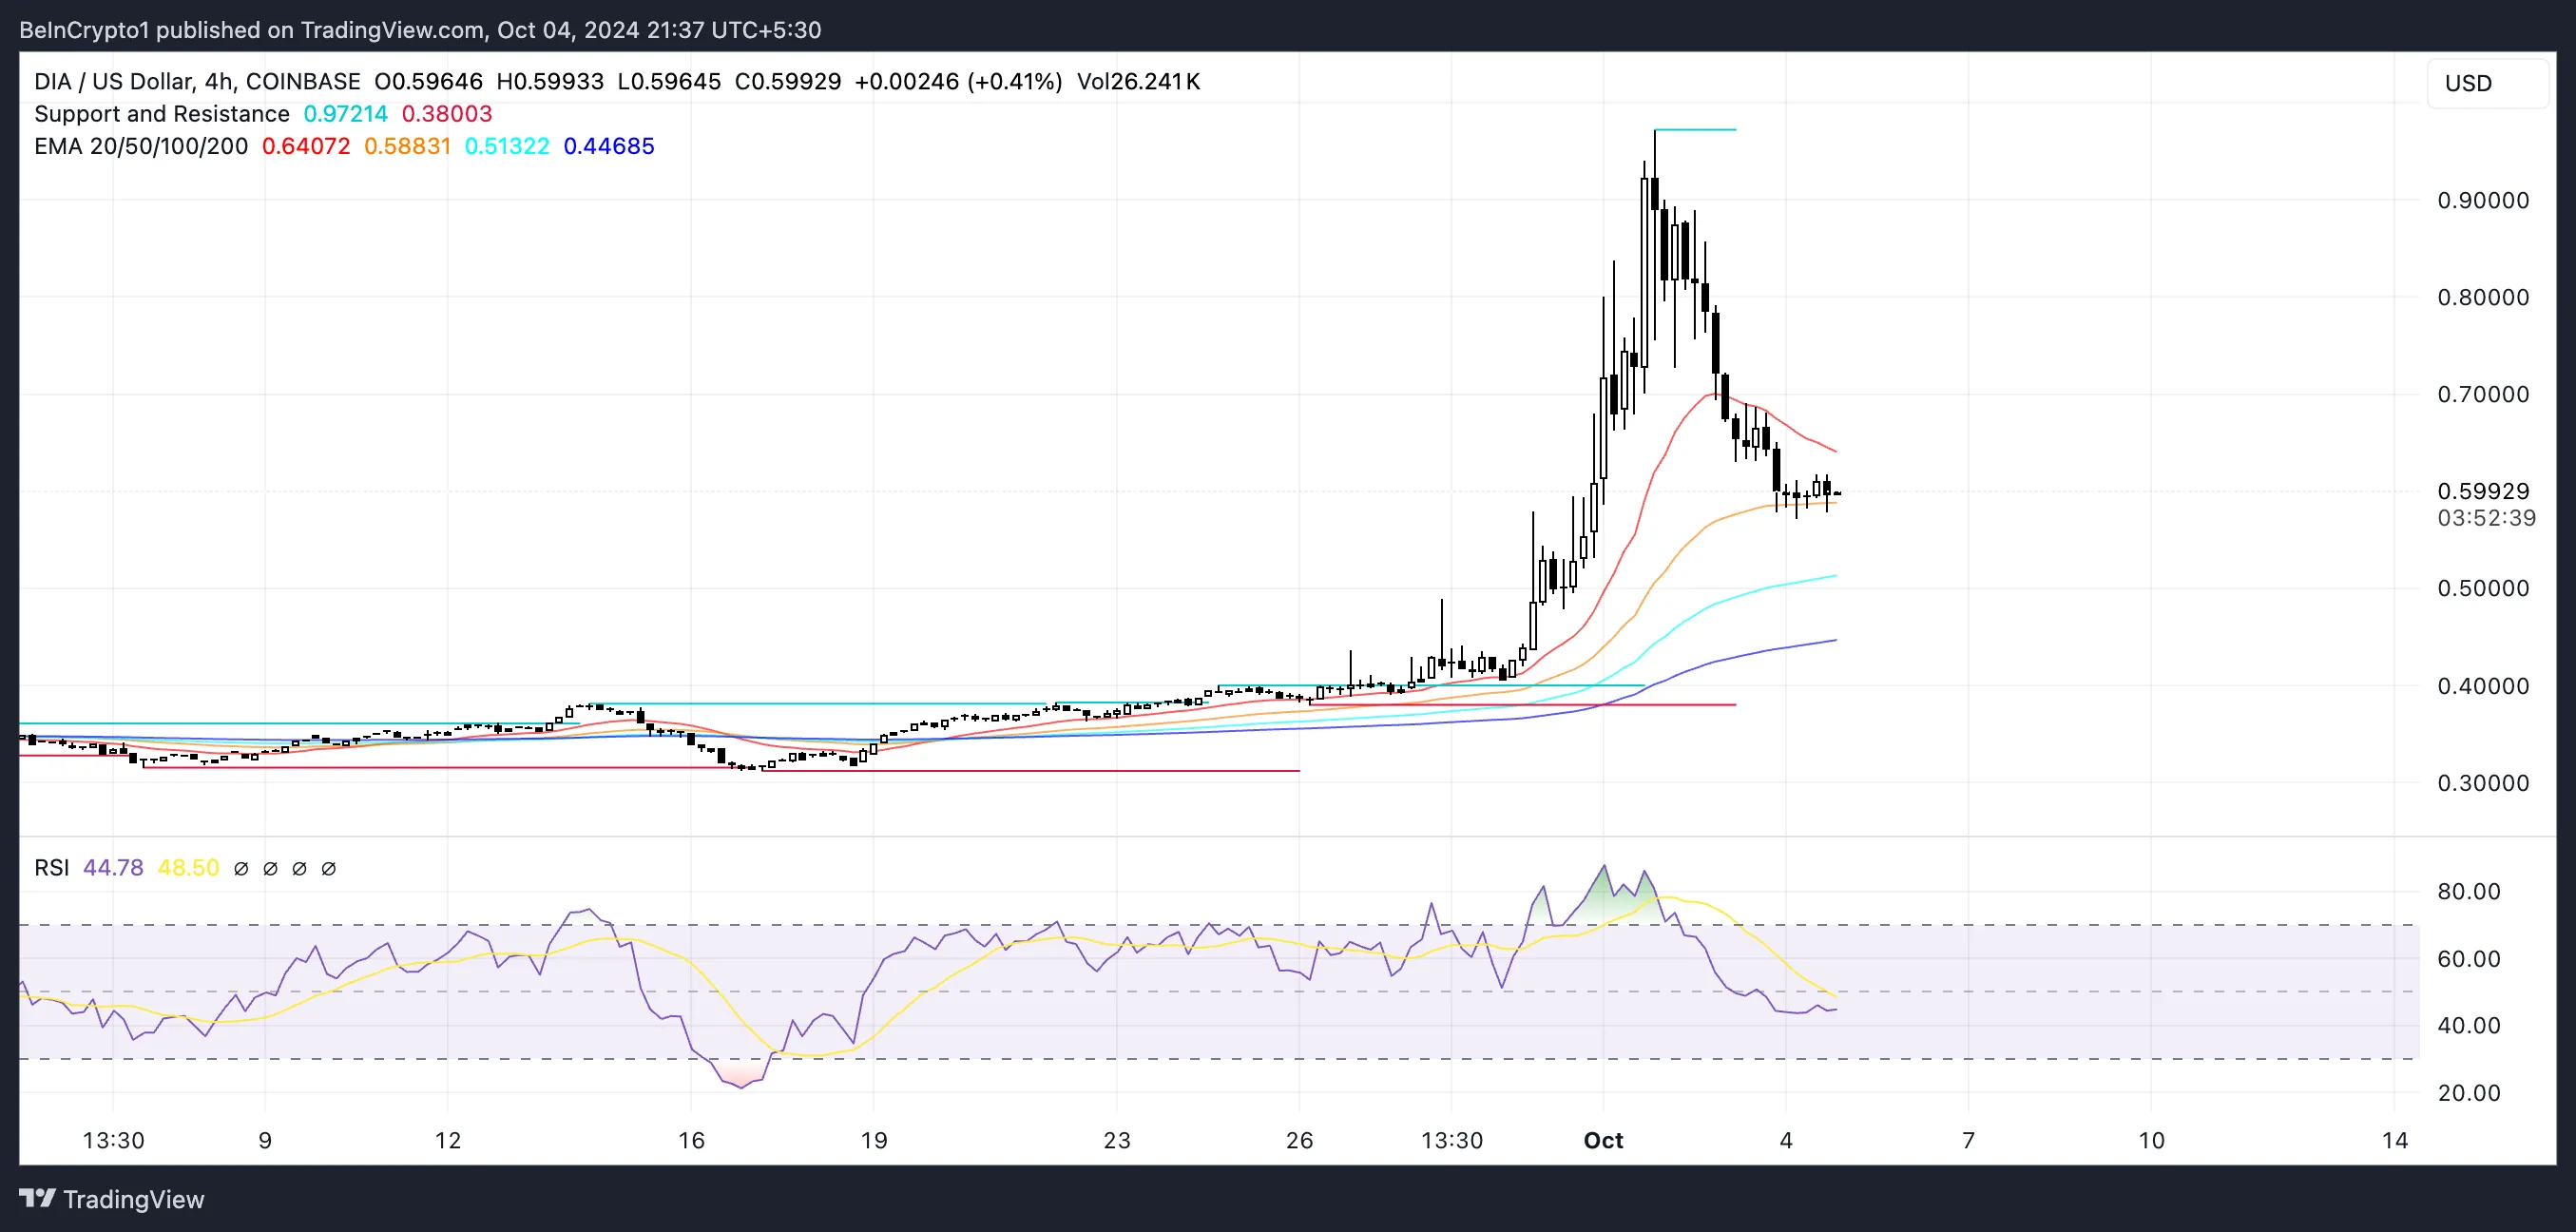
The DIA’s Relative Strength Index (RSI) currently stands at 44.68, which suggests it is neither overbought nor oversold. RSI is a momentum indicator that ranges from 0 to 100 and is used to gauge whether an asset is overbought (above 70) or oversold (below 30) territory.
With DIA’s RSI at 44.68, it indicates that the asset is in a neutral zone, showing steady movement without extreme pressure in either direction. This level suggests there is still potential room for upward growth before hitting an overbought condition. That implies that DIA could have more upside momentum ahead.
Zero1 Labs (DEAI)
DEAI is the token from Zero1 Labs, a platform dedicated to developing decentralized artificial intelligence applications. Zero1 Labs offers Keymaker, an open platform that includes a DeAI (Decentralized Artificial Intelligence) toolset, API, and dApp Store, along with Cypher, a blockchain optimized for AI and large language models, with a focus on data governance and ownership. The platform is designed to simplify the creation and monetization of DeAI apps.
DEAI price surged 14.05% in the last week, currently sitting at $0.41. DEAI EMA lines are strongly bullish, with the short-term lines all above the long-term lines. They also show a good distance between them, which shows the uptrend is sustainable.
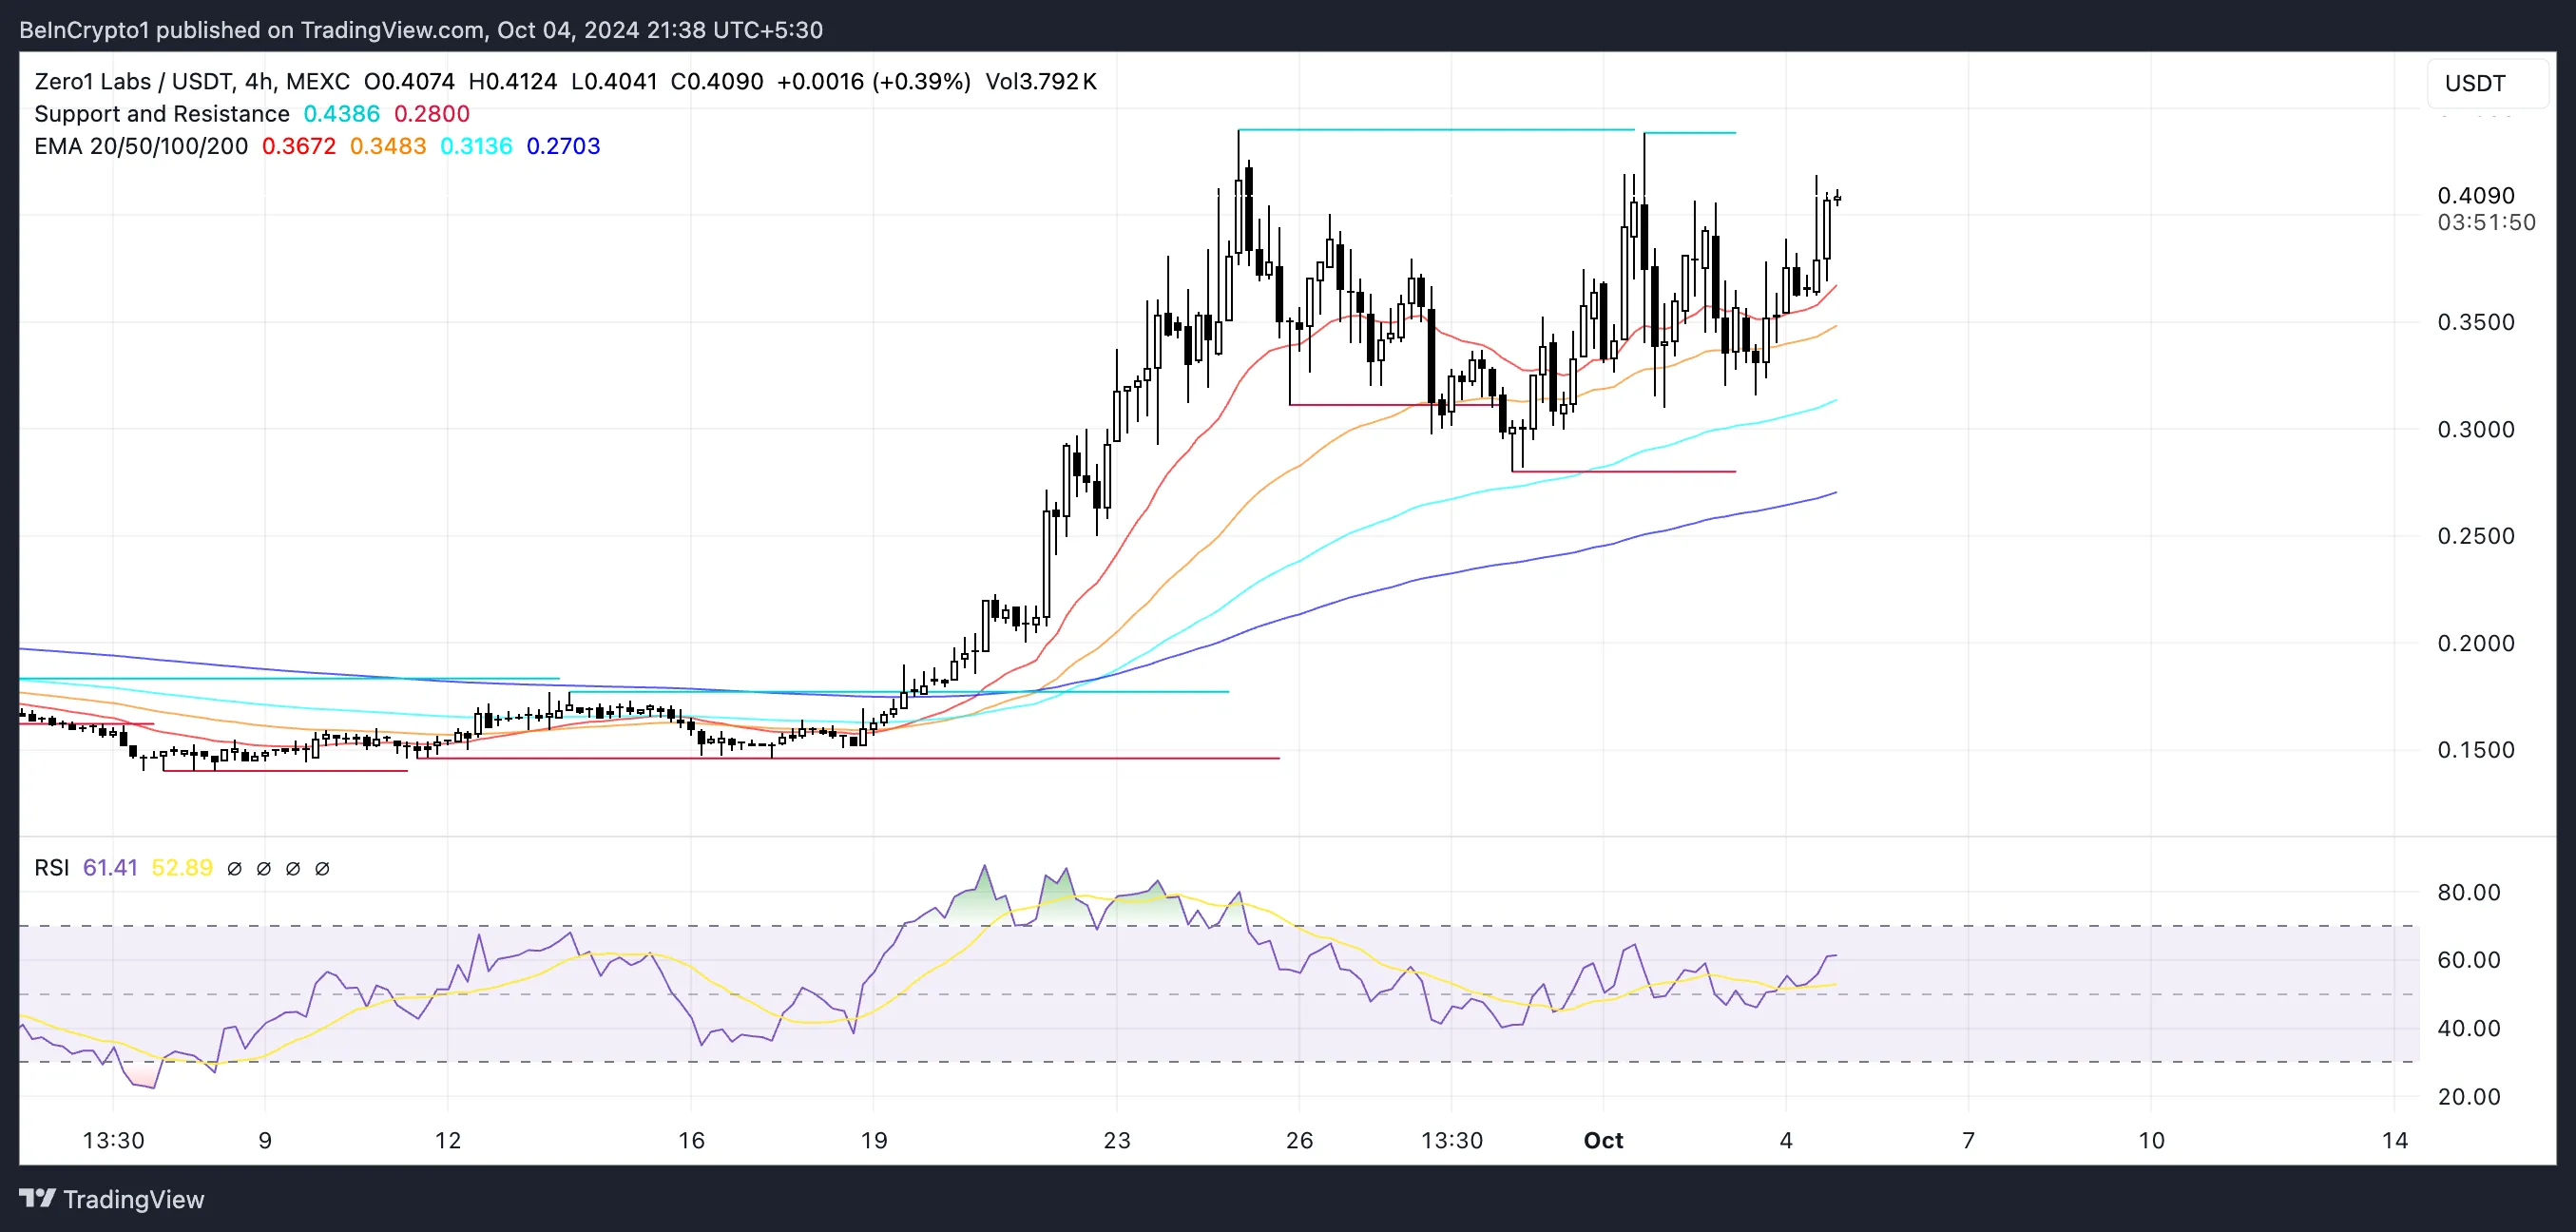
DEAI currently shows support at $0.31, and its next resistance is at $0.43, which should be tested soon. Its relative Strength Index (RSI) currently stands at 61.41. That indicates that while it is nearing the overbought threshold of 70, it still has some room for potential growth.
With DEAI’s RSI approaching 70, the token shows signs of strength and upward momentum. However, it could be nearing a point where gains could slow or a correction may occur. While there is still room for growth, this momentum may not last much longer as it inches closer to the overbought zone.
Lambda (LAMB)
LAMB is the coin of Lambda, a storage network that defines itself as the “leading omnichain modular storage”, supporting DeFi and artificial intelligence applications. LAMB price followed the same trend from DIA and DEAI, surging from $0.0016 on September 27 to $0.0030 on September 30. That represents an 87,5% growth in just three days.
It then dropped to $0.0023, but its price chart still shows a growing potential for the next few days. LAMB EMA lines still look bullish, although the distance between its two short-term lines is not as big as before. This could indicate that the current uptrend is less strong.
Read more: How To Invest in Artificial Intelligence (AI) Cryptocurrencies?
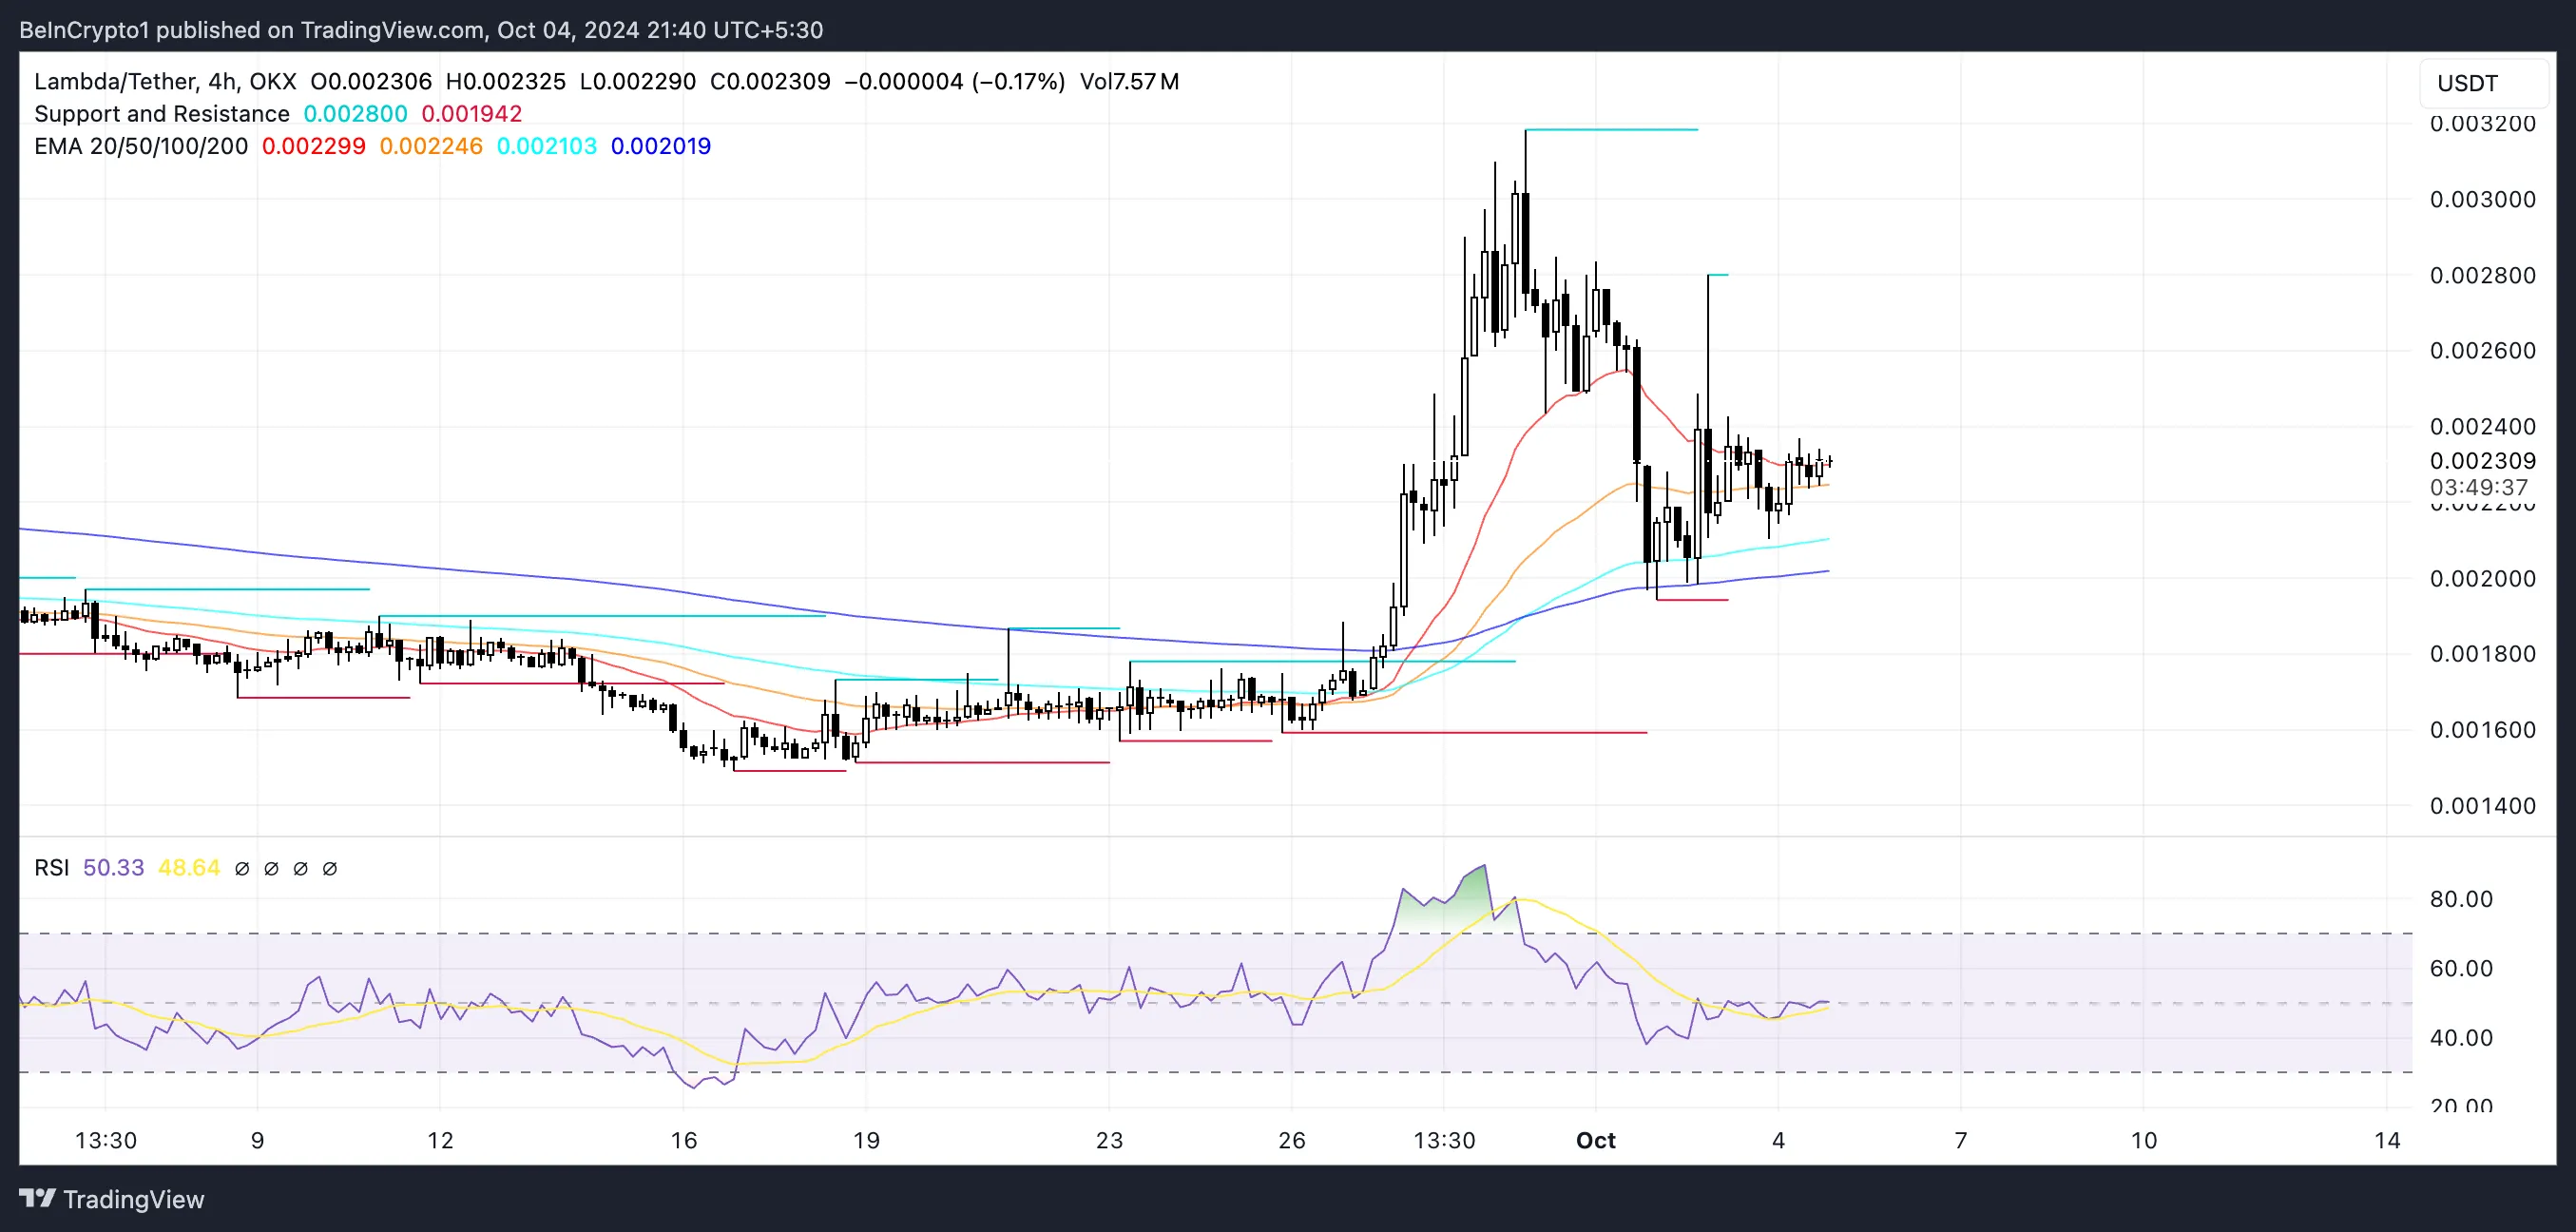
LAMB’s RSI currently sits at 50.33, signaling that the asset is in a neutral position, neither overbought nor oversold. This leaves ample room for growth as it indicates that LAMB is not facing excessive buying pressure yet.
If the current uptrend continues, LAMB could soon retest the $0.0030 resistance level, presenting a potential 32% increase opportunity. With its RSI comfortably in the middle, there is space for further upward momentum before any significant resistance is encountered.
Disclaimer
In line with the Trust Project guidelines, this price analysis article is for informational purposes only and should not be considered financial or investment advice. BeInCrypto is committed to accurate, unbiased reporting, but market conditions are subject to change without notice. Always conduct your own research and consult with a professional before making any financial decisions. Please note that our Terms and Conditions, Privacy Policy, and Disclaimers have been updated.


Reason to trust
![]()
Strict editorial policy that focuses on accuracy, relevance, and impartiality
Created by industry experts and meticulously reviewed
The highest standards in reporting and publishing
Strict editorial policy that focuses on accuracy, relevance, and impartiality
Morbi pretium leo et nisl aliquam mollis. Quisque arcu lorem, ultricies quis pellentesque nec, ullamcorper eu odio.
Ethereum price started a increase from the $1,550 zone. ETH is now rising and might attempt to recover above the $1,650 resistance.
- Ethereum started a fresh increase above the $1,580 and $1,600 levels.
- The price is trading above $1,600 and the 100-hourly Simple Moving Average.
- There was a break above a connecting bearish trend line with resistance at $1,590 on the hourly chart of ETH/USD (data feed via Kraken).
- The pair could start a fresh increase if it clears the $1,650 resistance zone.
Ethereum Price Eyes Upside Break
Ethereum price remained stable above the $1,500 level and started a fresh increase, like Bitcoin. ETH traded above the $1,550 and $1,600 levels to enter a short-term positive zone.
There was a break above a connecting bearish trend line with resistance at $1,590 on the hourly chart of ETH/USD. The pair even cleared the $1,620 resistance. A high was formed at $1,644 and the price is stable above the 23.6% Fib retracement level of the upward move from the $1,566 swing low to the $1,644 high.
Ethereum price is now trading above $1,600 and the 100-hourly Simple Moving Average. On the upside, the price seems to be facing hurdles near the $1,640 level. The next key resistance is near the $1,650 level. The first major resistance is near the $1,680 level.

A clear move above the $1,680 resistance might send the price toward the $1,720 resistance. An upside break above the $1,720 resistance might call for more gains in the coming sessions. In the stated case, Ether could rise toward the $1,800 resistance zone or even $1,840 in the near term.
Downside Correction In ETH?
If Ethereum fails to clear the $1,650 resistance, it could start a downside correction. Initial support on the downside is near the $1,620 level. The first major support sits near the $1,605 zone and the 50% Fib retracement level of the upward move from the $1,566 swing low to the $1,644 high.
A clear move below the $1,605 support might push the price toward the $1,580 support. Any more losses might send the price toward the $1,550 support level in the near term. The next key support sits at $1,500.
Technical Indicators
Hourly MACD – The MACD for ETH/USD is gaining momentum in the bullish zone.
Hourly RSI – The RSI for ETH/USD is now above the 50 zone.
Major Support Level – $1,600
Major Resistance Level – $1,650
Barry Silbert, CEO of Digital Currency Group, has stated that Bittensor (TAO) has the potential to outperform Bitcoin (BTC) as a global store of value.
His comments come amid notable growth in the Bittensor network, with its subnet ecosystem market capitalization and the TAO token’s price on the rise.
Will Bittensor’s Decentralized AI Model Outperform Bitcoin’s Legacy?
In a recent interview with Raoul Pal, Silbert highlighted the growing influence of artificial intelligence (AI) in the crypto sector. According to him, Bittensor is at the forefront of this revolution, representing the “next big era for crypto.”
“You had the Bitcoin and the Ethereum and the NFTs, and you had the layer 2s and DeFi. I think this is the next big investment theme for crypto,” Silbert stated.
He went on to explain that Bittensor shares the same pioneering spirit as early Bitcoin. Still, its purpose extends beyond financial sovereignty.
“The boldest prediction that I could make for Bittensor is it could be a better version of Bitcoin as a global store of value,” he claimed.
He argued that instead of the $10 to $12 billion spent annually to secure the Bitcoin network, that same amount could be redirected toward incentivizing a global network of individuals working to solve major world problems. He envisions this money fostering innovation on a massive scale, with the potential to grow into a multi-billion-dollar ecosystem.
While acknowledging the value of securing the Bitcoin network, Silbert emphasized that Bittensor’s potential lies in its ability to harness this vast financial backing to address real-world challenges.
He noted that Bittensor operates on a similar economic model to Bitcoin, with halving mechanisms and decentralization, positioning it as a powerful contender in the quest for a more impactful and value-driven global network.
Silbert also noted that while plenty of decentralized AI projects have emerged, Bittensor has set itself apart. He referred to it as having reached “escape velocity.” This term is used to convey a project’s rapid growth and increasing market influence.
“99.9% of crypto tokens that are out there have no reason to exist and are worthless,” he added.
Market data reflects the growing enthusiasm for Bittensor. Notably, amid the ongoing volatility, TAO has fared well in comparison to the broader market, rising 32.1% in the last week. At press time, the altcoin was trading at $328, up 7.2% over the past day.

Additionally, TAO is currently the top trending cryptocurrency on CoinGecko, underlining its rising popularity among investors. Google Trends data further proves the growing interest in Bittensor. The search volume peaked at 100 at the time of writing.
Meanwhile, the Bittensor ecosystem is also seeing notable progress. The latest data indicated that the market capitalization of Bittensor’s subnet tokens more than doubled in April 2025.

It increased by 166%, rising from $181 million at the beginning of April to $481 million at press time. As reported by BeInCrypto, this growth follows a tripling of active subnets over the past year.
Disclaimer
In adherence to the Trust Project guidelines, BeInCrypto is committed to unbiased, transparent reporting. This news article aims to provide accurate, timely information. However, readers are advised to verify facts independently and consult with a professional before making any decisions based on this content. Please note that our Terms and Conditions, Privacy Policy, and Disclaimers have been updated.

Aayush Jindal, a luminary in the world of financial markets, whose expertise spans over 15 illustrious years in the realms of Forex and cryptocurrency trading. Renowned for his unparalleled proficiency in providing technical analysis, Aayush is a trusted advisor and senior market expert to investors worldwide, guiding them through the intricate landscapes of modern finance with his keen insights and astute chart analysis.
From a young age, Aayush exhibited a natural aptitude for deciphering complex systems and unraveling patterns. Fueled by an insatiable curiosity for understanding market dynamics, he embarked on a journey that would lead him to become one of the foremost authorities in the fields of Forex and crypto trading. With a meticulous eye for detail and an unwavering commitment to excellence, Aayush honed his craft over the years, mastering the art of technical analysis and chart interpretation.
As a software engineer, Aayush harnesses the power of technology to optimize trading strategies and develop innovative solutions for navigating the volatile waters of financial markets. His background in software engineering has equipped him with a unique skill set, enabling him to leverage cutting-edge tools and algorithms to gain a competitive edge in an ever-evolving landscape.
In addition to his roles in finance and technology, Aayush serves as the director of a prestigious IT company, where he spearheads initiatives aimed at driving digital innovation and transformation. Under his visionary leadership, the company has flourished, cementing its position as a leader in the tech industry and paving the way for groundbreaking advancements in software development and IT solutions.
Despite his demanding professional commitments, Aayush is a firm believer in the importance of work-life balance. An avid traveler and adventurer, he finds solace in exploring new destinations, immersing himself in different cultures, and forging lasting memories along the way. Whether he’s trekking through the Himalayas, diving in the azure waters of the Maldives, or experiencing the vibrant energy of bustling metropolises, Aayush embraces every opportunity to broaden his horizons and create unforgettable experiences.
Aayush’s journey to success is marked by a relentless pursuit of excellence and a steadfast commitment to continuous learning and growth. His academic achievements are a testament to his dedication and passion for excellence, having completed his software engineering with honors and excelling in every department.
At his core, Aayush is driven by a profound passion for analyzing markets and uncovering profitable opportunities amidst volatility. Whether he’s poring over price charts, identifying key support and resistance levels, or providing insightful analysis to his clients and followers, Aayush’s unwavering dedication to his craft sets him apart as a true industry leader and a beacon of inspiration to aspiring traders around the globe.
In a world where uncertainty reigns supreme, Aayush Jindal stands as a guiding light, illuminating the path to financial success with his unparalleled expertise, unwavering integrity, and boundless enthusiasm for the markets.

Dollar Dips While Bitcoin Hits New Heights

Ethereum Price Clings to Support—Upside Break Could Trigger Rally

Expert Reveals Why BlackRock Hasn’t Pushed for an XRP ETF
Will Bittensor Surpass Bitcoin as a Store of Value? Expert Predicts

Solana, Bitcoin in Texas, and Initia

XRP Bulls Defend $2.00—Is a Fresh Price Surge Loading?

2.52 Million Altcoins Are Ruining Crypto’s Future

Animoca Brands Valuation Tanks 75% In Two Years, Here’s Why

Crypto exchange BingX hacked for $43 million

Are The Big Players Losing Interest?

Hong Kong’s Securities Association Tips Authorities On Crypto Self-Regulation

Coinbase cbBTC Set to go Live on Solana
2.52 Million Altcoins Are Ruining Crypto’s Future
Animoca Brands Valuation Tanks 75% In Two Years, Here’s Why
Crypto exchange BingX hacked for $43 million
Are The Big Players Losing Interest?
Hong Kong’s Securities Association Tips Authorities On Crypto Self-Regulation
Coinbase cbBTC Set to go Live on Solana
-
 Market18 hours ago
1 Year After Bitcoin Halving: What’s Different This Time?
-

 Market19 hours ago
VOXEL Climbs 200% After Suspected Bitget Bot Glitch
-

 Market22 hours ago
MELANIA Crashes to All-Time Low Amid Insiders Continued Sales
-

 Market17 hours ago
Tokens Big Players Are Buying
-

 Market23 hours ago
Charles Schwab Plans Spot Crypto Trading Rollout in 2026
-

 Market16 hours ago
Dogecoin Defies Bullish Bets During Dogeday Celebration
-

 Ethereum24 hours ago
Ethereum Enters Historic Buy Zone As Price Dips Below Key Level – Insights
-

 Market14 hours ago
Will XRP Break Support and Drop Below $2?