
Market
Are OP Retail Traders To Blame?

The value of OP, the token driving the leading Layer-2 (L2) network Optimism, has dropped 19% over the past month. As of press time, the altcoin is trading at $1.37.
This decline is largely attributed to a surge in selling pressure, highlighted by an increase in its exchange netflows during this period.
Optimism Whales Take a Different Route
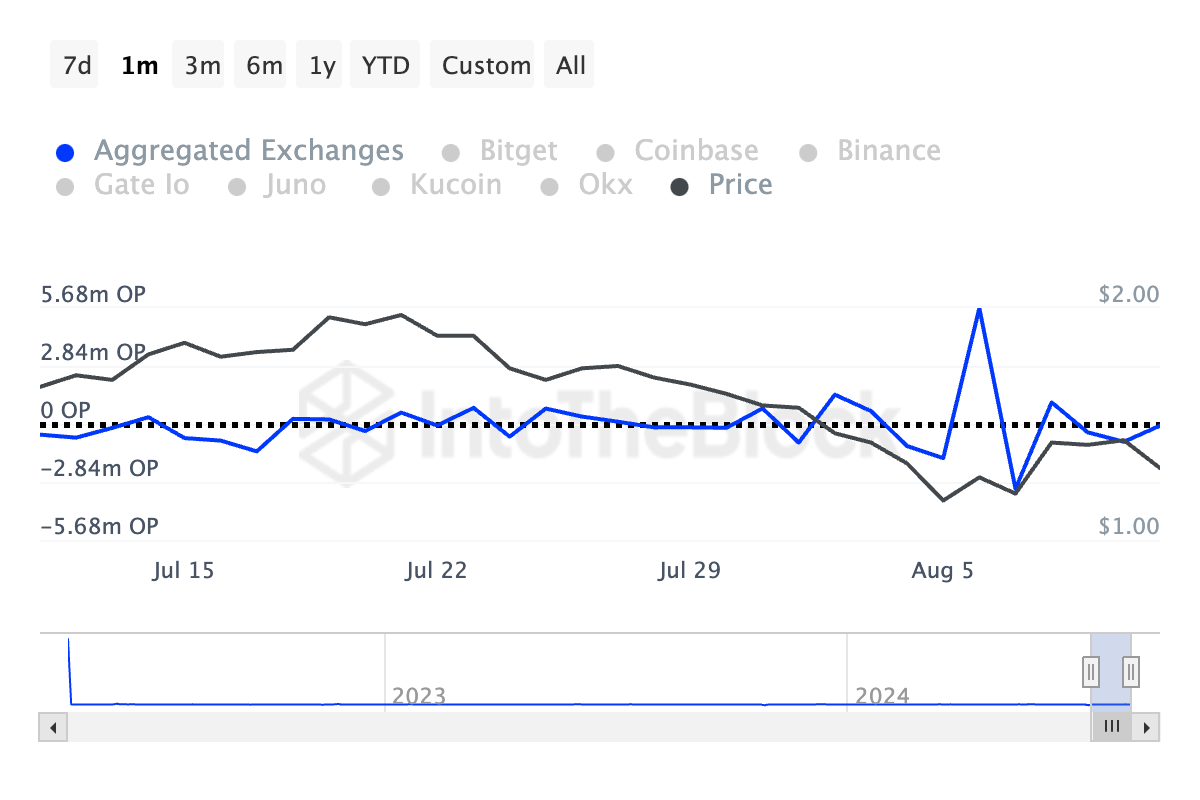
Over the past month, OP’s exchange netflows have surged, indicating increased selling activity.
Exchange netflows measure the net amount of tokens moving into or out of cryptocurrency exchanges. Increased netflows suggest that traders are depositing more tokens onto exchanges, typically indicating an intent to sell. Conversely, a decline indicates large withdrawals, often for long-term holding or cold storage.
Data from IntoTheBlock shows that 585,000 OP tokens have been sent to exchanges in the past month, contributing to significant selling pressure. This influx has driven OP’s price down by double digits over the last 30 days.
An analysis of OP’s trading activity reveals that while retail traders may have been selling, larger investors, or “whales,” have been net buyers during the past month. A 67% increase in large holders’ netflow over the last 30 days shows that these investors have accumulated more OP tokens than they have sold during this period.
Read more: What Is Optimism?
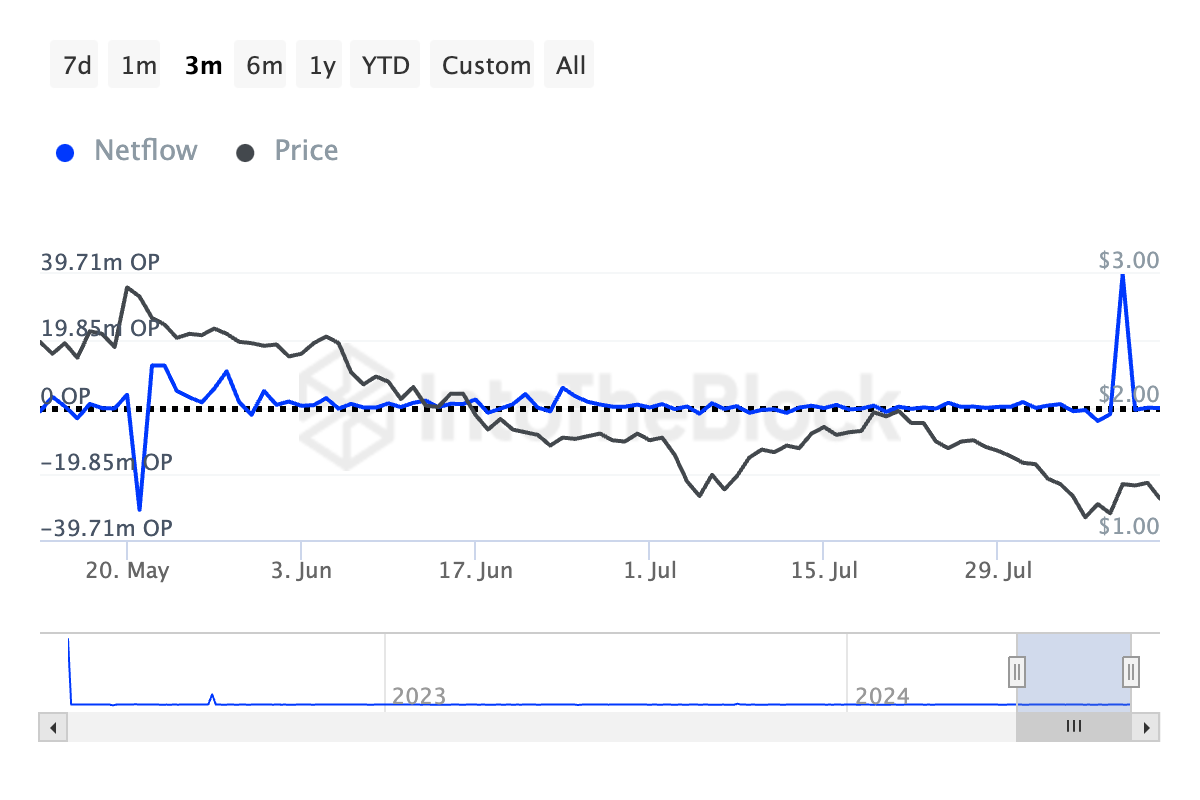
Large holders, or whale addresses, are those that own over 0.1% of an asset. Their netflow measures the difference between the amount of tokens they buy and sell over a specific period.
A spike in an asset’s large holder netflow indicates increased buying activity among these whales, which is typically seen as a bullish signal. This suggests that a price rally could be on the horizon as these significant investors accumulate more tokens.
OP Price Prediction: Little Possibility of a Rally
An assessment of OP’s price movements reveals the possibility of an extension of its 30-day decline. As of this writing, the token’s Relative Strength Index (RSI) lies below its 50-neutral line at 43.83, signaling a decreased demand for the L2 token.
This momentum indicator measures an asset’s oversold and overbought market conditions. It ranges between 0 and 100, with values above 70 suggesting that an asset is overbought and due for a correction. In contrast, values under 30 indicate that the asset is oversold and due for a rebound. At 43.83, OP’s RSI highlights the preference for distribution over accumulation among the token’s market participants.
Moreover, OP’s Chaikin Money Flow (CMF), which tracks the inflow and outflow of capital in its market, is currently negative. With a CMF reading of -0.13 at press time, the OP market is experiencing a liquidity outflow, which continues to exert downward pressure on its price.
Read more: Optimism vs. Arbitrum: Ethereum Layer-2 Rollups Compared
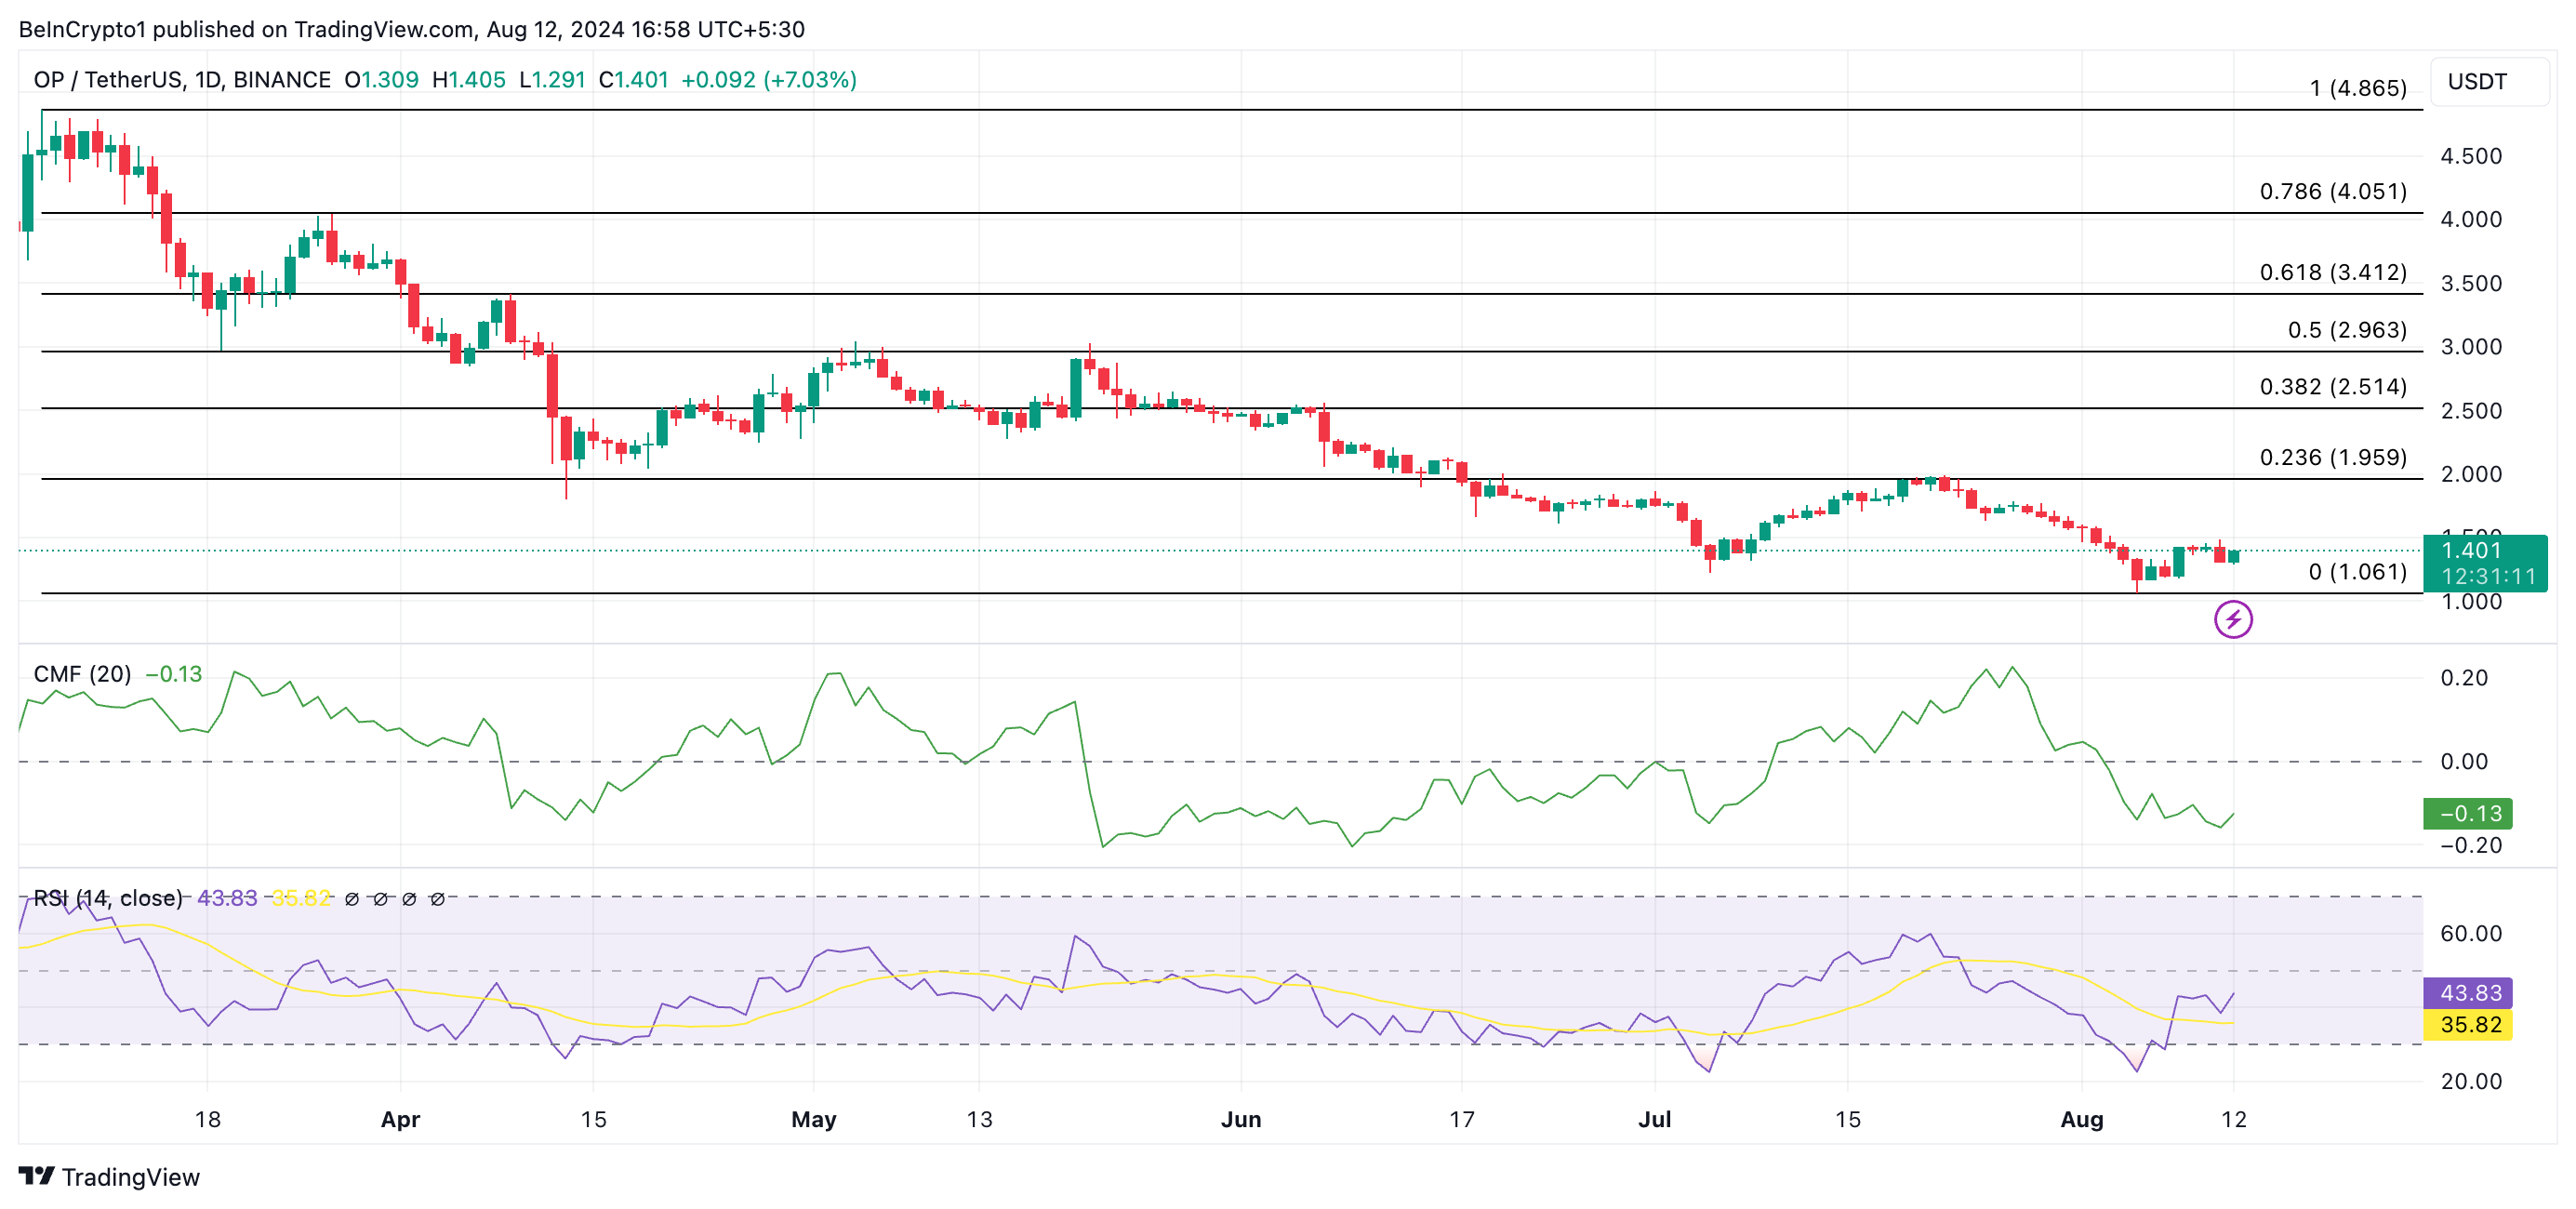
If this trend persists, the token’s price may fall to $1.06. However, if the market trend shifts from bearish to bullish, OP’s value may rally to $1.95.
Disclaimer
In line with the Trust Project guidelines, this price analysis article is for informational purposes only and should not be considered financial or investment advice. BeInCrypto is committed to accurate, unbiased reporting, but market conditions are subject to change without notice. Always conduct your own research and consult with a professional before making any financial decisions. Please note that our Terms and Conditions, Privacy Policy, and Disclaimers have been updated.


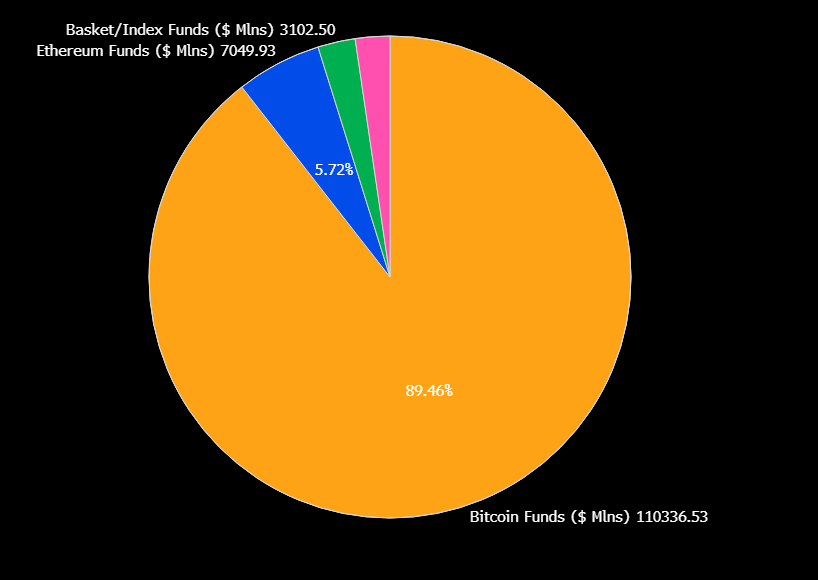
As the SEC is signaling its willingness to approve new altcoin ETFs, 72 active proposals are awaiting a nod. Despite the growing interest from asset managers to launch more altcoin-based products in the institutional market, Bitcoin ETFs currently command 90% of crypto fund assets worldwide.
New listings can attract inflows and liquidity in these tokens, as demonstrated by Ethereum’s approval of ETF options. Still, given the current market interest, it’s highly unlikely that any crypto found will replicate Bitcoin’s runaway success in the ETF market
Bitcoin Dominates the ETF Market
Bitcoin ETFs dramatically changed the global digital assets market over the past month, and they are performing quite well at the moment. In the US, total net assets have reached $94.5 billion, despite continuous outflows in the past few months.
Their impressive early success opened a new market for crypto-related assets, and issuers have been flooding the SEC with new applications since.
This flood has been so intense that there are currently 72 active proposals for the SEC’s consideration:
“There are now 72 crypto-related ETFs sitting with the SEC awaiting approval to list or list options. Everything from XRP, Litecoin and Solana to Penguins, Doge and 2x MELANIA and everything in between. Gonna be a wild year,” claimed ETF analyst Eric Balchunas.
The US regulatory environment has become much friendlier toward crypto, and the SEC is signaling its willingness to approve new products. Many ETF issuers are attempting to seize the opportunity to create a product as successful as Bitcoin.
However, Bitcoin has a sizable head start, and it’s difficult to imagine any newcomer disrupting its 90% market share.
To put that into perspective, BlackRock’s Bitcoin ETF was declared “the greatest launch in ETF history.” Any new altcoin product would need a significant value-add to encroach upon Bitcoin’s position.
Recent products like Ethereum ETF options have attracted fresh liquidity. Yet, Bitcoin’s dominance in the institutional market remains unchanged.
Of these 72 proposals, only 23 refer to altcoins other than Solana, XRP, or Litecoin, and many more concern new derivatives on existing ETFs.
Some analysts claim that these products, taken together, couldn’t displace more than 5-10% of Bitcoin’s ETF market dominance. If an event significantly disrupted Bitcoin, it would also impact the rest of crypto.
Still, that doesn’t mean that the altcoins ETFs are a futile endeavor. These products have continually created new inflows and interest in their underlying assets, especially with issuers acquiring token stockpiles.
However, it’s important to be realistic. While XRP and Solana ETF approvals could drive new bullish cycles for the altcoin market, Bitcoin will likely dominate the ETF market by a large margin — given its widespread recognition as a ‘store of value’.
Disclaimer
In adherence to the Trust Project guidelines, BeInCrypto is committed to unbiased, transparent reporting. This news article aims to provide accurate, timely information. However, readers are advised to verify facts independently and consult with a professional before making any decisions based on this content. Please note that our Terms and Conditions, Privacy Policy, and Disclaimers have been updated.

Coinbase is listing Reserve Rights (RSR), a dual‑token stablecoin platform aimed at creating a collateral‑backed, self‑regulating stablecoin ecosystem. Following the announcement, Binance’s ‘smart money’ traders are increasing long positions on the altcoin.
Incoming SEC Chair Paul Atkins was an early advisor for RSR, but he doesn’t maintain any active connection to the project. Nonetheless, RSR speculators may be anticipating some benefits from this old association.
Coinbase Lists RSR To New Enthusiasm
RSR has been active since 2019, aiming to upend the stablecoin ecosystem. It’s an ERC‑20 utility and governance token that underpins the Reserve Protocol, a dual‑token system designed to back and stabilize the Reserve stablecoin (RSV) at a $1 USD peg. RSR, a non-stablecoin, provides governance and backstop insurance to its counterpart.
The asset’s valuation peaked in 2021 but has been quiet since then until regaining prominence in 2024. Today’s Coinbase listing announcement saw RSR jump nearly 10%.
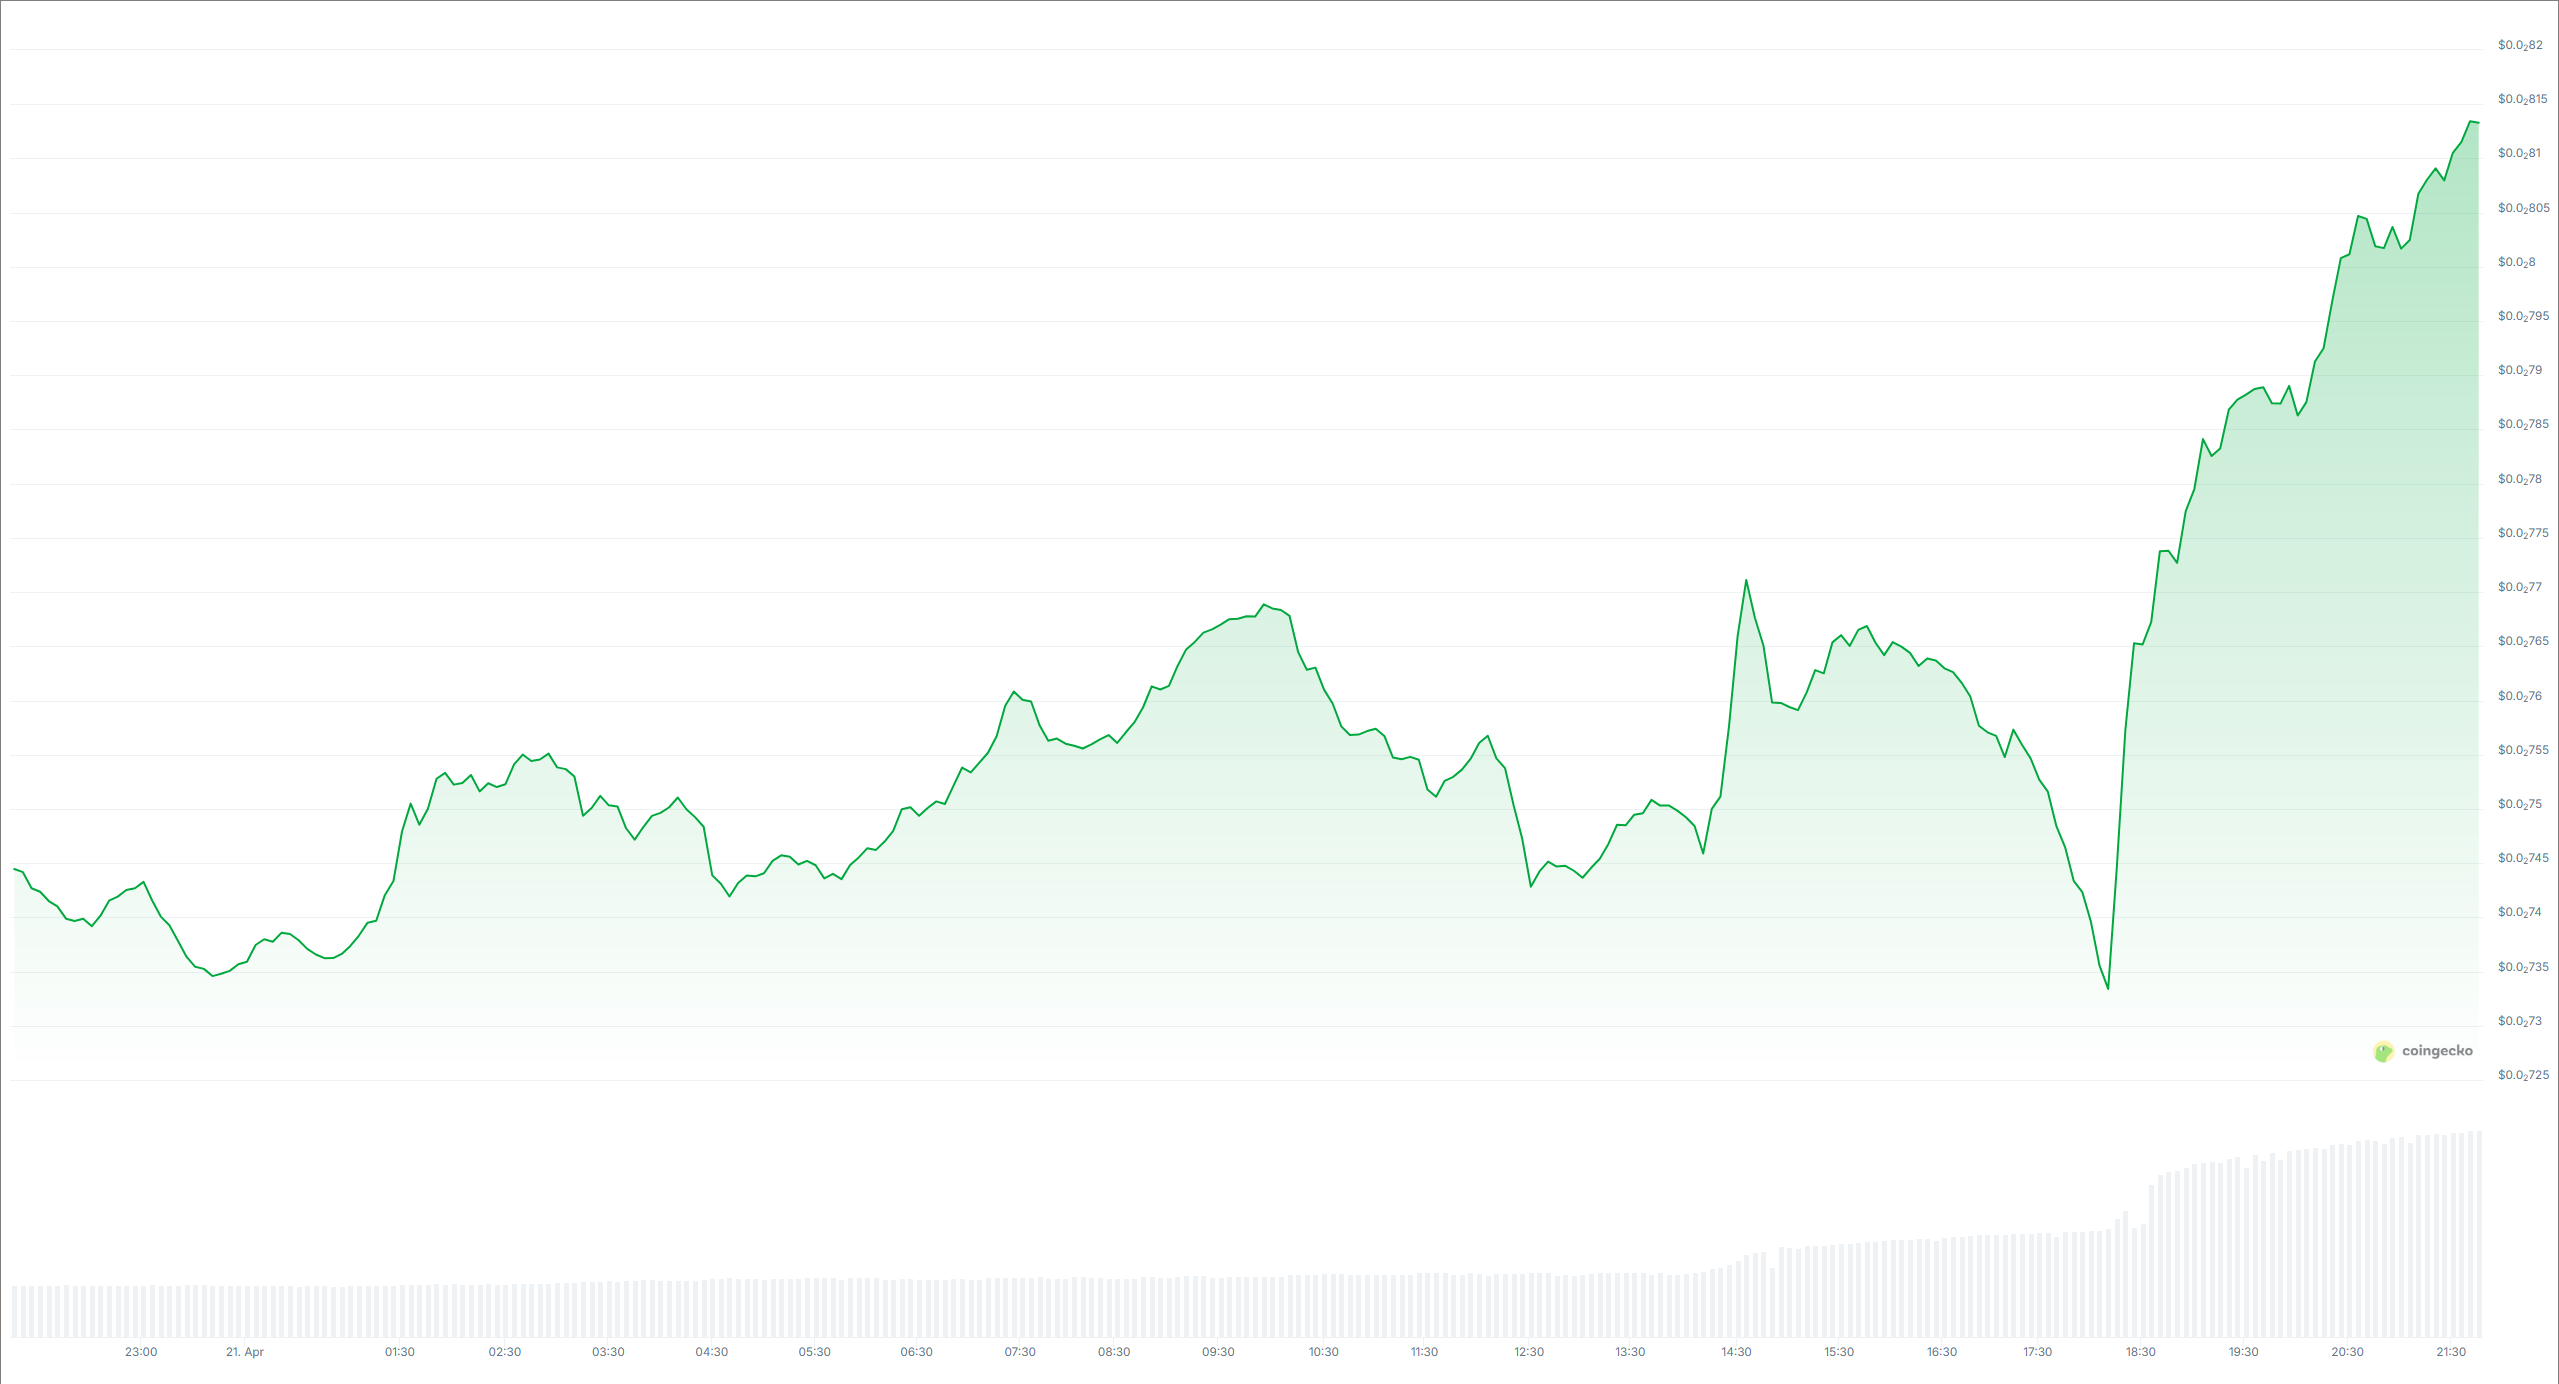
Coinbase first announced that it would list RSR a little under three weeks ago. Coinbase listings usually cause the underlying tokens to spike, and this has been no exception.
However, an intriguing side effect has also taken place. As the asset prepares its debut on Coinbase, top traders on Binance are showing a strong bullish positioning.
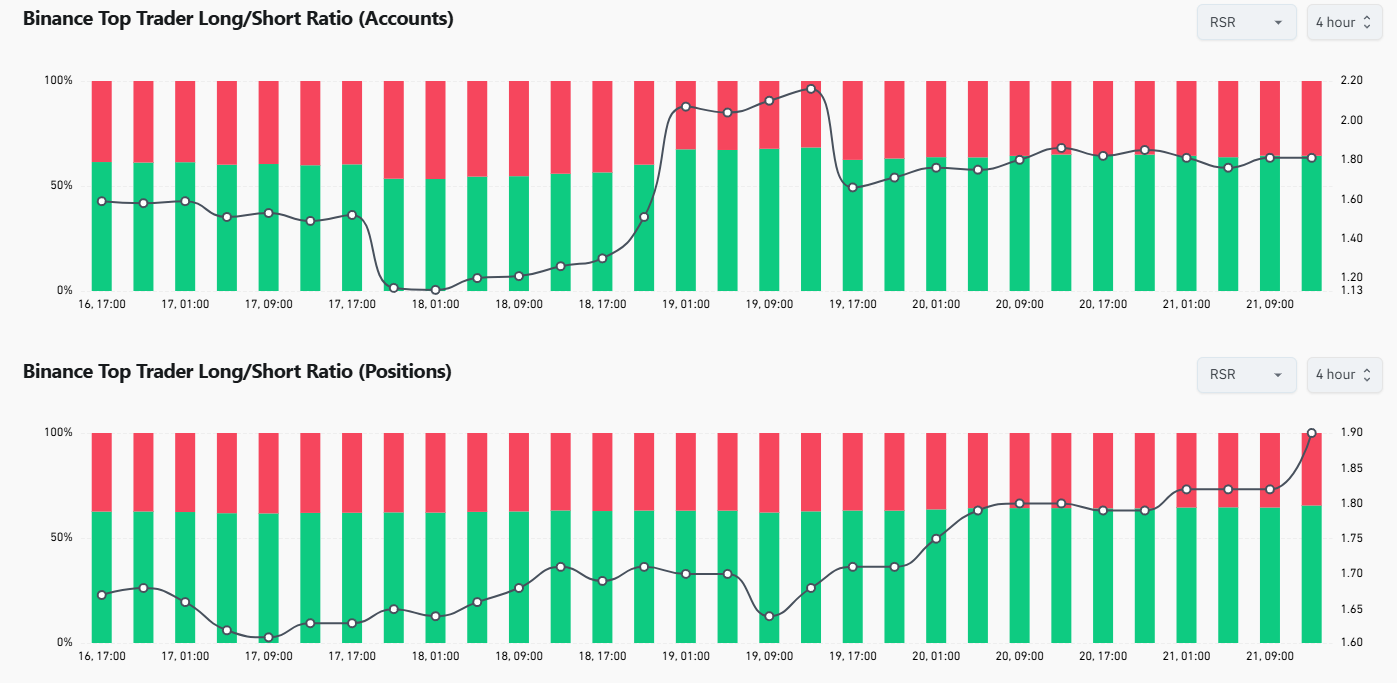
On Binance, the top‑trader long/short ratio measures the share of total open positions held as longs by the top 20% of accounts by margin balance. A 65.48% long ratio means these “smart money” participants are overwhelmingly betting prices will rise.
Meanwhile, beyond Coinbase listing, RSR is getting attention due to its link with incoming SEC Chair Paul Atkins. Although Atkins disclosed his crypto investments and has no current link with RSR, he joined the Reserve Rights Foundation as an advisor in its early stages.
Since Atkins succeeded in his confirmation hearing, RSR posted an impressive 22% rally. Technically, he hasn’t been seated as Chair yet, but traders are evidently expecting bullish developments.
Atkins has promised to bring crypto-friendly reform, and this connection could disproportionately impact his former associates.
That isn’t to say that anyone has alleged that Atkins will engage in corruption to unfairly boost RSR. However, since becoming President, members of Trump’s family have been involved in several controversial crypto deals. This precedent may be encouraging traders to believe in the importance of political connections.
For now, market narratives are very important in this industry. As Atkins officially begins his career as the SEC’s new Chair, RSR may continue to receive indirect benefits.
Disclaimer
In adherence to the Trust Project guidelines, BeInCrypto is committed to unbiased, transparent reporting. This news article aims to provide accurate, timely information. However, readers are advised to verify facts independently and consult with a professional before making any decisions based on this content. Please note that our Terms and Conditions, Privacy Policy, and Disclaimers have been updated.

Onyxcoin (XCN) is down nearly 10% over the past seven days, cooling off after a sharp 200% rally between April 9 and April 11. Momentum indicators suggest that the bullish trend may be losing strength, with both the RSI and ADX showing signs of fading conviction.
While XCN’s EMA lines remain in a bullish formation, early signs of a potential reversal are emerging as short-term averages begin to slope downward. The coming days will be key in determining whether Onyxcoin can stabilize and resume its climb—or if a deeper correction is on the horizon.
Onyxcoin Shows Early Signs of Stabilization, but Momentum Remains Uncertain
Onyxcoin’s Relative Strength Index (RSI) is currently sitting at 43. Readings above 70 typically indicate that an asset is overbought and could be due for a pullback, while readings below 30 suggest it may be oversold and poised for a potential rebound.
Levels between 30 and 70 are considered neutral, often reflecting consolidation or indecision in the market.

XCN’s RSI signals a neutral state but shows signs of gradual recovery. While not yet a clear bullish signal, yesterday’s upward move suggests that bearish momentum may be easing.
However, the fact that RSI failed to hit above 50 reflects lingering uncertainty and a lack of sustained buying pressure.
For now, XCN appears to be in a wait-and-see phase, where a continued climb in RSI could signal a shift toward renewed upside, but any further weakness might keep the price trapped in a consolidation range.
XCN Uptrend Weakens as ADX Signals Fading Momentum
Onyxcoin’s Average Directional Index (ADX) has declined to 11, down from 13.92 yesterday and 15.26 two days ago. This decline reflects a consistent weakening in trend strength.
The ADX is a key component of the Directional Movement Index (DMI) and is used to measure the strength—not the direction—of a trend on a scale from 0 to 100.
Values below 20 typically suggest that the market is trending weakly or not at all, while readings above 25 confirm a strong and established trend.

With the ADX now at 11, Onyxcoin’s trend is losing momentum, even though it technically remains in an uptrend. This low reading suggests the current bullish phase is fragile and may lack the conviction needed for sustained upward movement.
Combined with EMA lines that are beginning to flatten, the weakening ADX adds weight to the possibility that the trend could soon shift or stall.
If no surge in buying pressure emerges to reinforce the uptrend, XCN may enter a period of sideways movement or even a reversal in the short term.
Onyxcoin at a Crossroads as EMA Lines Hint at Possible Trend Reversal
XCN EMA lines remain bullish for now, with short-term averages still positioned above long-term ones.
However, the short-term EMAs have started to slope downward, raising the possibility of a looming death cross—a bearish crossover in which the short-term average falls below the long-term average.
If this crossover materializes, it would signal a shift in trend direction and could trigger a deeper pullback, after a 200% rally between April 9 and April 11, making it one of the best-performing altcoins of the previous weeks.
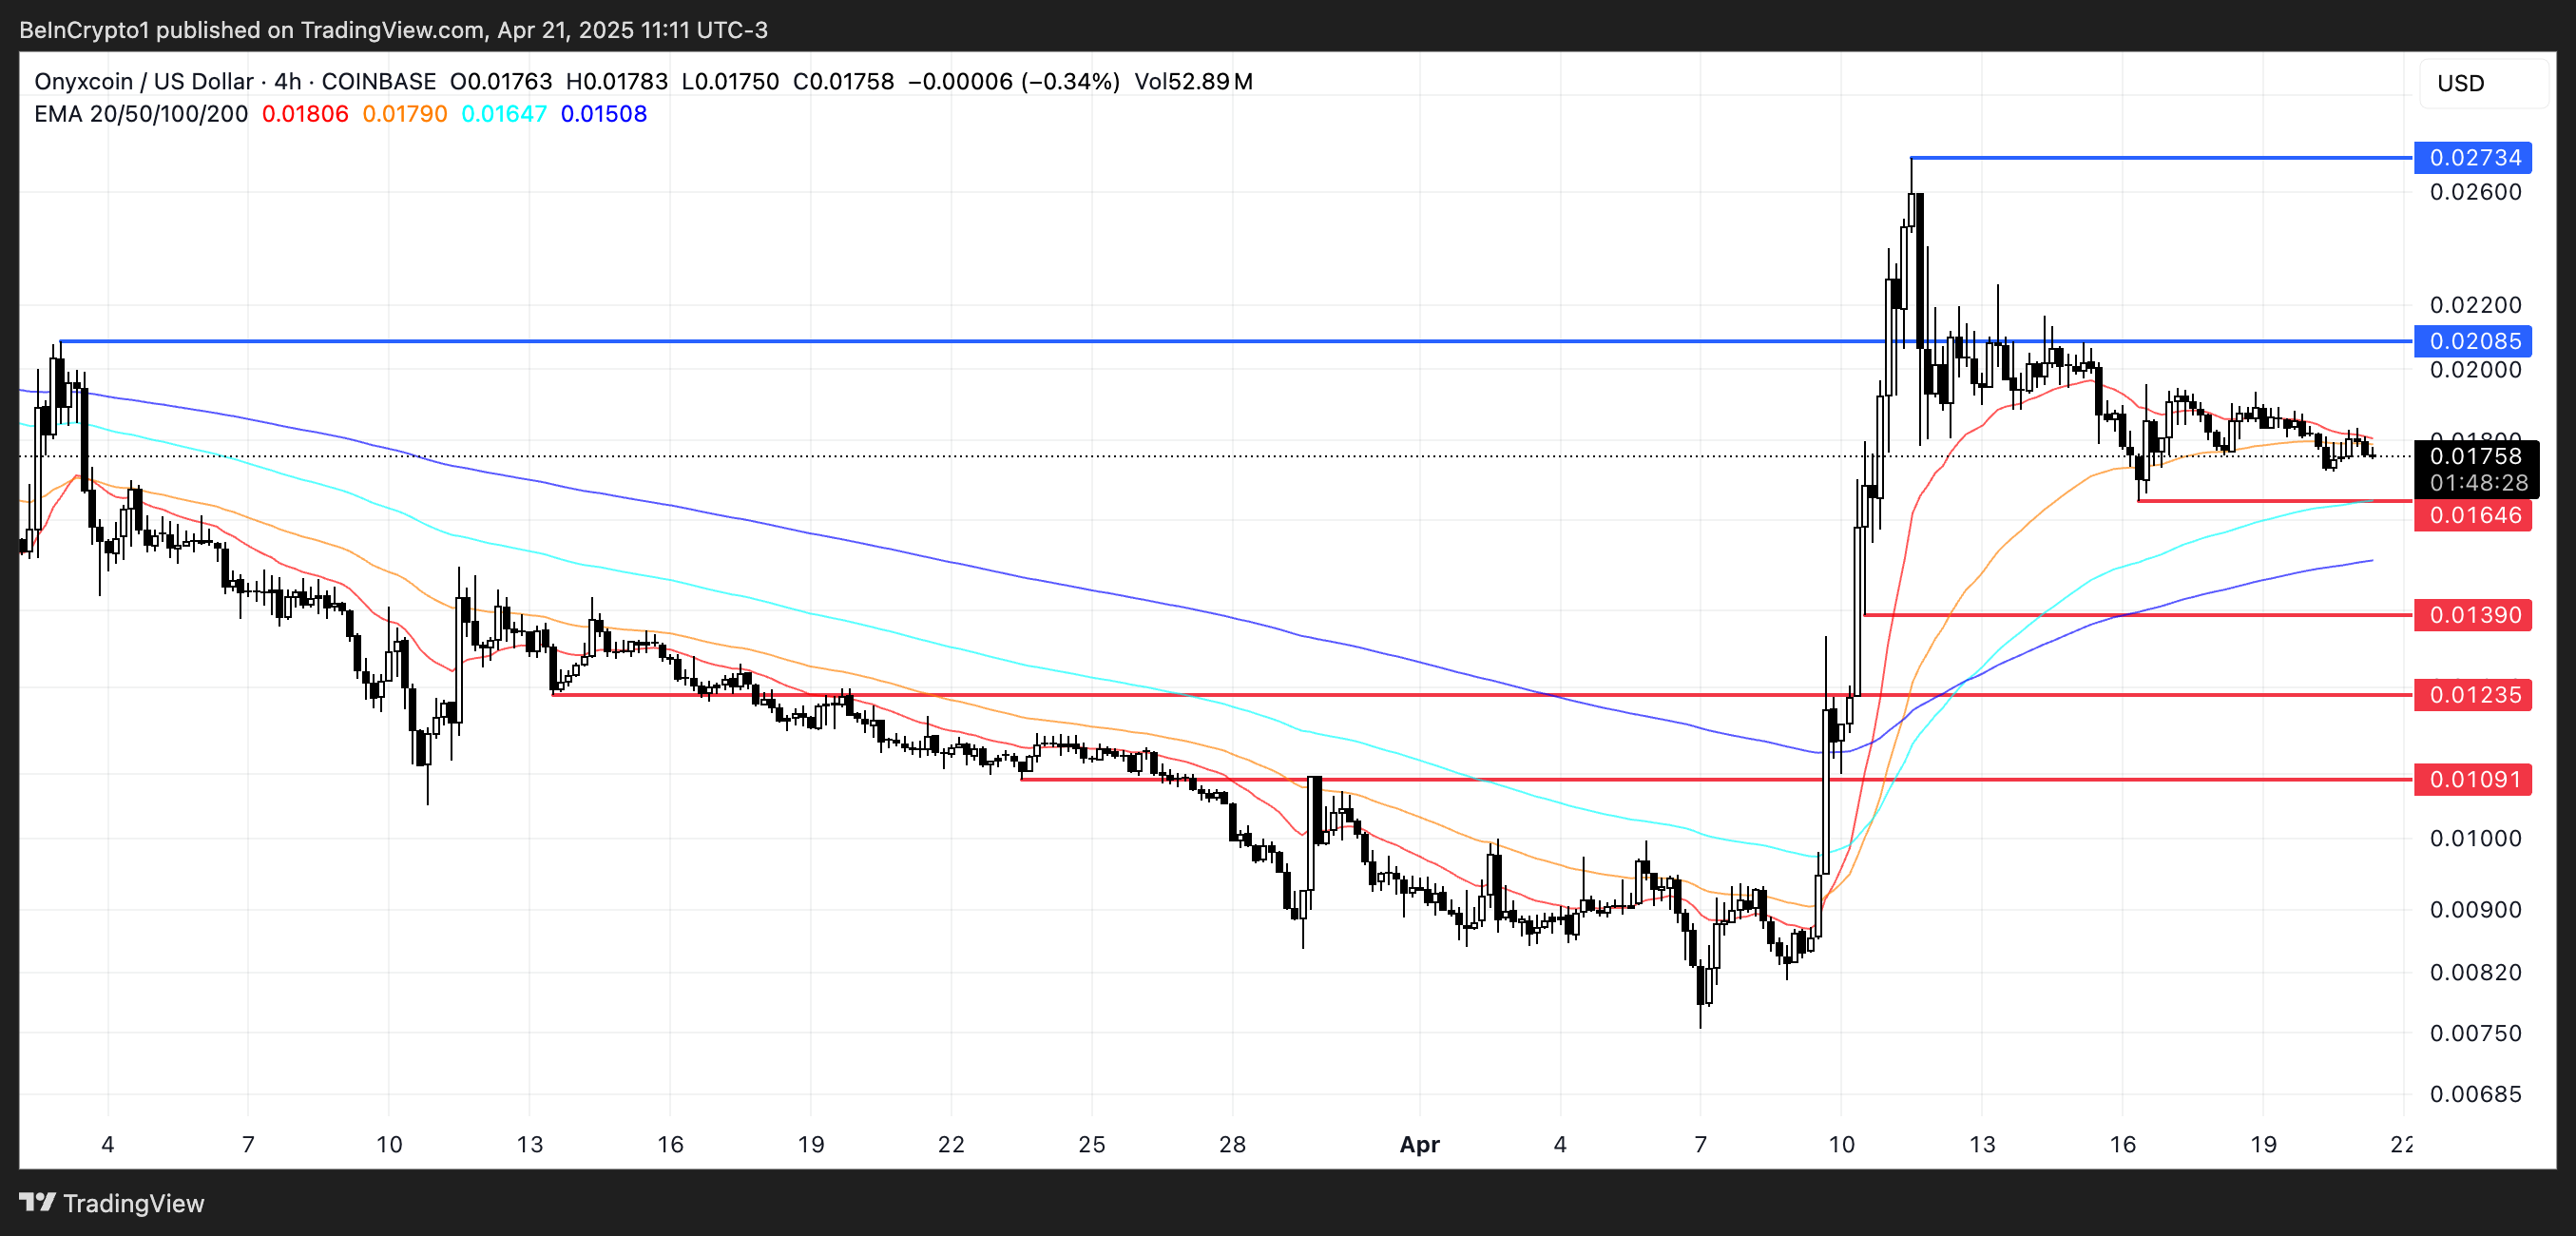
Key support levels to watch are $0.016, followed by $0.0139 and $0.0123. If bearish momentum accelerates, XCN could drop as low as $0.0109, marking a potential 38% correction from current levels.
On the flip side, if bulls manage to regain control and reinforce the existing uptrend, XCN could challenge the resistance at $0.020.
A breakout above that level would open the door for a potential rally toward $0.027, representing a 55% upside.
Disclaimer
In line with the Trust Project guidelines, this price analysis article is for informational purposes only and should not be considered financial or investment advice. BeInCrypto is committed to accurate, unbiased reporting, but market conditions are subject to change without notice. Always conduct your own research and consult with a professional before making any financial decisions. Please note that our Terms and Conditions, Privacy Policy, and Disclaimers have been updated.

Ark Invest Gains First Exposure to Solana With 3iQ ETF Bet

Bitcoin ETFs Dominate Market Despite 72 Altcoin Proposals

Analyst Reveals How High XRP Price Can Go If This Happens

Coinbase Lists RSR, Atkins Association Fuels Bullishness

OM Price Reacts as MANTRA Announces Major 300M Token Burn Update

Onyxcoin (XCN) Shows Reversal Signs After 200% Rally

2.52 Million Altcoins Are Ruining Crypto’s Future

Animoca Brands Valuation Tanks 75% In Two Years, Here’s Why

Crypto exchange BingX hacked for $43 million

Are The Big Players Losing Interest?

Hong Kong’s Securities Association Tips Authorities On Crypto Self-Regulation

Coinbase cbBTC Set to go Live on Solana
2.52 Million Altcoins Are Ruining Crypto’s Future
Animoca Brands Valuation Tanks 75% In Two Years, Here’s Why
Crypto exchange BingX hacked for $43 million
Are The Big Players Losing Interest?
Hong Kong’s Securities Association Tips Authorities On Crypto Self-Regulation
Coinbase cbBTC Set to go Live on Solana
-
 Bitcoin17 hours ago
US Economic Indicators to Watch & Potential Impact on Bitcoin
-

 Bitcoin23 hours ago
Here Are The Bitcoin Levels To Watch For The Short Term
-

 Market19 hours ago
Bitcoin Price Breakout In Progress—Momentum Builds Above Resistance
-
 Altcoin14 hours ago
Expert Reveals Why BlackRock Hasn’t Pushed for an XRP ETF
-

 Altcoin19 hours ago
Expert Says Solana Price To $2,000 Is Within Reach, Here’s How
-

 Market17 hours ago
Solana Rallies Past Bitcoin—Momentum Tilts In Favor of SOL
-

 Market16 hours ago
Vitalik Buterin Proposes to Replace EVM with RISC-V
-
 Altcoin9 hours ago
Will Cardano Price Break Out Soon? Triangle Pattern Hints at 27% ADA Surge