
Market
Are Meme Coins Dead? Market Cap Dips Below $40 Billion

Once a thriving component of the crypto ecosystem, the meme coin sector has recently seen its market capitalization plummet below $40 billion. According to CoinGecko, it now stands at $39.69 billion, marking a 3% decrease in the last 24 hours and over a 12% drop in the previous week.
This downturn signals a stark reversal from the heady days of rapid growth and investor enthusiasm.
Are Meme Coins Dead?
Industry veteran Ran Neuner has pronounced the meme coin market “dead,” attributing its decline to an oversaturated market.
“When there were few coins, the probability of you making money was actually skewed slightly more in your favor.” Neuner explains.
Shu Zhu, co-founder of the now-defunct Three Arrows Capital, agreed with Neuner. He cited the example of the flood of Neiro meme coins to highlight the saturation in the meme coin market.
“This is a great cleansing. There were way too many projects, and degeneracy. Balance is being restored. Accept it, get better, and survive,” crypto analyst Crash said.
Read more: 7 Hot Meme Coins and Altcoins that are Trending in 2024
Despite the grim market outlook, Neuner outlines two possible trading strategies for the intrepid. The first involves integrating oneself into the “cabal”—insider groups that invest early. Neuner believes that it’s a cool game if investors get in at a low market capitalization and exit before insiders dump their tokens.
“But you need to know the rules, and the rules are that the cabal is going to dump their coins on you on the way up, and you just hope that they’re going to do it responsibly so they don’t ruin their credibility, that they can keep repeating the same playbook,” Neuner said.
The second strategy Neuner proposes focuses on rejuvenating older meme coins that still have market influence and community support. This approach may offer a more stable investment avenue in a volatile market.
On the other hand, data from Lookonchain reveals a steep decline for top meme coins, with average losses of 63.73% from their peak values. Notables like Dogecoin (DOGE) and Shiba Inu (SHIB) have dropped 57.93% and 70.86%, respectively. This decline extends across the board, reflecting widespread investor retreat from these assets:
- Pepe (PEPE): -58.16%
- Dogwifhat (WIF): -70.93%
- Bonk (BONK): -64.63%
- Floki (FLOKI): -65.97%
- Brett (BRETT): -62.59%
- Popcat (POPCAT): -43.77%
- Book of Meme (BOME): -79.48%
- Cat in a Dogs World (MEW): -62.99%
Criticism has been directed at Pump.fun, a platform that enabled the launch of over 2 million meme coins. Many in the community blame it for the oversaturation that has eroded the sector’s profitability. Nevertheless, Pump.fun achieved over $100 million in revenue since its launch, a figure that contrasts sharply with the fortunes of the coins it helped create.
Read more: 11 Top Solana Meme Coins to Watch in September 2024
This downturn highlights the broader volatility and risks inherent in meme coin investments. Investors are becoming increasingly cautious, favoring projects with solid fundamentals over those driven by market whims or novelty.
Disclaimer
In adherence to the Trust Project guidelines, BeInCrypto is committed to unbiased, transparent reporting. This news article aims to provide accurate, timely information. However, readers are advised to verify facts independently and consult with a professional before making any decisions based on this content. Please note that our Terms and Conditions, Privacy Policy, and Disclaimers have been updated.


Representative Jordan Pace introduced legislation to create a Bitcoin Reserve for South Carolina, joining a nationwide effort. Currently, nearly half of all US states have an active bill to create a similar Reserve.
However, the talking point that this bill “allows 10% of state funds” in Bitcoin investments is taking off like wildfire. It may scare off fiscal conservatives, which contributed to recent failures.
South Carolina Joins the Bitcoin Reserve Race
Since President Trump announced his intention to create a US Bitcoin Reserve, many state governments have attempted to create smaller models.
In the last month, these efforts have been intensifying, with more and more states joining the effort. Today, South Carolina filed its own Bitcoin Reserve bill, allowing the state to make substantial purchases:
“The State Treasurer may invest in digital assets including, but not limited to, Bitcoin with money that is unexpended, unencumbered, or uncommitted. The amount of money that the State Treasurer may invest in digital assets from a fund specified in this section may not exceed ten precent of the total funds under management,” it reads.
State Representative Jordan Pace proposed South Carolina’s Bitcoin Reserve legislation. He claimed that this bill “gives the Treasurer new tools to protect taxpayer dollars from inflation,” one of crypto’s most well-known use cases. Pace is currently the bill’s only sponsor, and it’s unclear what chances it has of passing.
Still, there may be challenges ahead. Similar proposals in other Republican-led states—like Montana and Wyoming—have already failed. This was largely due to concerns over using public funds to buy cryptocurrency.
Even though Trump backs the idea on a national level, not all GOP lawmakers are convinced at the state level.
That said, there are some signs of progress elsewhere. For example, Texas has advanced its Bitcoin Reserve bill, achieving bipartisan support. A key reason for its success is that the bill doesn’t require the state to make crypto purchases; it simply allows them at the Treasurer’s discretion.
Likewise, South Carolina’s bill wouldn’t force the state to invest 10% of its funds into Bitcoin. It just opens the door for that possibility, giving the state financial flexibility rather than a mandate.
Disclaimer
In adherence to the Trust Project guidelines, BeInCrypto is committed to unbiased, transparent reporting. This news article aims to provide accurate, timely information. However, readers are advised to verify facts independently and consult with a professional before making any decisions based on this content. Please note that our Terms and Conditions, Privacy Policy, and Disclaimers have been updated.


The FDIC and CFTC have both been working to change previous crypto guidelines. As federal regulators reconcile with the industry, they are removing old rules that specifically target crypto.
The former institution is removing the requirement that banks report crypto business, while the latter holds crypto to the same standards as other industries.
FDIC and CFTC Change Crypto Policies
The FDIC is one of the top financial regulators in the US, and it’s turning over a new leaf. After being one of the principal architects of Operation Choke Point 2.0, it recently began declassifying documents and changing rules that allowed crypto debanking.
Today, the agency is revoking a 2022 directive that impacted banks’ interactions with crypto:
“With today’s action, the FDIC is turning the page on the flawed approach of the past three years. I expect this to be one of several steps the FDIC will take to lay out a new approach for how banks can engage in crypto- and blockchain-related activities in accordance with safety and soundness standards,” said FDIC Acting Chairman Travis Hill.
Specifically, it rescinded a rule that mandated that all banks and institutions under its supervision notify the FDIC of any crypto involvement. The new guideline claims that banks “may engage in permissible crypto-related activities without receiving prior FDIC approval” without enacting any other policies.
Since Gary Gensler left the SEC, all the top US financial regulators have been trying to rework their relationship with crypto. In an apparent coincidence, the CFTC made a very similar move to the FDIC by rescinding two crypto guidelines.
Both of these actions did not establish a new policy; they merely removed the old ones.
Essentially, both of the CFTC’s rule changes are set to ensure that crypto-related derivatives are subject to the same requirements as non-crypto ones. This is somewhat surprising, considering that the industry has typically tried to insist that it necessitates specific regulations.
However, this is largely beside the point. The FDIC and CFTC are both working to remove previous guidelines that opposed the crypto industry.
These institutions will undoubtedly be amenable to creating new ones in the spirit of cooperation. In the meantime, this olive branch can help build a lot of goodwill.
Disclaimer
In adherence to the Trust Project guidelines, BeInCrypto is committed to unbiased, transparent reporting. This news article aims to provide accurate, timely information. However, readers are advised to verify facts independently and consult with a professional before making any decisions based on this content. Please note that our Terms and Conditions, Privacy Policy, and Disclaimers have been updated.

Pi Network (PI) has been under heavy selling pressure, with its price down more than 61% over the last 30 days. Despite a recent partnership with the Telegram Crypto Wallet, PI has struggled to regain momentum, as technical indicators remain mostly bearish.
Its BBTrend has been negative for 12 consecutive days, and although the RSI has recovered slightly from oversold levels, it still sits below the neutral 50 mark. With the downtrend firmly intact and critical support levels approaching, PI’s next move will likely depend on whether buyers can step in and reverse the current trajectory.
PI BBTrend Has Been Negative For 12 Days
Pi Network (PI) continues to face bearish pressure, as reflected in its BBTrend indicator, which remains deep in negative territory at -22.34.
This is despite recent headlines about the Telegram Crypto Wallet integrating Pi Network, news that has yet to translate into sustained upward momentum.
The BBTrend hit a recent low of -41 on March 21 and has stayed negative since March 16, marking twelve consecutive days of bearish trend signals. This prolonged weakness highlights the ongoing struggle for buyers to regain control of the market.
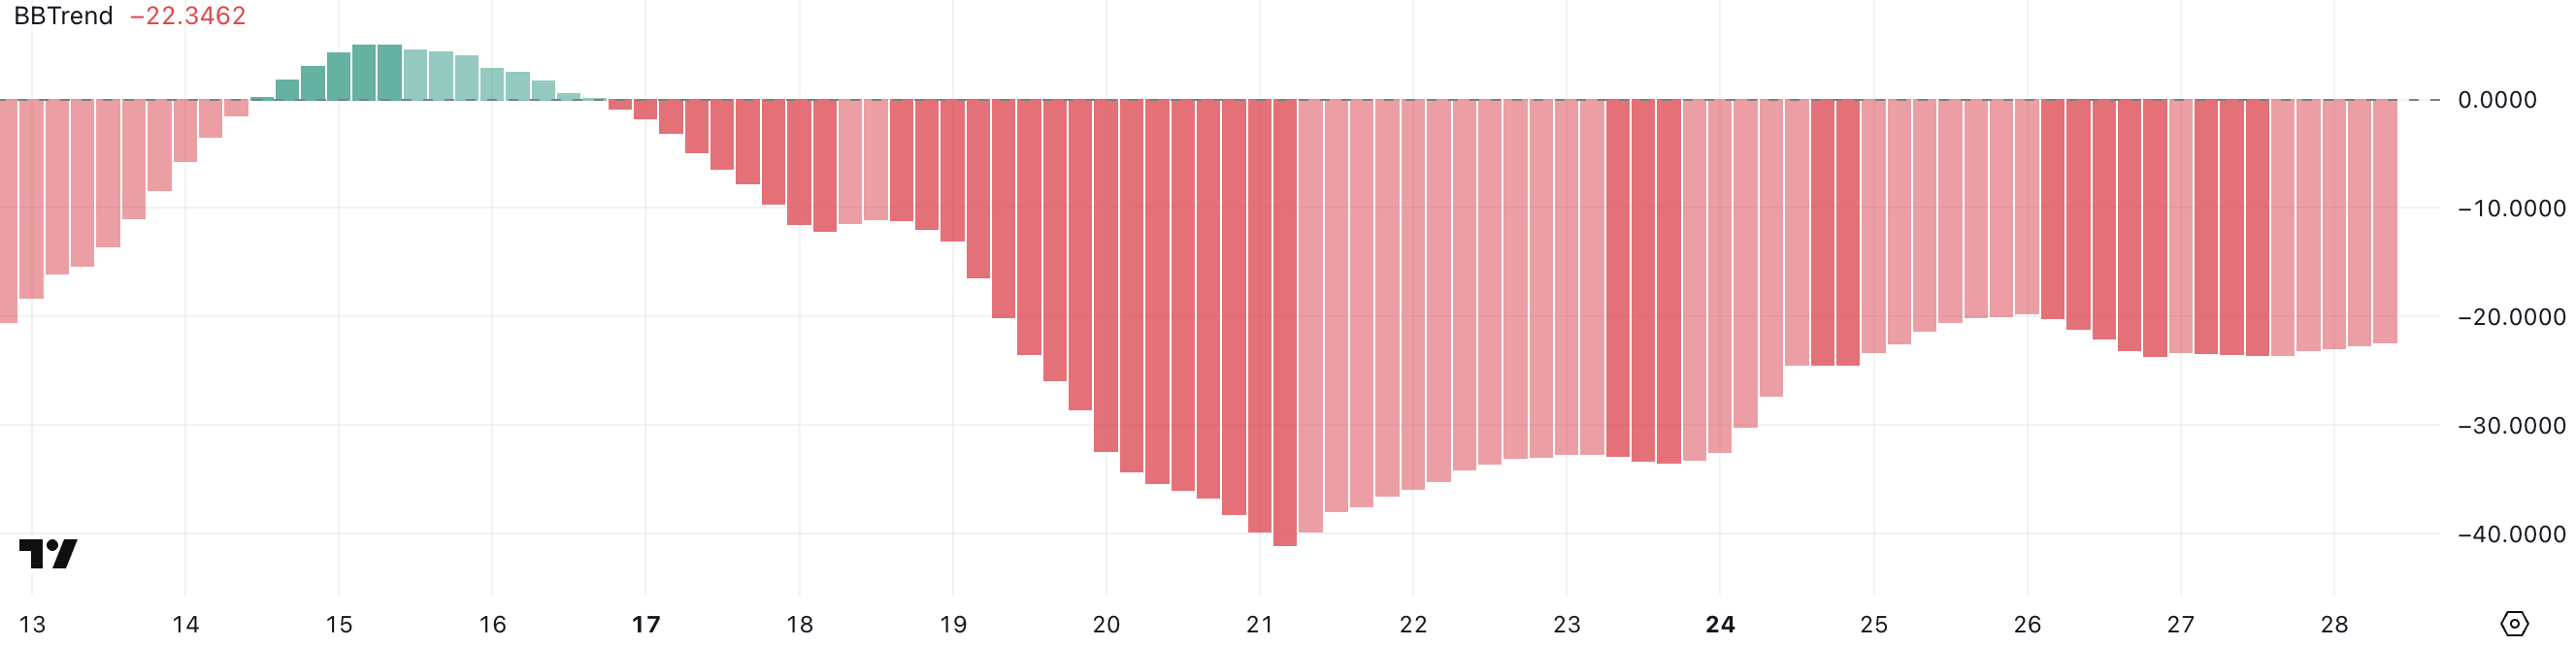
BBTrend, or Bollinger Band Trend, is a momentum-based indicator that helps gauge the strength and direction of a trend. Positive BBTrend values indicate bullish momentum, while negative values point to bearish sentiment—the further from zero, the stronger the trend.
With PI’s BBTrend sitting at -22.34, the market remains firmly under bearish influence, even if the worst of the recent downtrend may be easing slightly from its extreme lows.
Unless this trend flips back into positive territory soon, PI’s price could remain under pressure, with buyers staying cautious despite the recent integration news.
Pi Network RSI Has Recovered From Oversold But Still Lacks Bullish Momentum
Pi Network is showing early signs of recovery in momentum, with its Relative Strength Index (RSI) rising to 40.45 after hitting 23.8 just two days ago.
While this rebound suggests a reduction in overselling pressure, PI’s RSI hasn’t crossed above the neutral 50 mark in the past two weeks—highlighting ongoing weakness in bullish conviction.
Despite the slight uptick, the market has yet to see enough strength to shift sentiment meaningfully in favor of buyers. This cautious climb could either lead to a breakout or stall into continued consolidation.
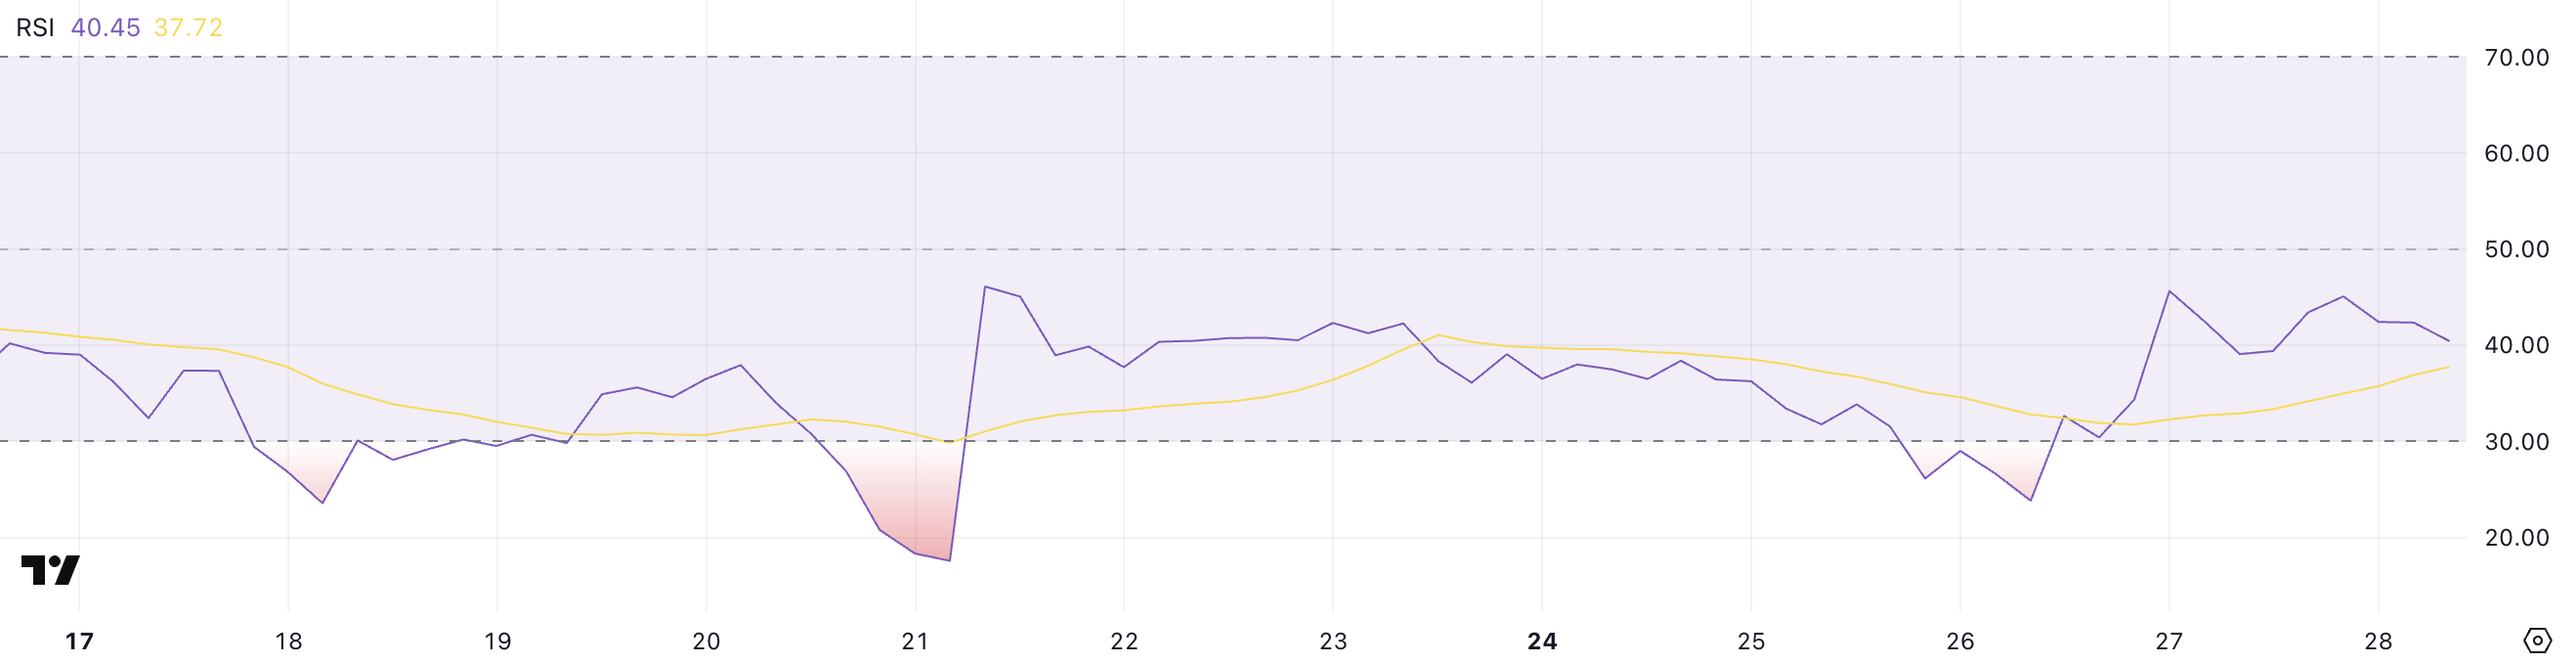
The RSI, or Relative Strength Index, is a momentum oscillator that measures the speed and change of price movements. It ranges from 0 to 100, with values above 70 indicating overbought conditions and those below 30 suggesting the asset is oversold.
With PI’s RSI currently at 40.45, it’s in a neutral-to-bearish zone—no longer extremely oversold but still lacking strong buying pressure.
For a clearer trend reversal, the RSI would likely need to break above 50, which hasn’t happened in two weeks. Thus, the current move is more of a potential bottoming attempt rather than a confirmed shift.
Will PI Continue Its Correction?
PI price is currently trading within a well-established downtrend, as indicated by the alignment of its EMA (Exponential Moving Average) lines—where shorter-term EMAs remain firmly below longer-term ones.
This setup reflects persistent selling pressure, and if the correction continues, PI could revisit key support levels at $0.718, with a potential drop to $0.62 if that floor fails to hold.
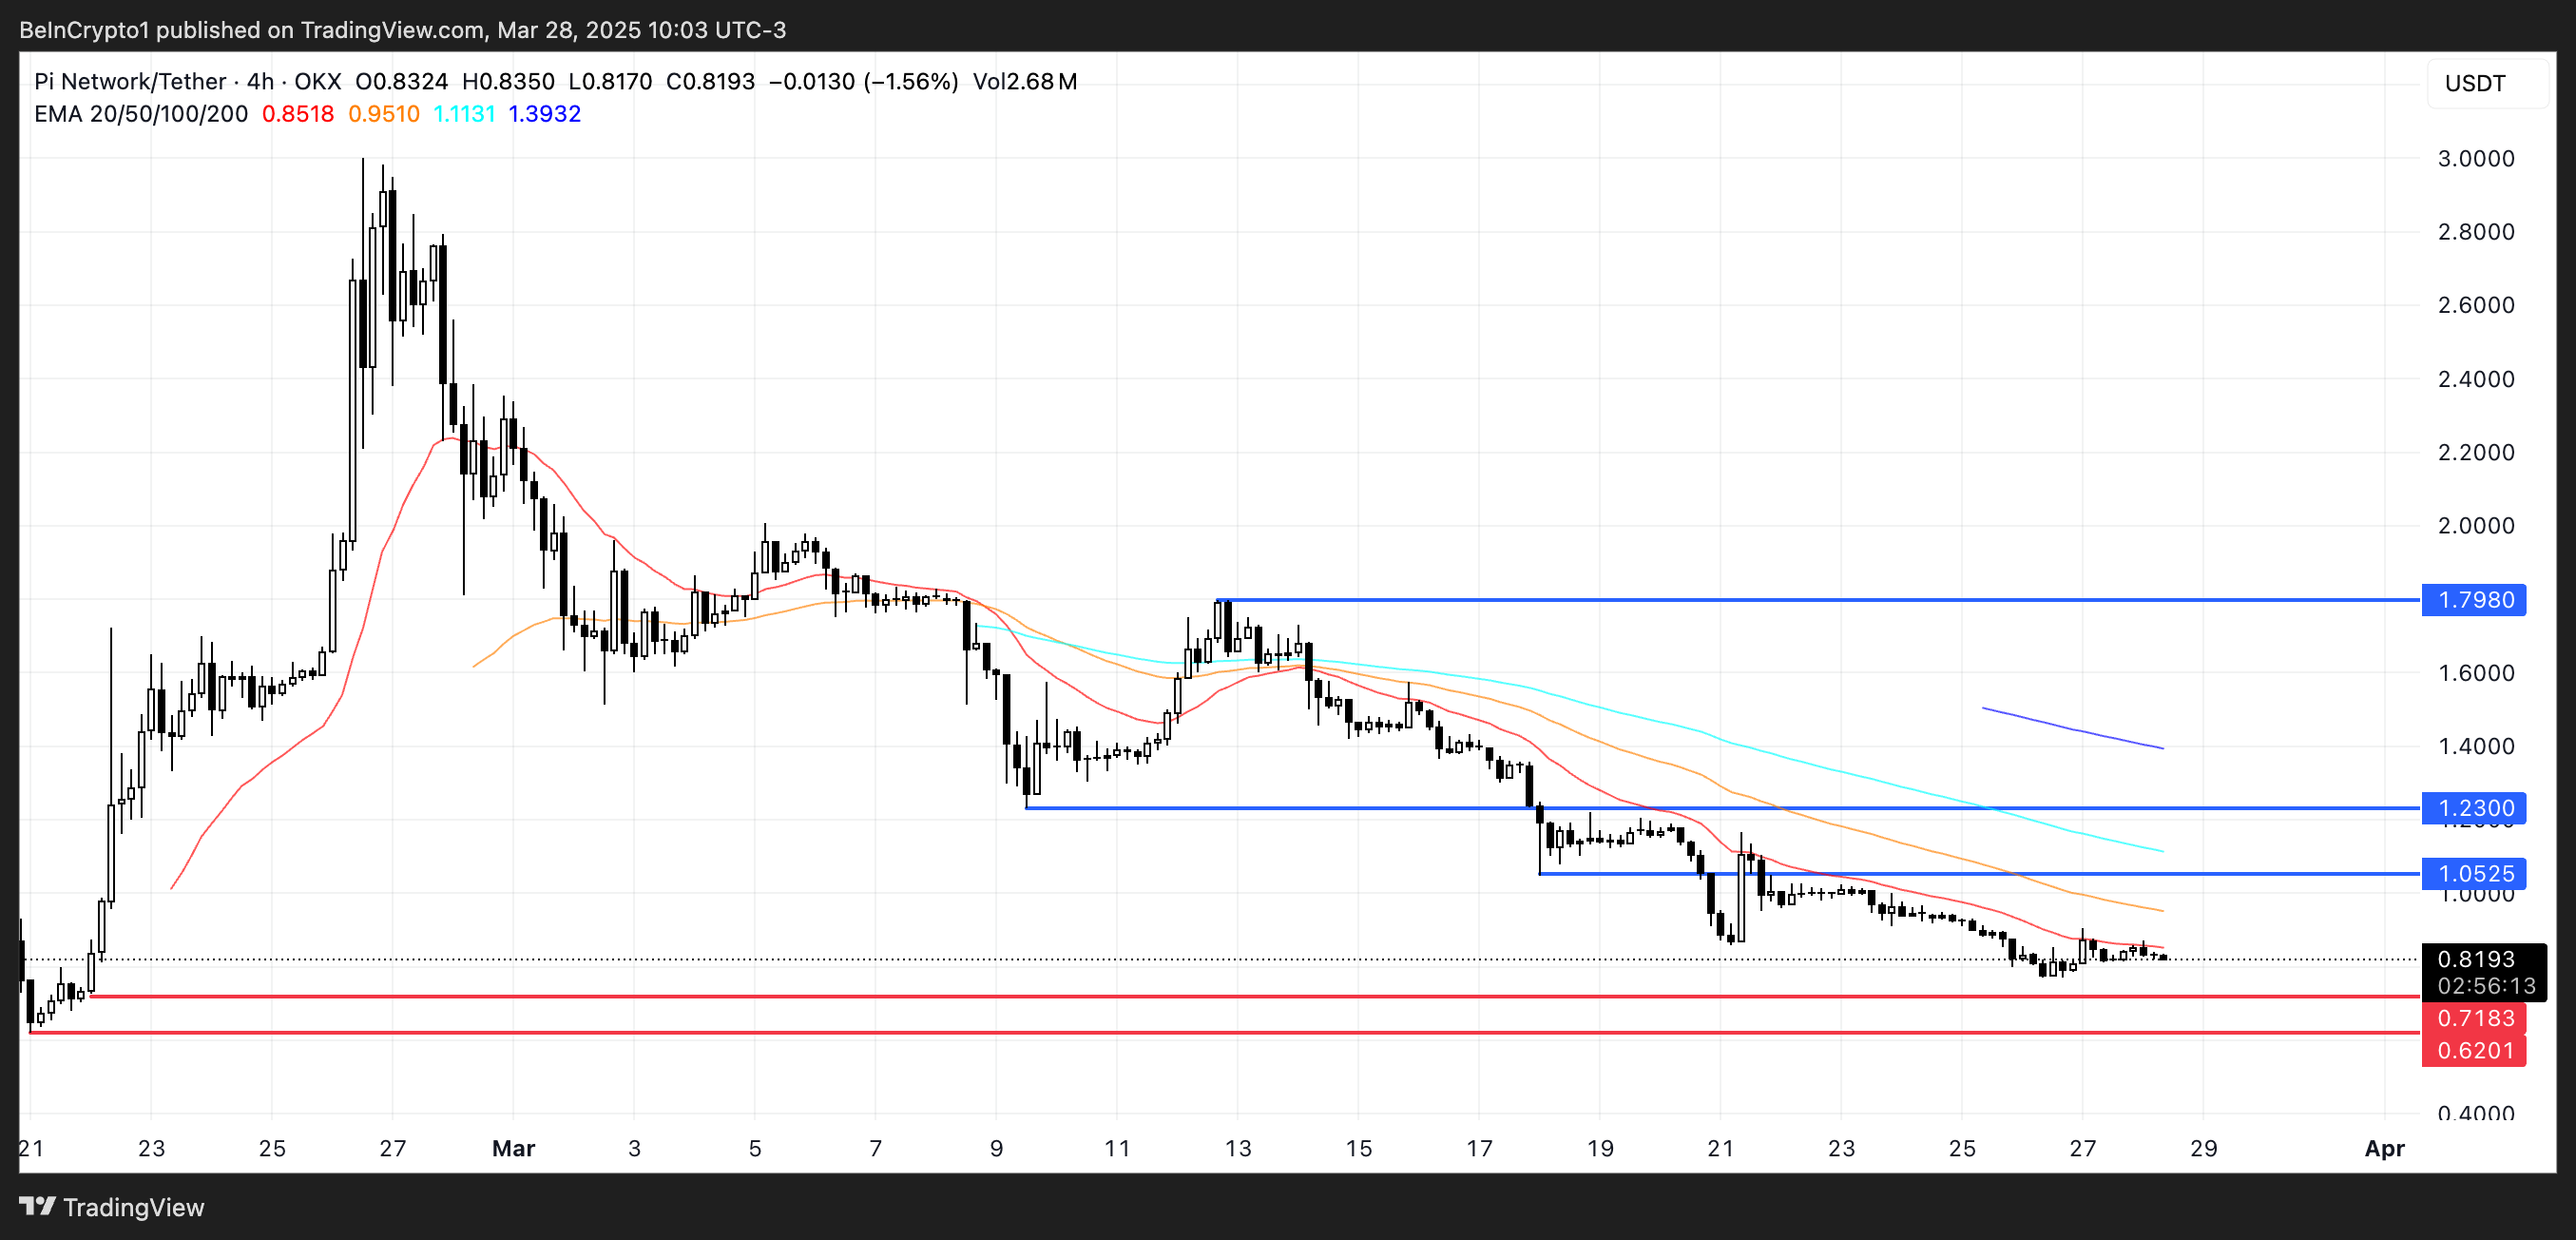
However, recent signs of life in the RSI hint that a short-term rebound might be brewing, offering some hope for a recovery.
If bullish momentum builds, PI could challenge resistance at $1.05 in the near term. A breakout above that level would shift sentiment and open the door for further gains, with $1.23 and even $1.79 as potential targets if the uptrend strengthens.
Disclaimer
In line with the Trust Project guidelines, this price analysis article is for informational purposes only and should not be considered financial or investment advice. BeInCrypto is committed to accurate, unbiased reporting, but market conditions are subject to change without notice. Always conduct your own research and consult with a professional before making any financial decisions. Please note that our Terms and Conditions, Privacy Policy, and Disclaimers have been updated.
Did XRP Price Just Hit $21K? Live TV Display Error Goes Viral

El Salvador’s Nayib Bukele Open to White House Visit

South Carolina Could Spend 10% of Funds on Bitcoin Reserve

FDIC and CFTC Rescind Old Crypto Guidelines

Pi Network (PI) Drops Further Despite Telegram Wallet Deal

Chainlink Price Leads Altcoin Selloff, Where Is LINK Price Floor?

2.52 Million Altcoins Are Ruining Crypto’s Future

Animoca Brands Valuation Tanks 75% In Two Years, Here’s Why

Crypto exchange BingX hacked for $43 million

Are The Big Players Losing Interest?

Hong Kong’s Securities Association Tips Authorities On Crypto Self-Regulation

Coinbase cbBTC Set to go Live on Solana
2.52 Million Altcoins Are Ruining Crypto’s Future
Animoca Brands Valuation Tanks 75% In Two Years, Here’s Why
Crypto exchange BingX hacked for $43 million
Are The Big Players Losing Interest?
Hong Kong’s Securities Association Tips Authorities On Crypto Self-Regulation
Coinbase cbBTC Set to go Live on Solana
-

 Altcoin22 hours ago
Dogecoin Price Set To Reach $1 As Once In A Year Buy Opportunity Returns
-
 Regulation18 hours ago
Sonic Labs To Abandon Plans For Algorithmic USD Stablecoin, Here’s Why
-

 Market22 hours ago
Analysts Reveal Q2 Crypto Market Outlook: BTC at $200,000?
-

 Market17 hours ago
Coinbase Users Lost $46 Million to Crypto Scams in March
-

 Altcoin17 hours ago
PiDaoSwap, Trump Media, & Grayscale
-
 Regulation22 hours ago
AVAX Price Eyes Rally To $44 As Grayscale Files For Avalanche ETF
-
 Regulation17 hours ago
US SEC Drops Charges Against Hawk Tuah Girl Hailey Welch
-

 Market24 hours ago
SatLayer CEO Luke Xie Talks Bitcoin Restaking and DeFi’s Future