
Market
Are Bonk (BONK) Bulls Strong Enough to Initiate a Rally?

After an extended decline, Solana-based meme coin Bonk (BONK) might be set for a rebound as bullish sentiment begins to return.
However, despite the increasing optimism, the current demand for BONK may not be sufficient to trigger a near-term rally.
Bonk Bulls Attempt to Retake Market
BONK’s Moving Average Convergence/Divergence (MACD) highlights the growing bullish bias toward the altcoin. At press time, the token’s MACD line (blue) is seen attempting a bullish crossover of the signal line (orange).
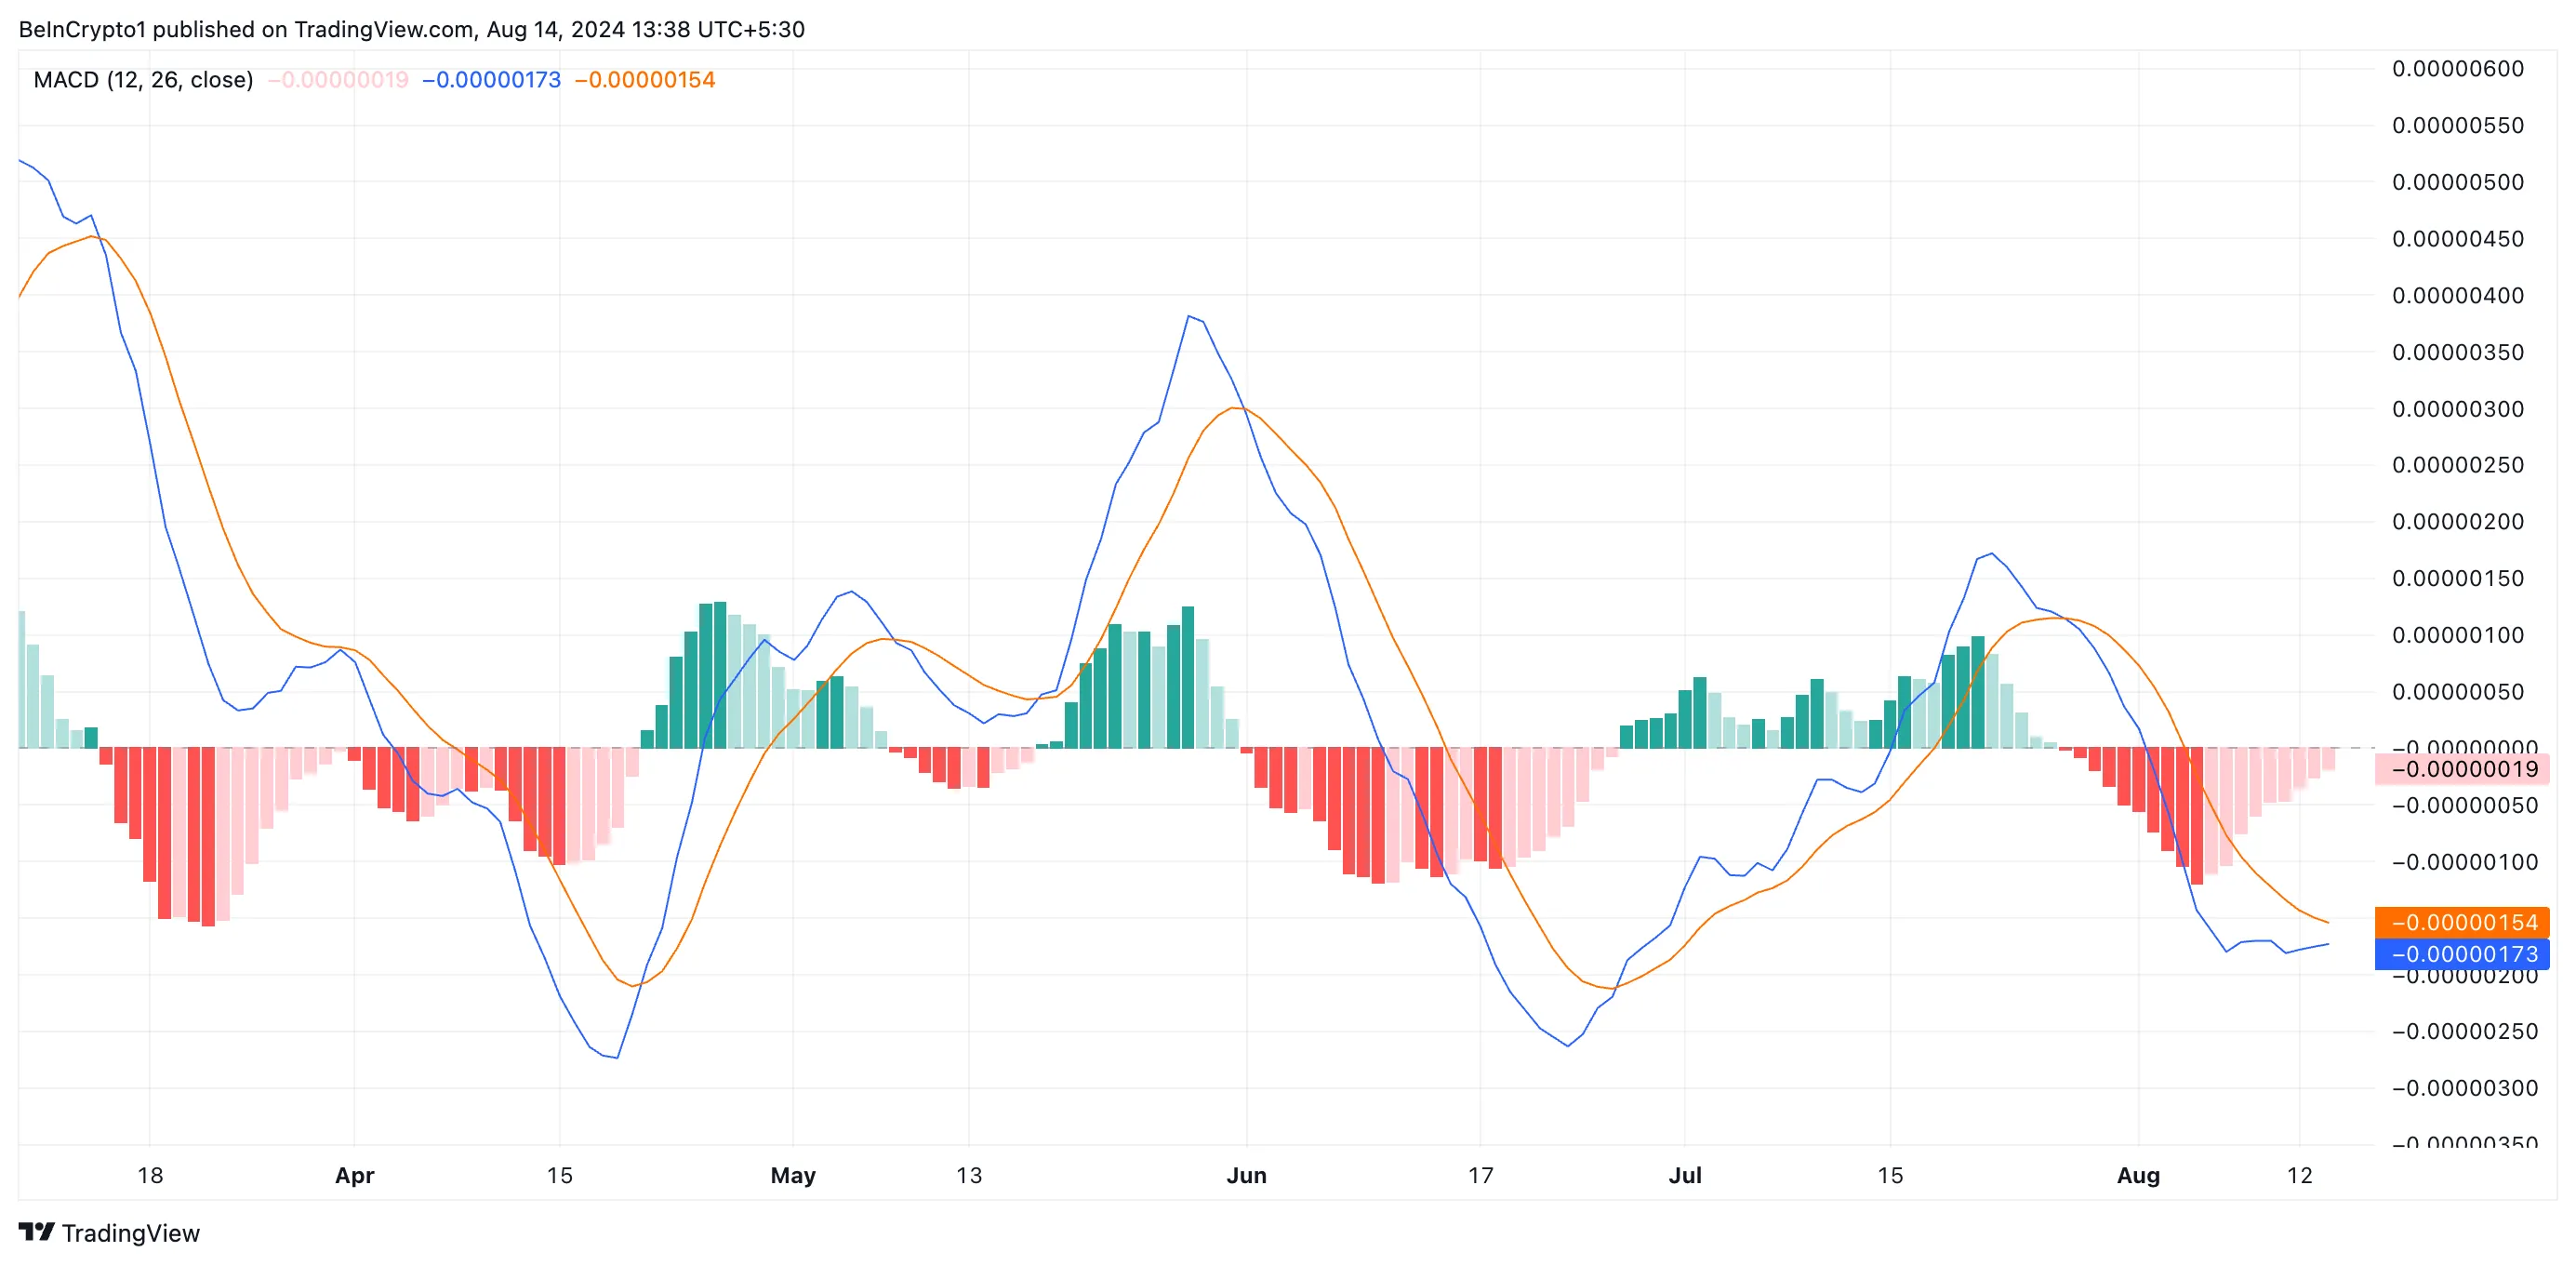
When an asset’s MACD line attempts to cross above its signal line, it indicates a potential shift in momentum from bearish to bullish. This crossover suggests that the asset’s shorter-term moving average is rising faster than its longer-term moving average. Traders interpret this crossover as a buy signal, hinting at a potential rally.
Further, the dots that makeup BONK’s Parabolic Stop and Reverse (SAR) indicator are below their price and have been so positioned since August 8.
Read more: 11 Top Solana Meme Coins to Watch in August 2024
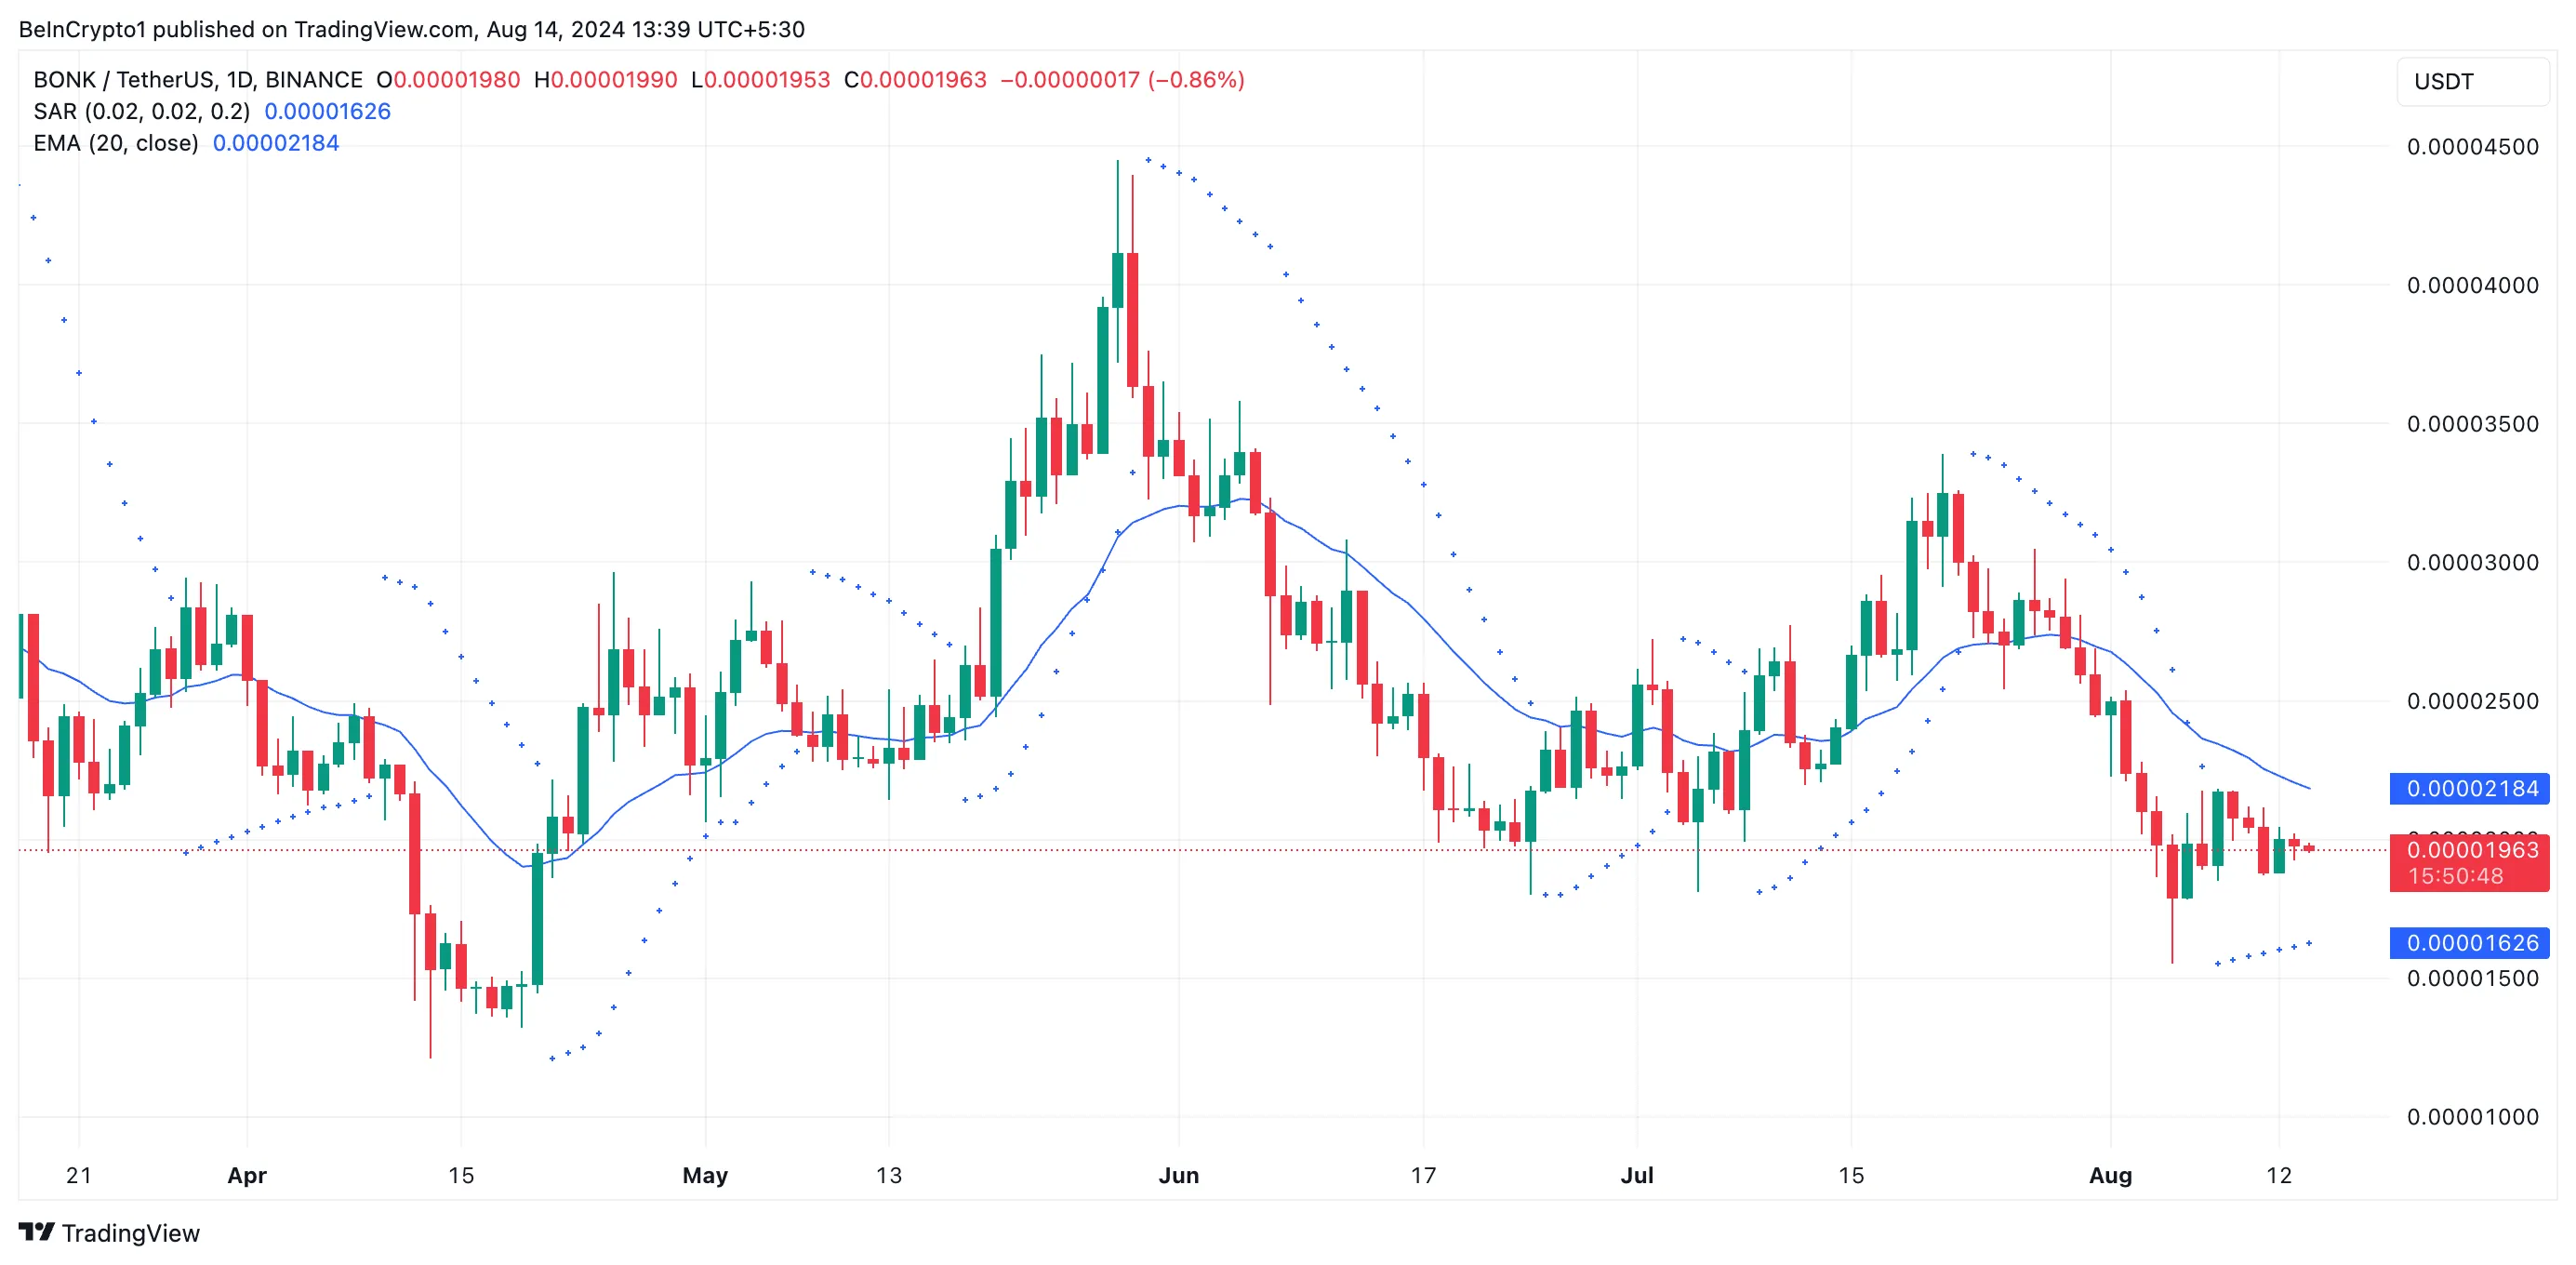
This indicator tracks an asset’s price trends and identifies potential reversal points. When its dots are positioned under the price, the market is in an uptrend, and the Parabolic SAR acts as a support level. Traders also view this as a signal to stay long or enter a buy position, anticipating the price to continue rising.
BONK Price Prediction: Not Enough Bulls
While BONK’s MACD and Parabolic SAR indicators hint at bullish sentiment toward the meme coin, its momentum indicators suggest that the current demand for the altcoin may not be enough to trigger a rally.
For example, its Relative Strength Index (RSI) remains below its neutral line at 40.80. This indicator measures an asset’s overbought and oversold market conditions. At its current value, BONK’s RSI indicates that buying pressure is low compared to selling activity.
Likewise, BONK’s Chaikin Money Flow- which measures how money flows into and out of the asset- is negative. This signals consistent liquidity exit from the BONK market, making any potential price rally challenging.
Read more: Best Crypto Exchanges With the Lowest Trading Fees
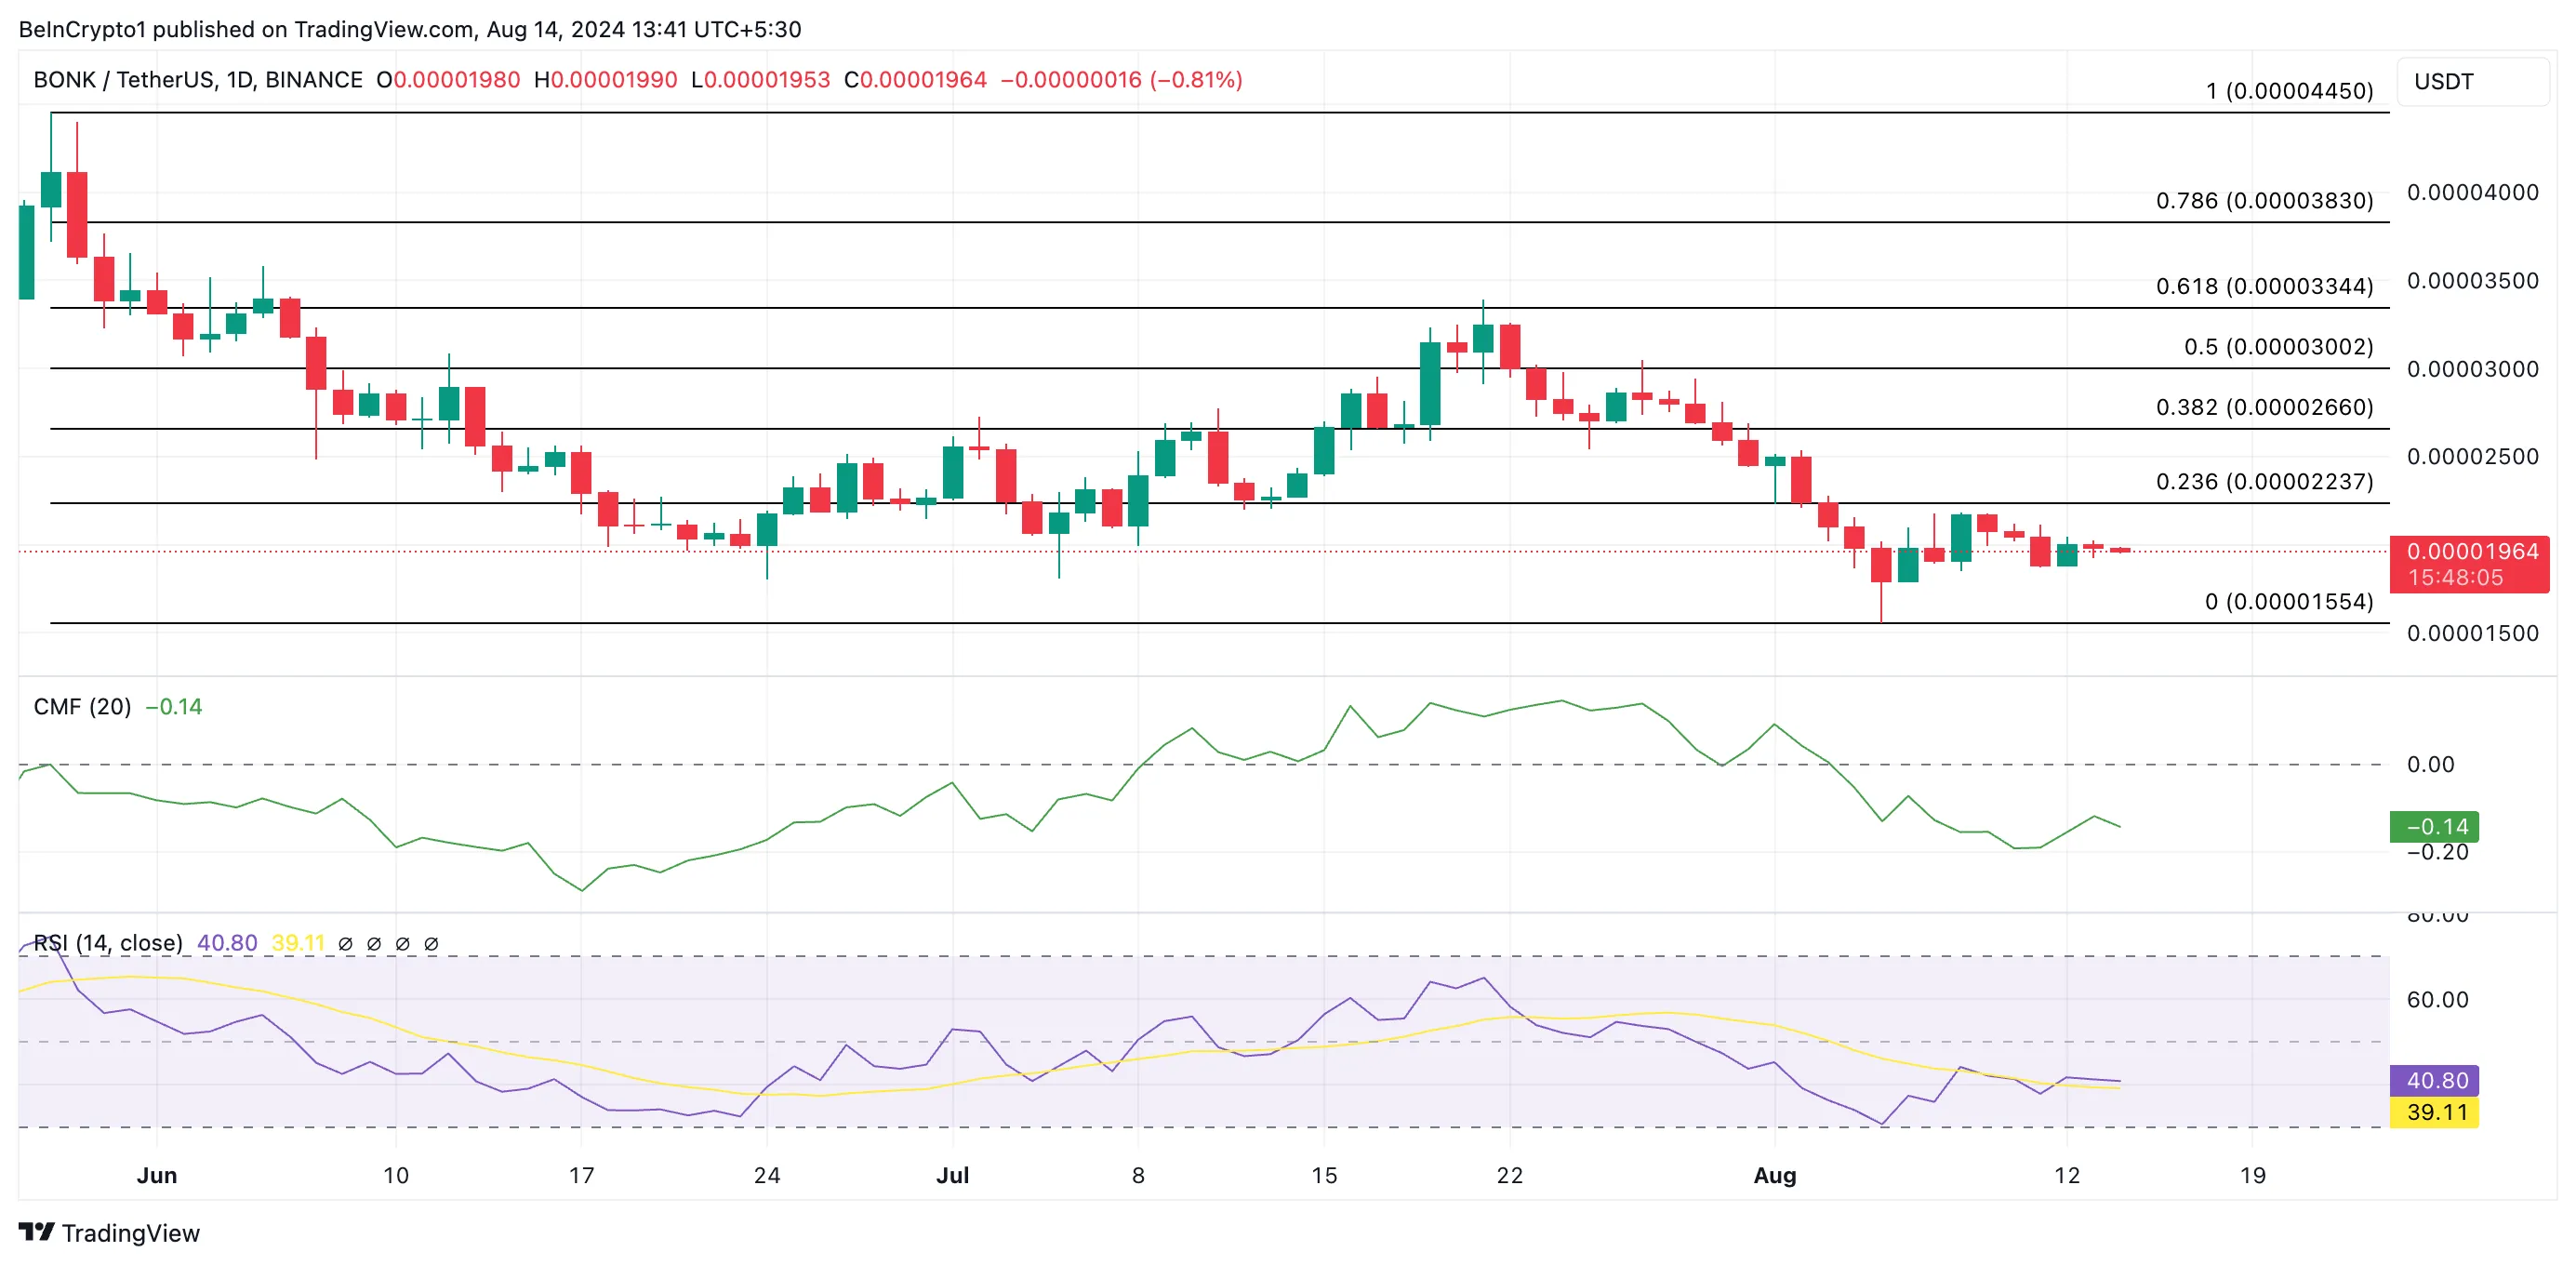
BONK’s price may fall to $0.000015 if buying pressure remains low. However, BONK’s value may rise to $0.000022 if it gains momentum.
Disclaimer
In line with the Trust Project guidelines, this price analysis article is for informational purposes only and should not be considered financial or investment advice. BeInCrypto is committed to accurate, unbiased reporting, but market conditions are subject to change without notice. Always conduct your own research and consult with a professional before making any financial decisions. Please note that our Terms and Conditions, Privacy Policy, and Disclaimers have been updated.


MANTRA CEO, JP Mullin, is burning 150 million OM tokens from his own allocation and engaging other ecosystem partners to burn an additional 150 million tokens. This 300 million OM token burn aims to restore investor trust in the project and stabilize the altcoin’s price dynamics.
OM is attempting to recover from one of the most dramatic crashes in recent crypto history. On April 13, it lost over 90% of its value in a single hour. The collapse, which erased more than $5.5 billion in market cap, triggered widespread accusations of insider activity and manipulation within the Real-World Assets (RWA) sector.
Understanding MANTRA’s Token Burn
Mantra, once one of the biggest players in the Real-World Assets (RWA) sector, suffered a dramatic collapse on April 13, with its token crashing over 90% in less than an hour and wiping out more than $5.5 billion in market capitalization.
The plunge followed a rapid surge earlier this year, when OM rose from $0.013 to over $6, pushing its fully diluted valuation to $11 billion. The crash was reportedly triggered by a $40 million token deposit into OKX by a wallet allegedly linked to the team, sparking fears of insider selling.
Panic spread quickly as rumors of undisclosed OTC deals, delayed airdrops, and excessive token supply concentration fueled mass liquidations across exchanges.
Despite co-founder John Patrick Mullin denying any wrongdoing and blaming centralized exchanges for forced closures, investors and analysts raised concerns about potential manipulation by market makers and CEXs, drawing comparisons to past collapses like Terra LUNA.

In an effort to rebuild trust, Mullin has announced the permanent burn of his 150 million OM team allocation. The tokens, originally staked at mainnet launch in October 2024, are now being unbonded and will be fully burned by April 29, reducing OM’s total supply from 1.82 billion to 1.67 billion.
This move also lowers the network’s staked amount by 150 million tokens, which could impact on-chain staking APR.
Additionally, MANTRA is in talks with partners to implement a second 150 million OM burn, potentially cutting the total supply by 300 million tokens.
OM Price Faces Critical Test as Token Burn Battles Lingering Market Doubt
Despite MANTRA’s ongoing token burn efforts, it’s still uncertain whether the move will be enough to fully restore investor confidence in OM.
From a technical standpoint, if momentum begins to recover, OM could test the immediate resistance at $0.59. A successful breakout at that level may pave the way for further gains toward $0.71, with additional key hurdles at $0.89 and $0.997 standing between the token and a return to the psychologically important $1 mark.
However, reclaiming these levels will likely require sustained buying interest and broader sentiment recovery across the Real-World Assets (RWA) sector.

On the downside, if the token burn fails to shift sentiment or if selling pressure continues, OM risks resuming its decline.
The first key support lies at $0.51, and a breakdown below that level could send the price further down to $0.469.
Given the scale of the recent crash and the lingering distrust among investors, the path to recovery remains fragile—OM now sits at a critical crossroads between a potential rebound and further erosion of its market value.
Disclaimer
In line with the Trust Project guidelines, this price analysis article is for informational purposes only and should not be considered financial or investment advice. BeInCrypto is committed to accurate, unbiased reporting, but market conditions are subject to change without notice. Always conduct your own research and consult with a professional before making any financial decisions. Please note that our Terms and Conditions, Privacy Policy, and Disclaimers have been updated.

Welcome to the US Morning Crypto News Briefing—your essential rundown of the most important developments in crypto for the day ahead.
Grab a coffee to see what experts say about Bitcoin’s (BTC) price amid recovery efforts. The status of Bitcoin as a hedge against inflation and economic uncertainty is progressively becoming questionable, with institutional influence adding to the concerns.
Can Strategy’s $555 Million BTC Purchase Send Bitcoin Past $90,000?
Michael Saylor, the chairman of Strategy (formerly MicroStrategy), revealed the firm’s latest Bitcoin purchase, comprising 6,556 BTC tokens worth approximately $555.8 million. With this, the firm has attained a Bitcoin yield of 12.1% year-to-date (YTD) in 2025.
“MSTR has acquired 6,556 BTC for ~$555.8 million at ~$84,785 per bitcoin and has achieved BTC Yield of 12.1% YTD 2025. As of 4/20/2025, Strategy holds 538,200 BTC acquired for ~$36.47 billion at ~$67,766 per bitcoin,” Saylor shared.
Strategy uses the Bitcoin Yield YTD to measure the BTC holdings per share increase. This model has been a key part of their financial strategy firm since their first Bitcoin purchase in August 2020.
This acquisition aligns with a bullish market sentiment for Bitcoin, which is steadily nearing the $90,000 milestone, as the recent US Crypto News indicated.

Despite a mild recovery in Bitcoin prices this week, up by over 3% in the last 24 hours, it is worth noting that Bitcoin is highly sensitive to economic indicators.
Similarly, the global market is highly sensitive to monetary policies set by major economies, particularly the US. BeInCrypto contacted Paybis founder and CEO Innokenty Isers for insights on the current market outlook, particularly for Bitcoin.
“Given the strong concentration of investors in technology stocks, shifts in trade policies and government interventions that influence key indices like the Nasdaq Composite create ripple effects across financial markets,” Isers told BeInCrypto.
According to the Pybis executive, since the US Presidential inauguration, the outlook of Bitcoin has changed from a trusted hedge against inflation to a more risk-on asset.
“With its relatively higher volatility, risk-averse investors may favor alternative inflation hedges instead of Bitcoin,” he added.
Iners expressed cognizance of the longer stretch of the trade war and the potential inflation that will emerge. Based on this, he noted that capital allocation to Bitcoin as a hedge against economic instability might be reduced.
Strategy’s Stock Premium Narrows as Bitcoin Hype Cools
Meanwhile, Strategy has seen a significant shift in its stock valuation dynamics over the past year. Saylor recently revealed that as of Q1 2025, over 13,000 institutions and 814,000 retail accounts held MSTR directly.
“An estimated 55 million beneficiaries have indirect exposure through ETFs, mutual funds, pensions, and insurance portfolios,” Saylor added.
According to data on Bitcointreasuries.net, the premium investors once paid for exposure to its Bitcoin holdings has notably narrowed.
Specifically, the NAV multiplier, a measure of how much the stock trades above the value of Strategy’s Bitcoin assets, has decreased compared to last year. This indicates that MSTR is now trading closer to the actual value of its Bitcoin reserves.
In 2024, investors were willing to pay a substantial premium for MSTR shares, driven by Bitcoin’s hype and MicroStrategy’s aggressive accumulation strategy.
“I don’t know if buying strategy equity is a good idea for the government. The stock would just pump, and it’s likely trading at a premium over NAV with a higher risk profile. Also, I believe the gov will find it difficult to find institutions that would be willing to sell their BTC in large quantities,” an analyst said recently.
The shrinking NAV multiplier suggests a more cautious market sentiment. Analysts believe this reflects a shift toward valuing MicroStrategy based on its fundamentals rather than speculative Bitcoin enthusiasm.
This suggests a maturing market approach to the company’s unique investment strategy.
Chart of the Day
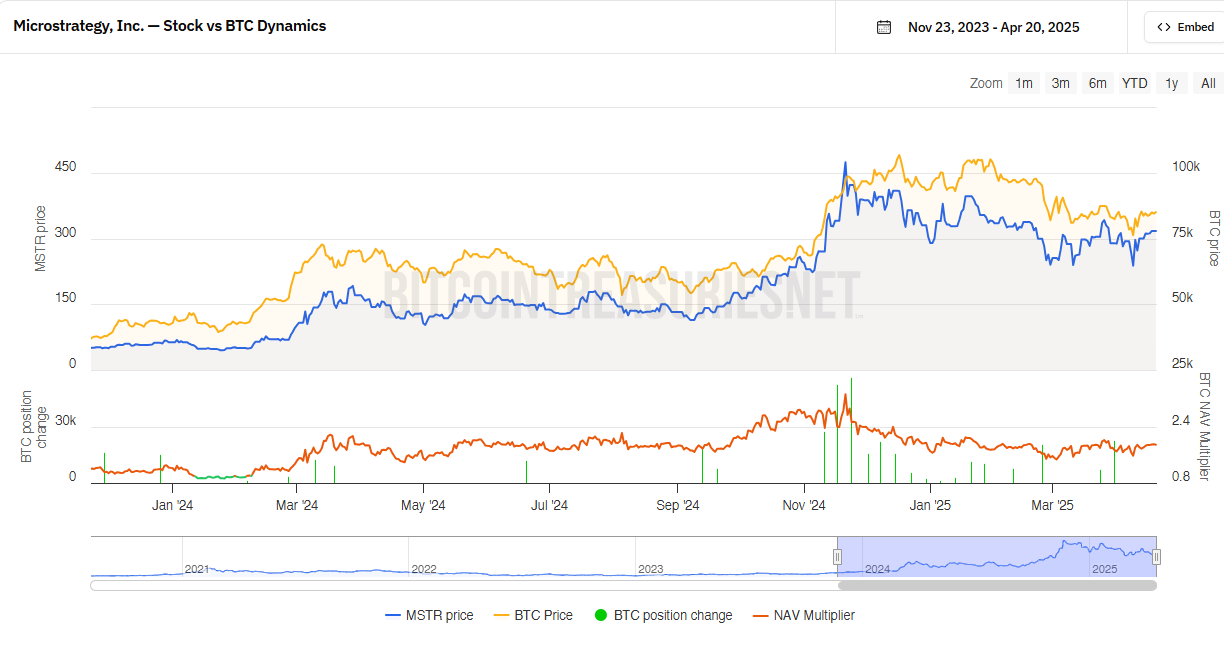
This chart shows how Strategy’s stock price (blue) moves with Bitcoin price (orange). When Bitcoin goes up, MicroStrategy usually follows, but it swings even more.
However, the NAV multiplier has narrowed compared to last year, meaning MicroStrategy’s stock is now trading closer to the actual value of its Bitcoin holdings.
Last year, investors paid a bigger premium for exposure to MSTR, but that gap has shrunk. This suggests a more cautious sentiment or a shift toward valuing the company based on fundamentals rather than just Bitcoin hype.
Byte-Sized Alpha
- Bitcoin ETFs saw modest $15 million inflows, a shift from the previous $713 million outflows, but the smallest influx of 2025, signaling cautious investor sentiment.
- XRP’s futures market shows a bullish shift with long positions exceeding short bets, signaling potential price increases.
- Accumulation signals from whale activity and consolidation at $0.60 indicate a possible rally for Pi Network, despite concerns about the lack of exchange listings and use cases.
- Solana surpasses Ethereum in staking market cap with $53.15 billion, driven by higher staking yield and 65% of supply staked.
- Bitcoin whales accumulated 53,652 BTC worth $4.7 billion in a month, pushing the price to $87,463, but long-term holder profits hit a two-year low.
- PlanB criticizes Ethereum as centralized and pre-mined, citing PoS, tokenomics, and a flexible supply as key red flags.
- Decentraland’s (MANA) price has surged over 10% in 24 hours, hitting a two-month high of $0.31.
Crypto Equities Pre-Market Overview
| Company | At the Close of April 17 | Pre-Market Overview |
| Strategy (MSTR) | $317.20 | $323.49 (+1.98%) |
| Coinbase Global (COIN) | $175.03 | $175.85 (+0.46%) |
| Galaxy Digital Holdings (GLXY.TO) | $15.36 | $15.12 (-1.41%) |
| MARA Holdings (MARA) | $12.66 | $12.83 (+1.34%) |
| Riot Platforms (RIOT) | $6.49 | $6.52 (+0.54%) |
| Core Scientific (CORZ) | $6.61 | $6.59 (-0.27%) |
Disclaimer
In adherence to the Trust Project guidelines, BeInCrypto is committed to unbiased, transparent reporting. This news article aims to provide accurate, timely information. However, readers are advised to verify facts independently and consult with a professional before making any decisions based on this content. Please note that our Terms and Conditions, Privacy Policy, and Disclaimers have been updated.

PI has been on a steady downtrend since February 26, shedding 72% of its value as bearish sentiment continues to weigh on the token.
Bearish pressure continues to mount on the PI token, suggesting that it may be poised to enter a new phase of decline.
PI Network Risks Fresh Decline
An assessment of the PI/USD one-day chart reveals that token holders remain steadfast in their distribution. At press time, PI’s Balance of Power (BoP) is negative, reflecting the selling pressure in the market.
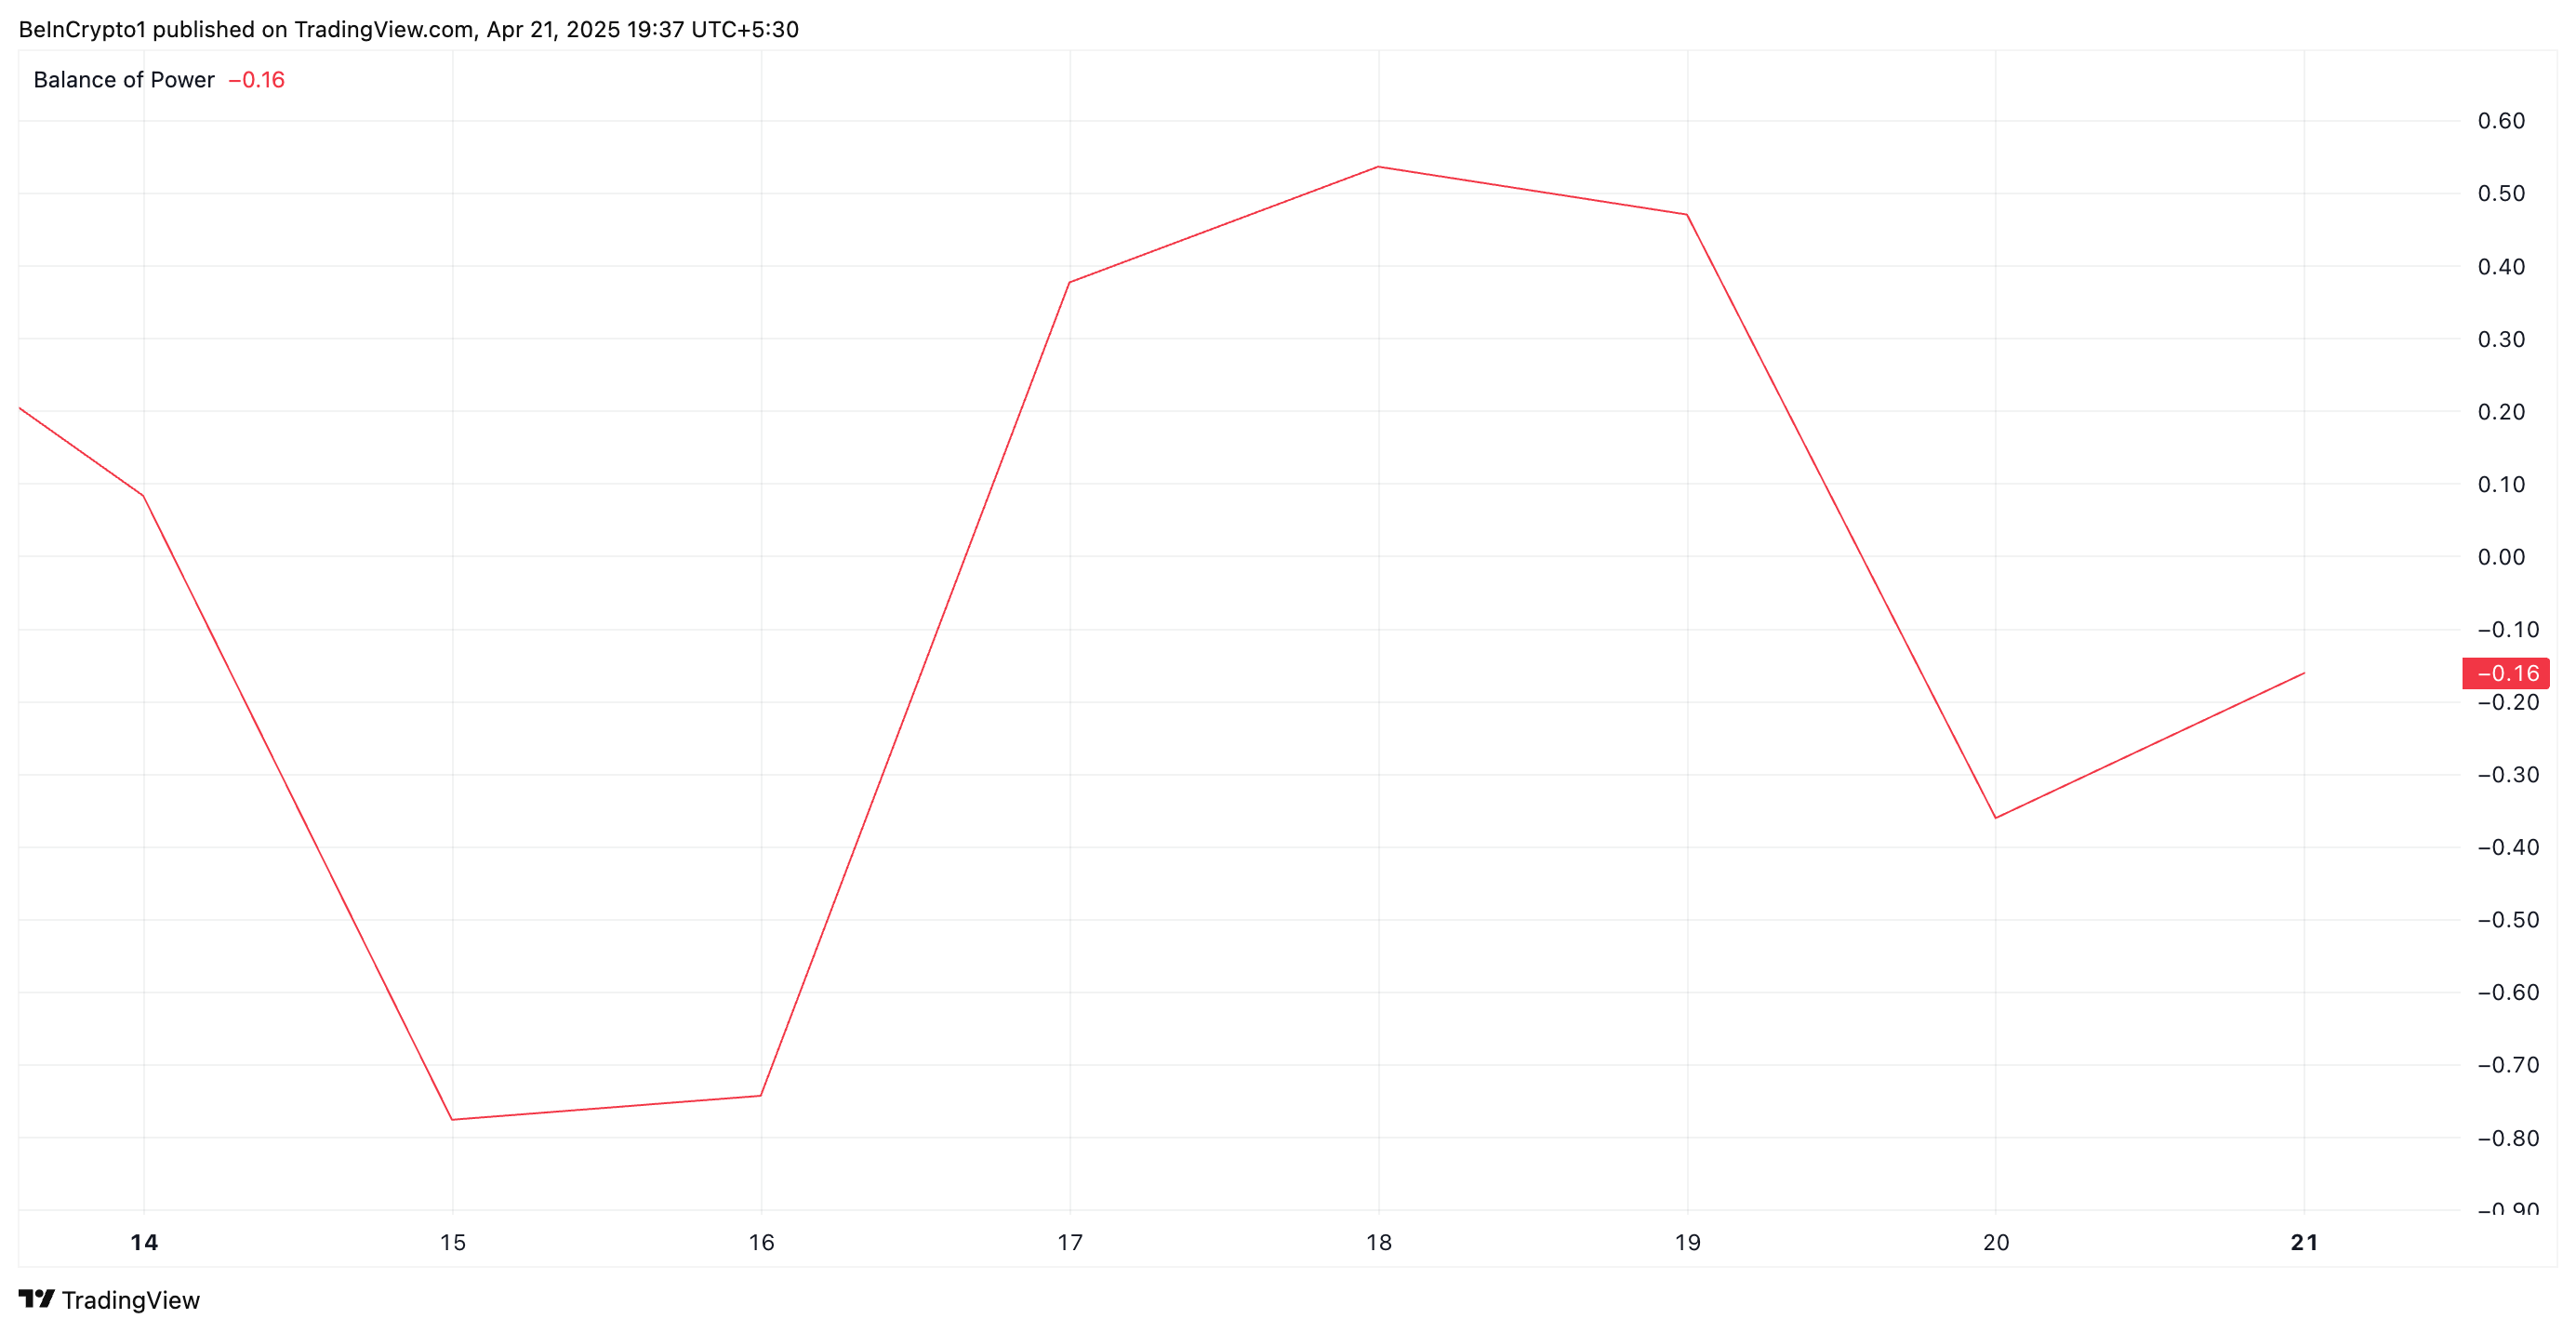
The BoP indicator measures the strength of buying versus selling pressure by comparing the close price to the trading range within a given period. When BOP is negative like this, it indicates that sellers are dominating the market, suggesting downward pressure on the asset’s price.
Further, the setup of PI’s Chaikin Money Flow (CMF) supports this bearish outlook. At press time, this is below the central line at -0.12.
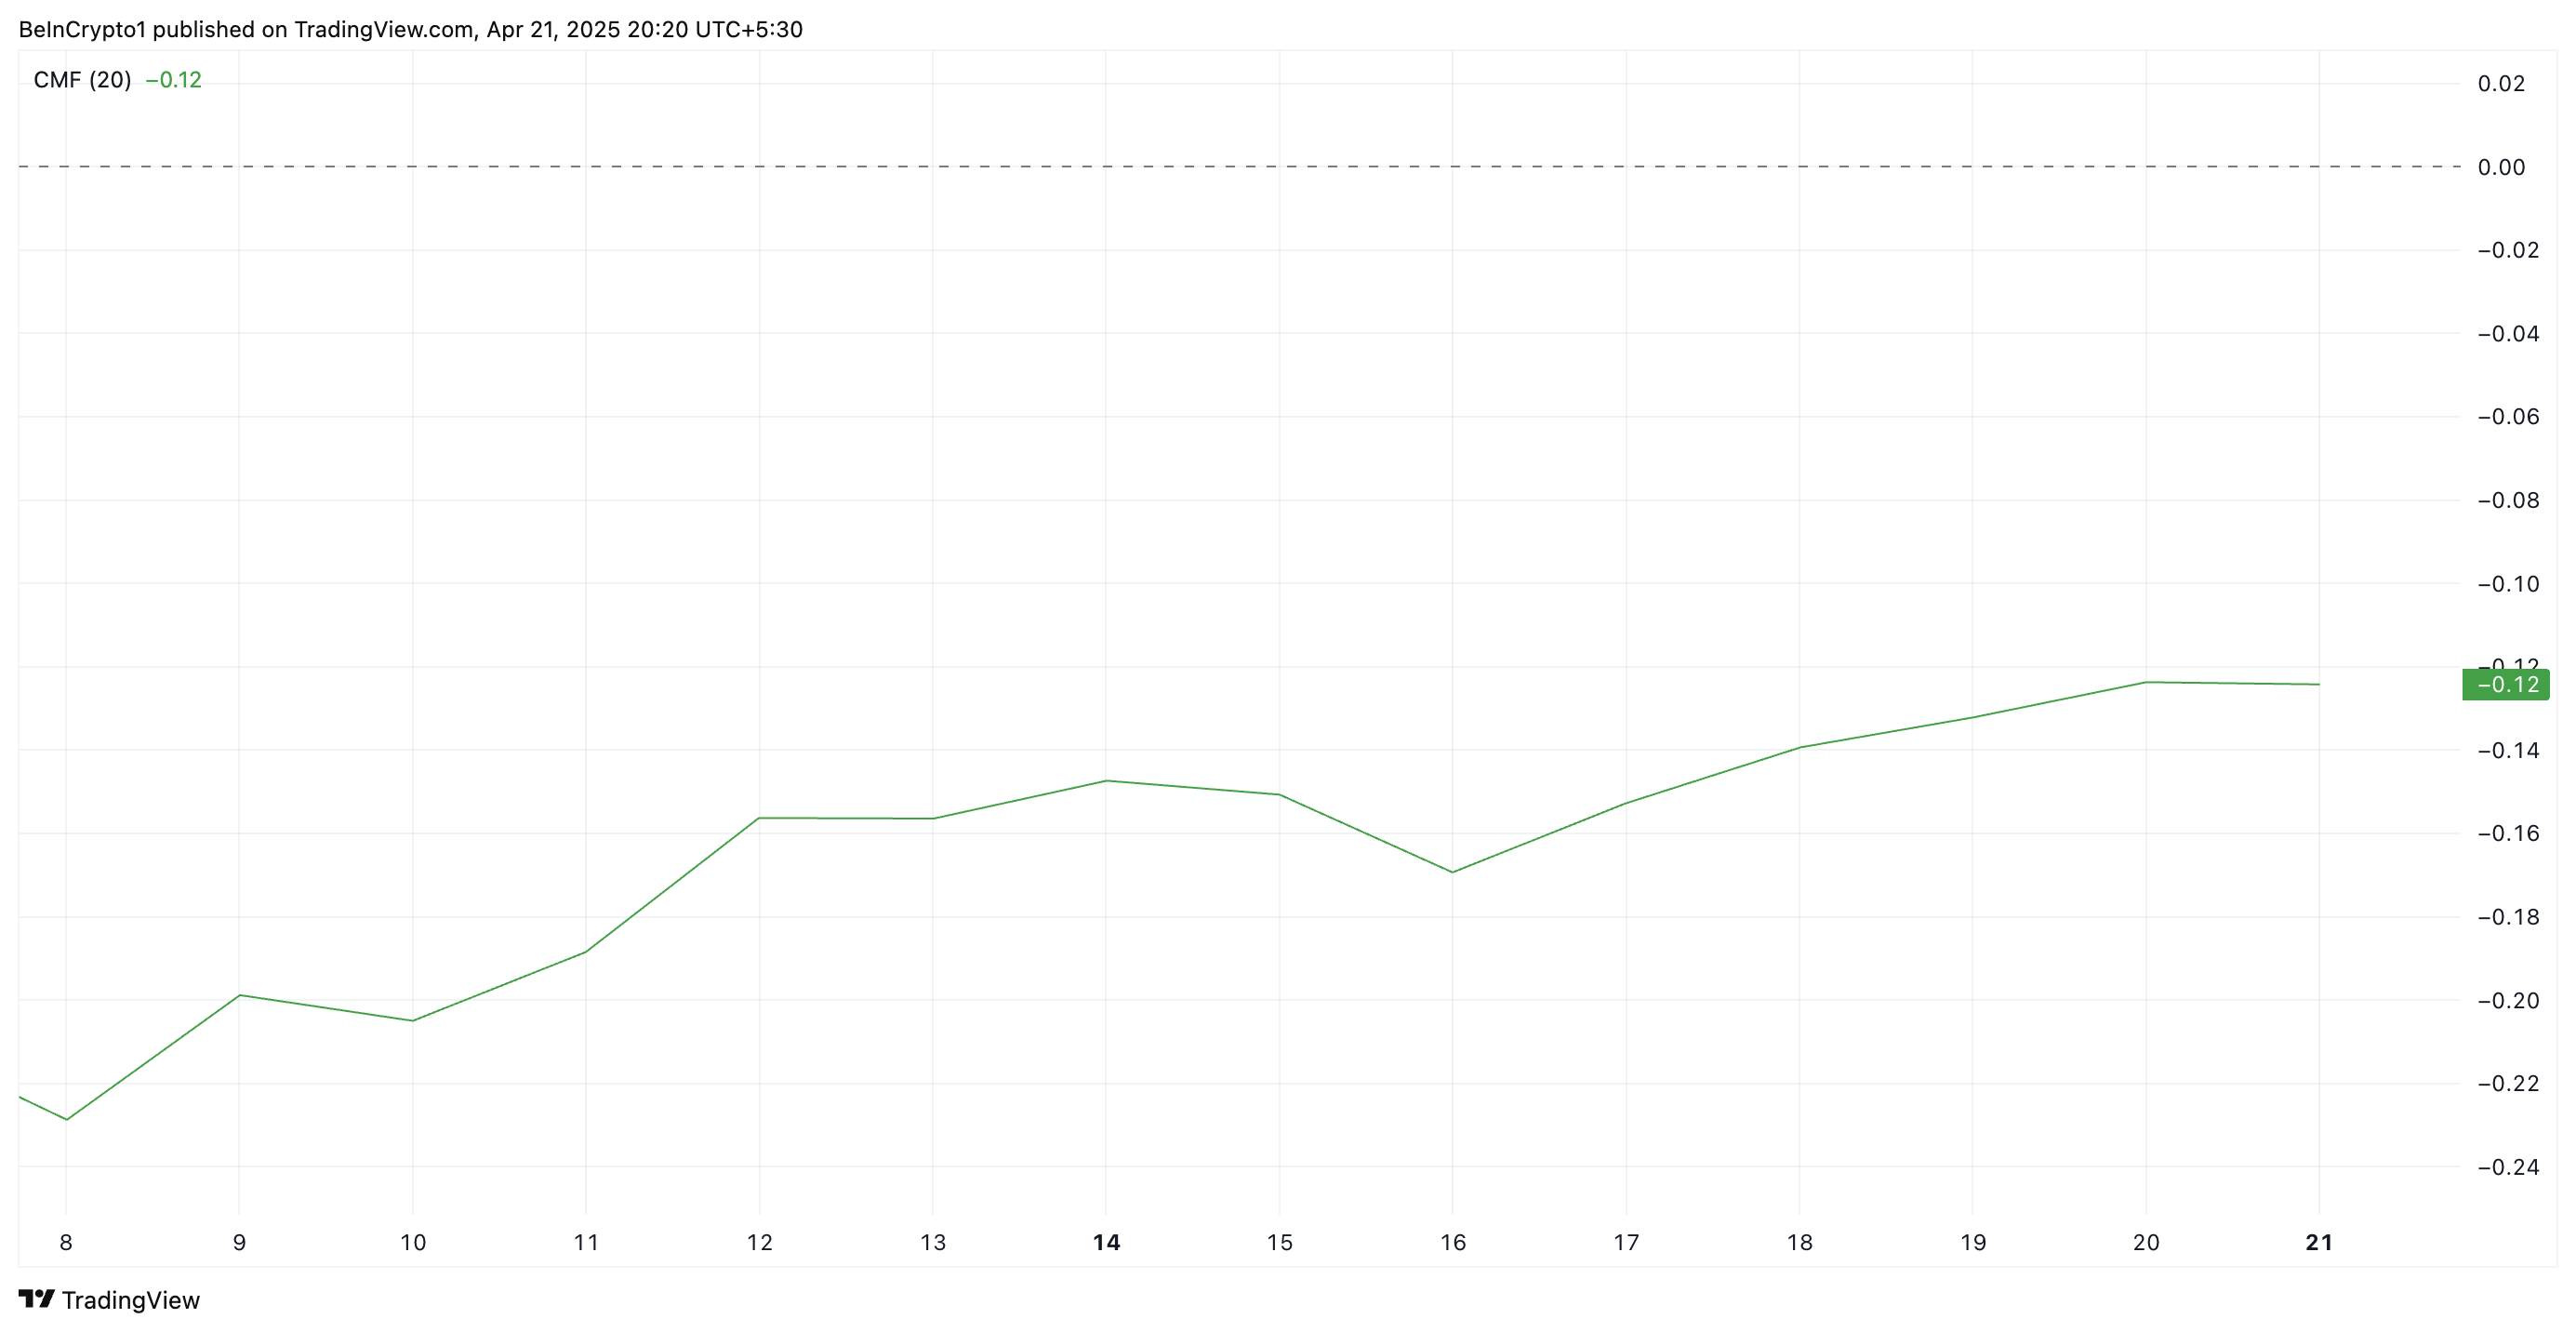
The CMF indicator measures an asset’s buying and selling pressure. A negative CMF reading suggests that the asset is experiencing more selling pressure than buying pressure. This means PI traders are distributing rather than accumulating. This signals bearish sentiment and confirms the downward momentum in the token’s price.
Sellers Tighten Grip on PI, But Recovery to $1.01 Still on the Table
At press time, PI trades at $0.63, below the dynamic support formed above it at $0.93 by its Super Trend indicator.
The Super Trend indicator helps traders identify the market’s direction by placing a line above or below the price chart based on the asset’s volatility.
When an asset’s price trades below the Super Trend line like this, it signals a bearish trend and hints at potential decline. If PI’s decline strengthens, it could revisit its all-time low of $0.40.
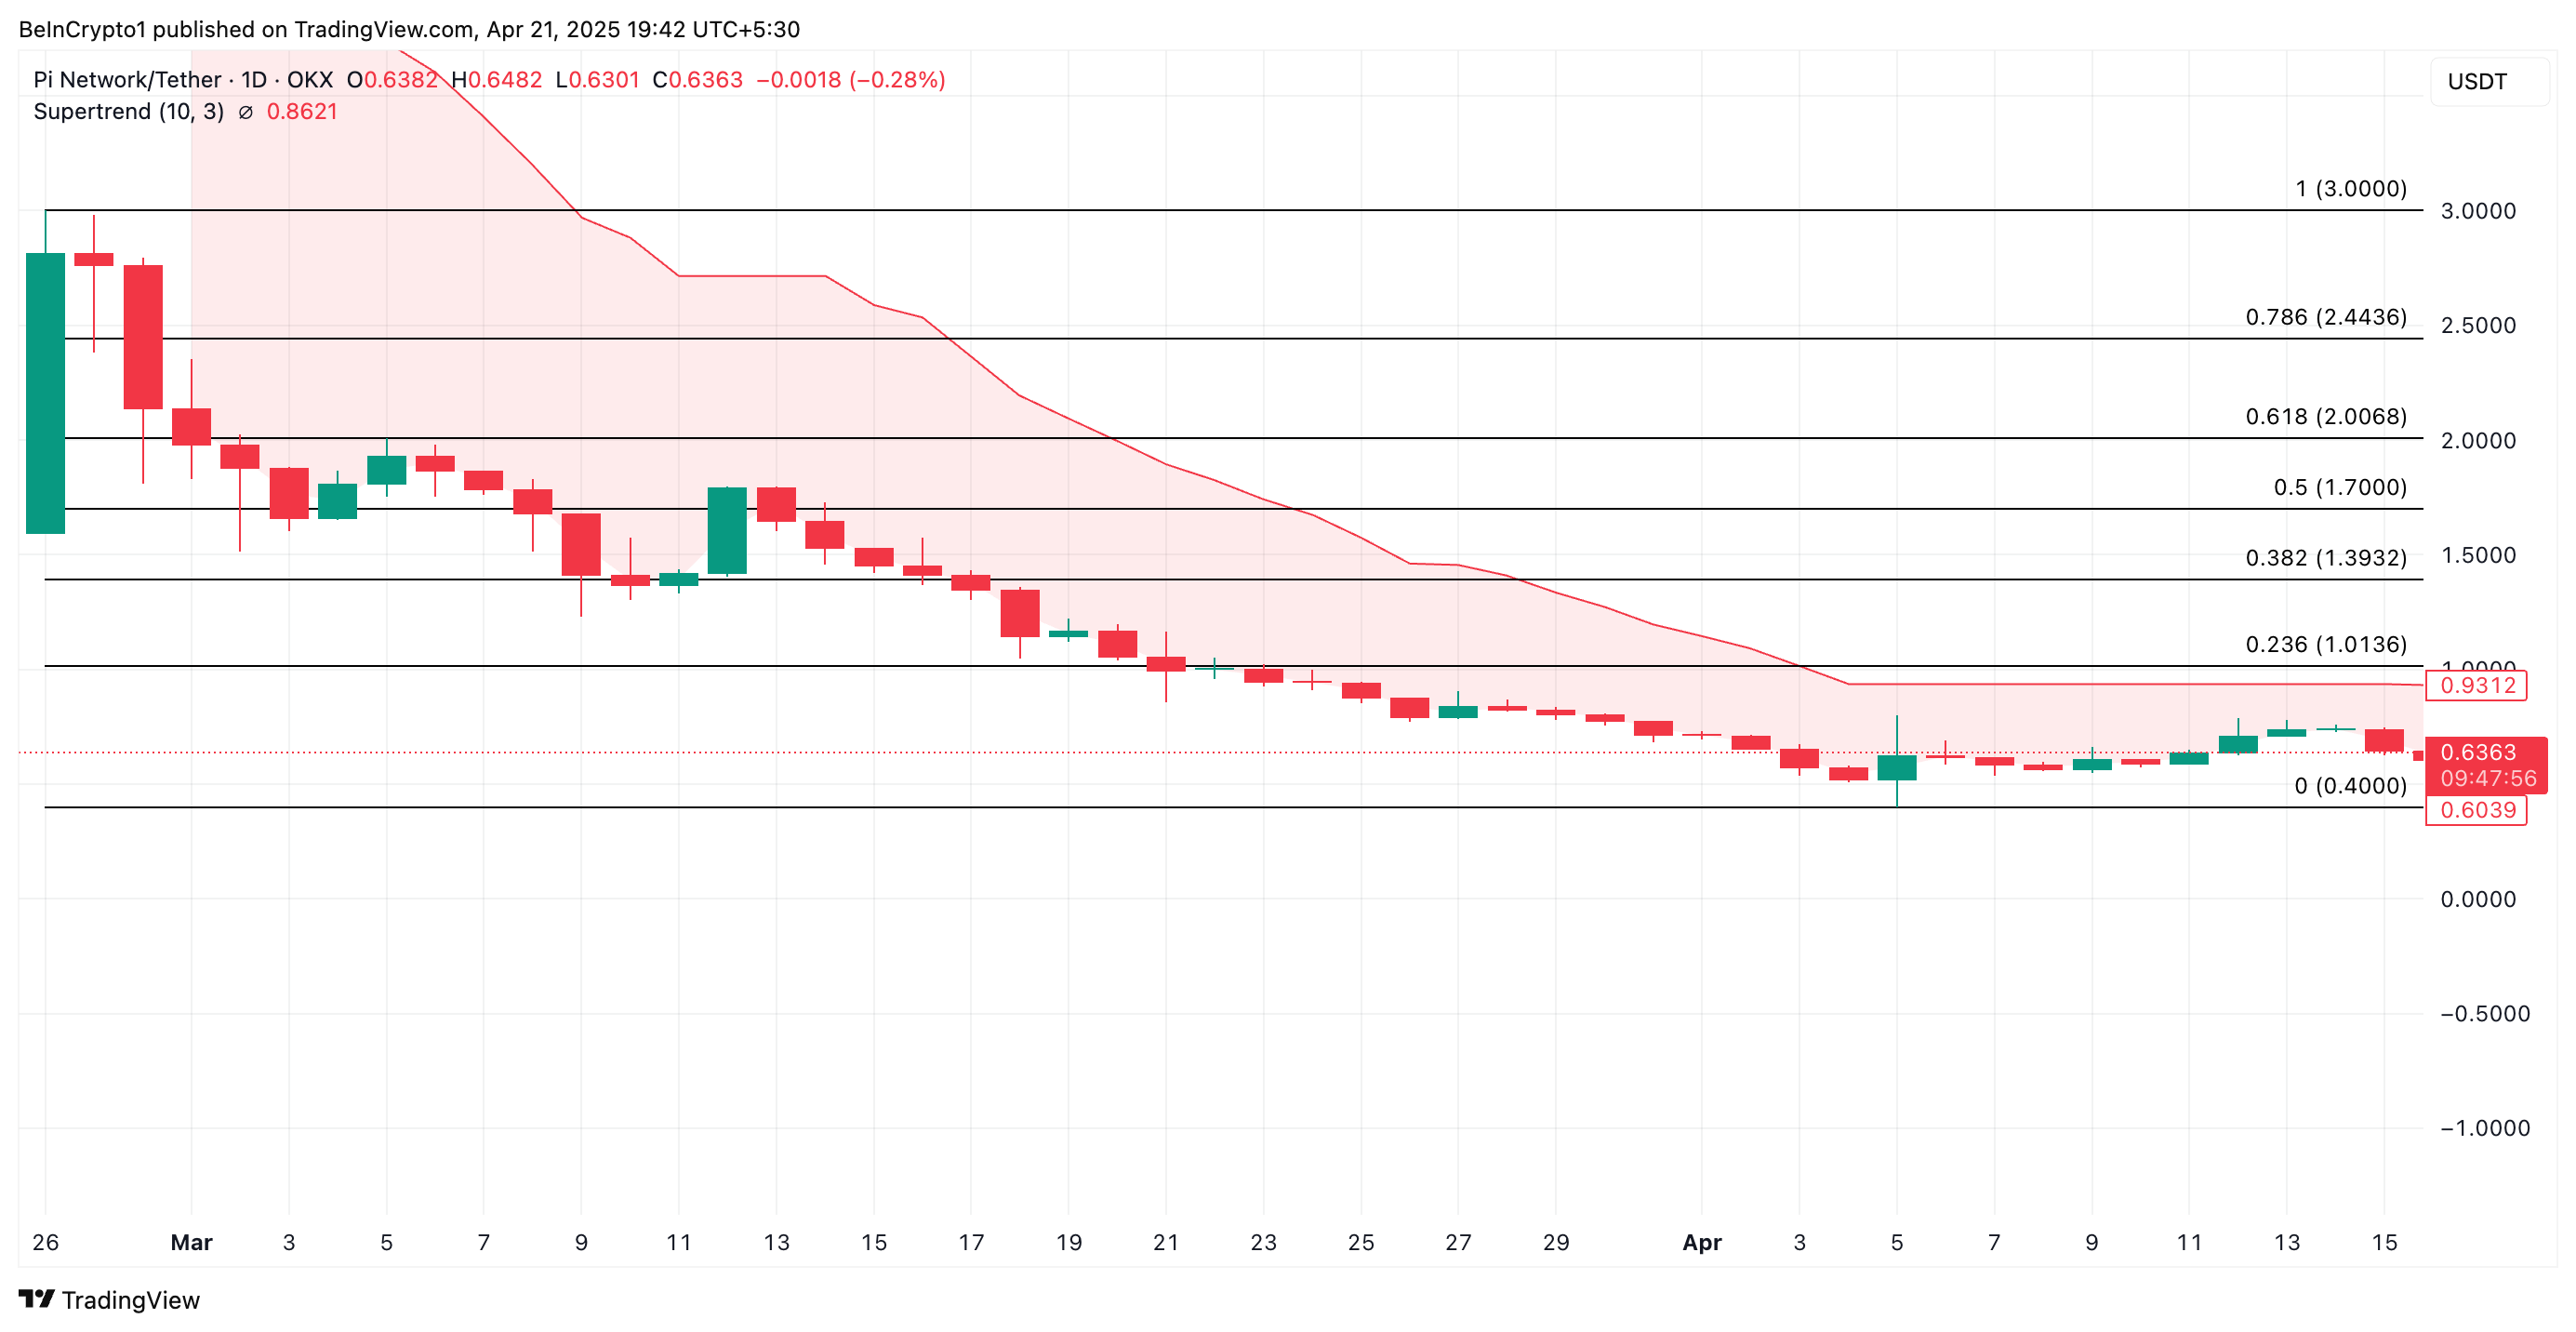
However, if demand returns to the PI market, its price could break above the resistance at $0.86 and surge to $1.01.
Disclaimer
In line with the Trust Project guidelines, this price analysis article is for informational purposes only and should not be considered financial or investment advice. BeInCrypto is committed to accurate, unbiased reporting, but market conditions are subject to change without notice. Always conduct your own research and consult with a professional before making any financial decisions. Please note that our Terms and Conditions, Privacy Policy, and Disclaimers have been updated.

PancakeSwap Sets Date for CAKE 3.0 Amid Community Concern

How Will it Impact OM Price?

Ethereum Analyst Sets $3,000 Target As Price Action Signals Momentum – Details

Strategy’s 12% YTD Yield and $555M Acquisition

PI Token Price Faces Bearish Pressure, Risking a Drop to $0.40
Top Solana Price Levels to Watch in the Short Term

2.52 Million Altcoins Are Ruining Crypto’s Future

Animoca Brands Valuation Tanks 75% In Two Years, Here’s Why

Crypto exchange BingX hacked for $43 million

Are The Big Players Losing Interest?

Hong Kong’s Securities Association Tips Authorities On Crypto Self-Regulation

Coinbase cbBTC Set to go Live on Solana
2.52 Million Altcoins Are Ruining Crypto’s Future
Animoca Brands Valuation Tanks 75% In Two Years, Here’s Why
Crypto exchange BingX hacked for $43 million
Are The Big Players Losing Interest?
Hong Kong’s Securities Association Tips Authorities On Crypto Self-Regulation
Coinbase cbBTC Set to go Live on Solana
-

 Market24 hours ago
Dogecoin Defies Bullish Bets During Dogeday Celebration
-

 Market22 hours ago
Will XRP Break Support and Drop Below $2?
-
 Bitcoin12 hours ago
US Economic Indicators to Watch & Potential Impact on Bitcoin
-
 Altcoin24 hours ago
Expert Predicts Pi Network To Reach $5 As Whales Move 41M Pi Coins Off Exchanges
-

 Bitcoin21 hours ago
Bitcoin LTH Selling Pressure Hits Yearly Low — Bull Market Ready For Take Off?
-

 Bitcoin18 hours ago
Here Are The Bitcoin Levels To Watch For The Short Term
-

 Market14 hours ago
Bitcoin Price Breakout In Progress—Momentum Builds Above Resistance
-

 Altcoin14 hours ago
Expert Says Solana Price To $2,000 Is Within Reach, Here’s How