
Market
Altcoins to Watch This October

Uptober is just around the corner. Crypto traders are eagerly anticipating the market’s usual rally at this time of year.
As the market prepares for a potential surge, BeinCrypto has compiled a list of altcoins you should keep an eye on this October.
Celestia (TIA)
TIA tokens worth $1.1 billion will be unlocked on October 31. These tokens are allocated to the project’s original core contributors, research and development efforts, Series A, Series B, and seed round investors.
Generally, a large influx of tokens into the market could lead to increased selling pressure. If the market is already bearish or experiencing a general downturn, the token unlock could worsen the situation.
Read more: 10 Best Altcoin Exchanges In 2024
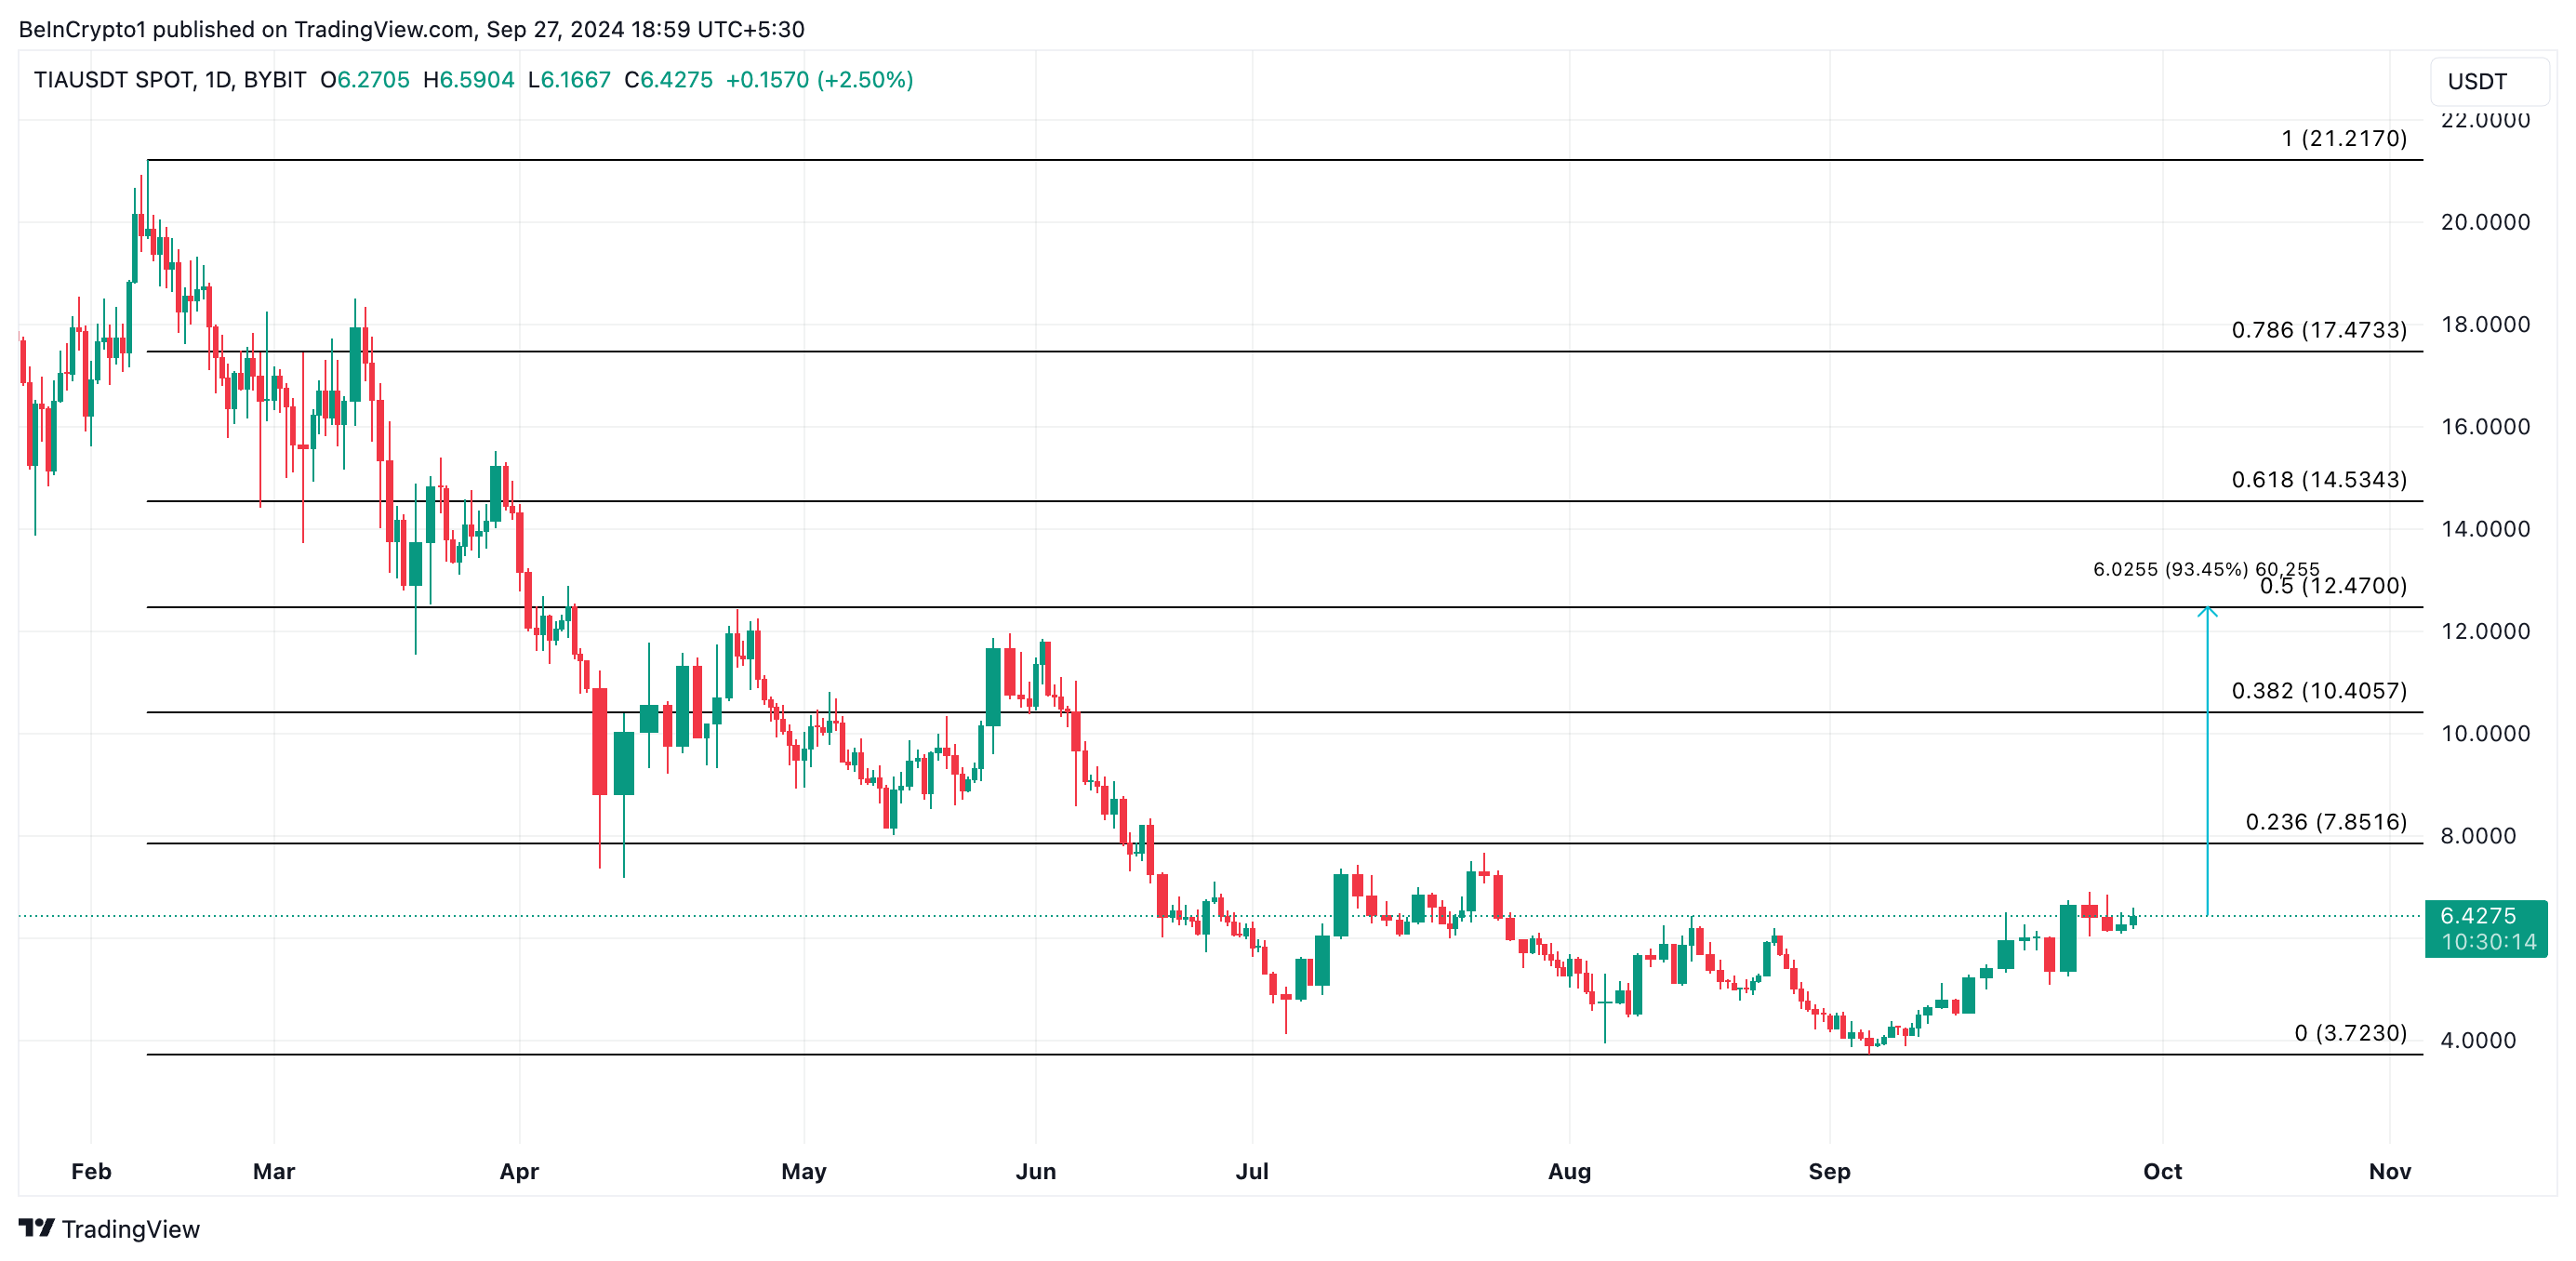
Currently, TIA enjoys a significant bullish bias from market participants. It trades at $6.42, noting a 10% surge over the past week. The rally is expected to continue through October toward $12.47, fueled by the excitement around Celestia’s just-concluded $100 million funding round.
However, if the excitement plummets as the token unlock nears, TIA’s price may drop to shed its gains and fall to $3.72.
Uniswap (UNI)
One reason why UNI should be on your watchlist for October is the potential launch of Uniswap V4 in the last quarter of the year. This iteration of decentralized exchange (DEX) introduces several key features, including “hooks” for customizable liquidity pools, singleton contracts for reduced gas fees, flash accounting for efficient transactions, and more.
Read more: How To Buy Uniswap (UNI) and Everything You Need To Know
Sponsored
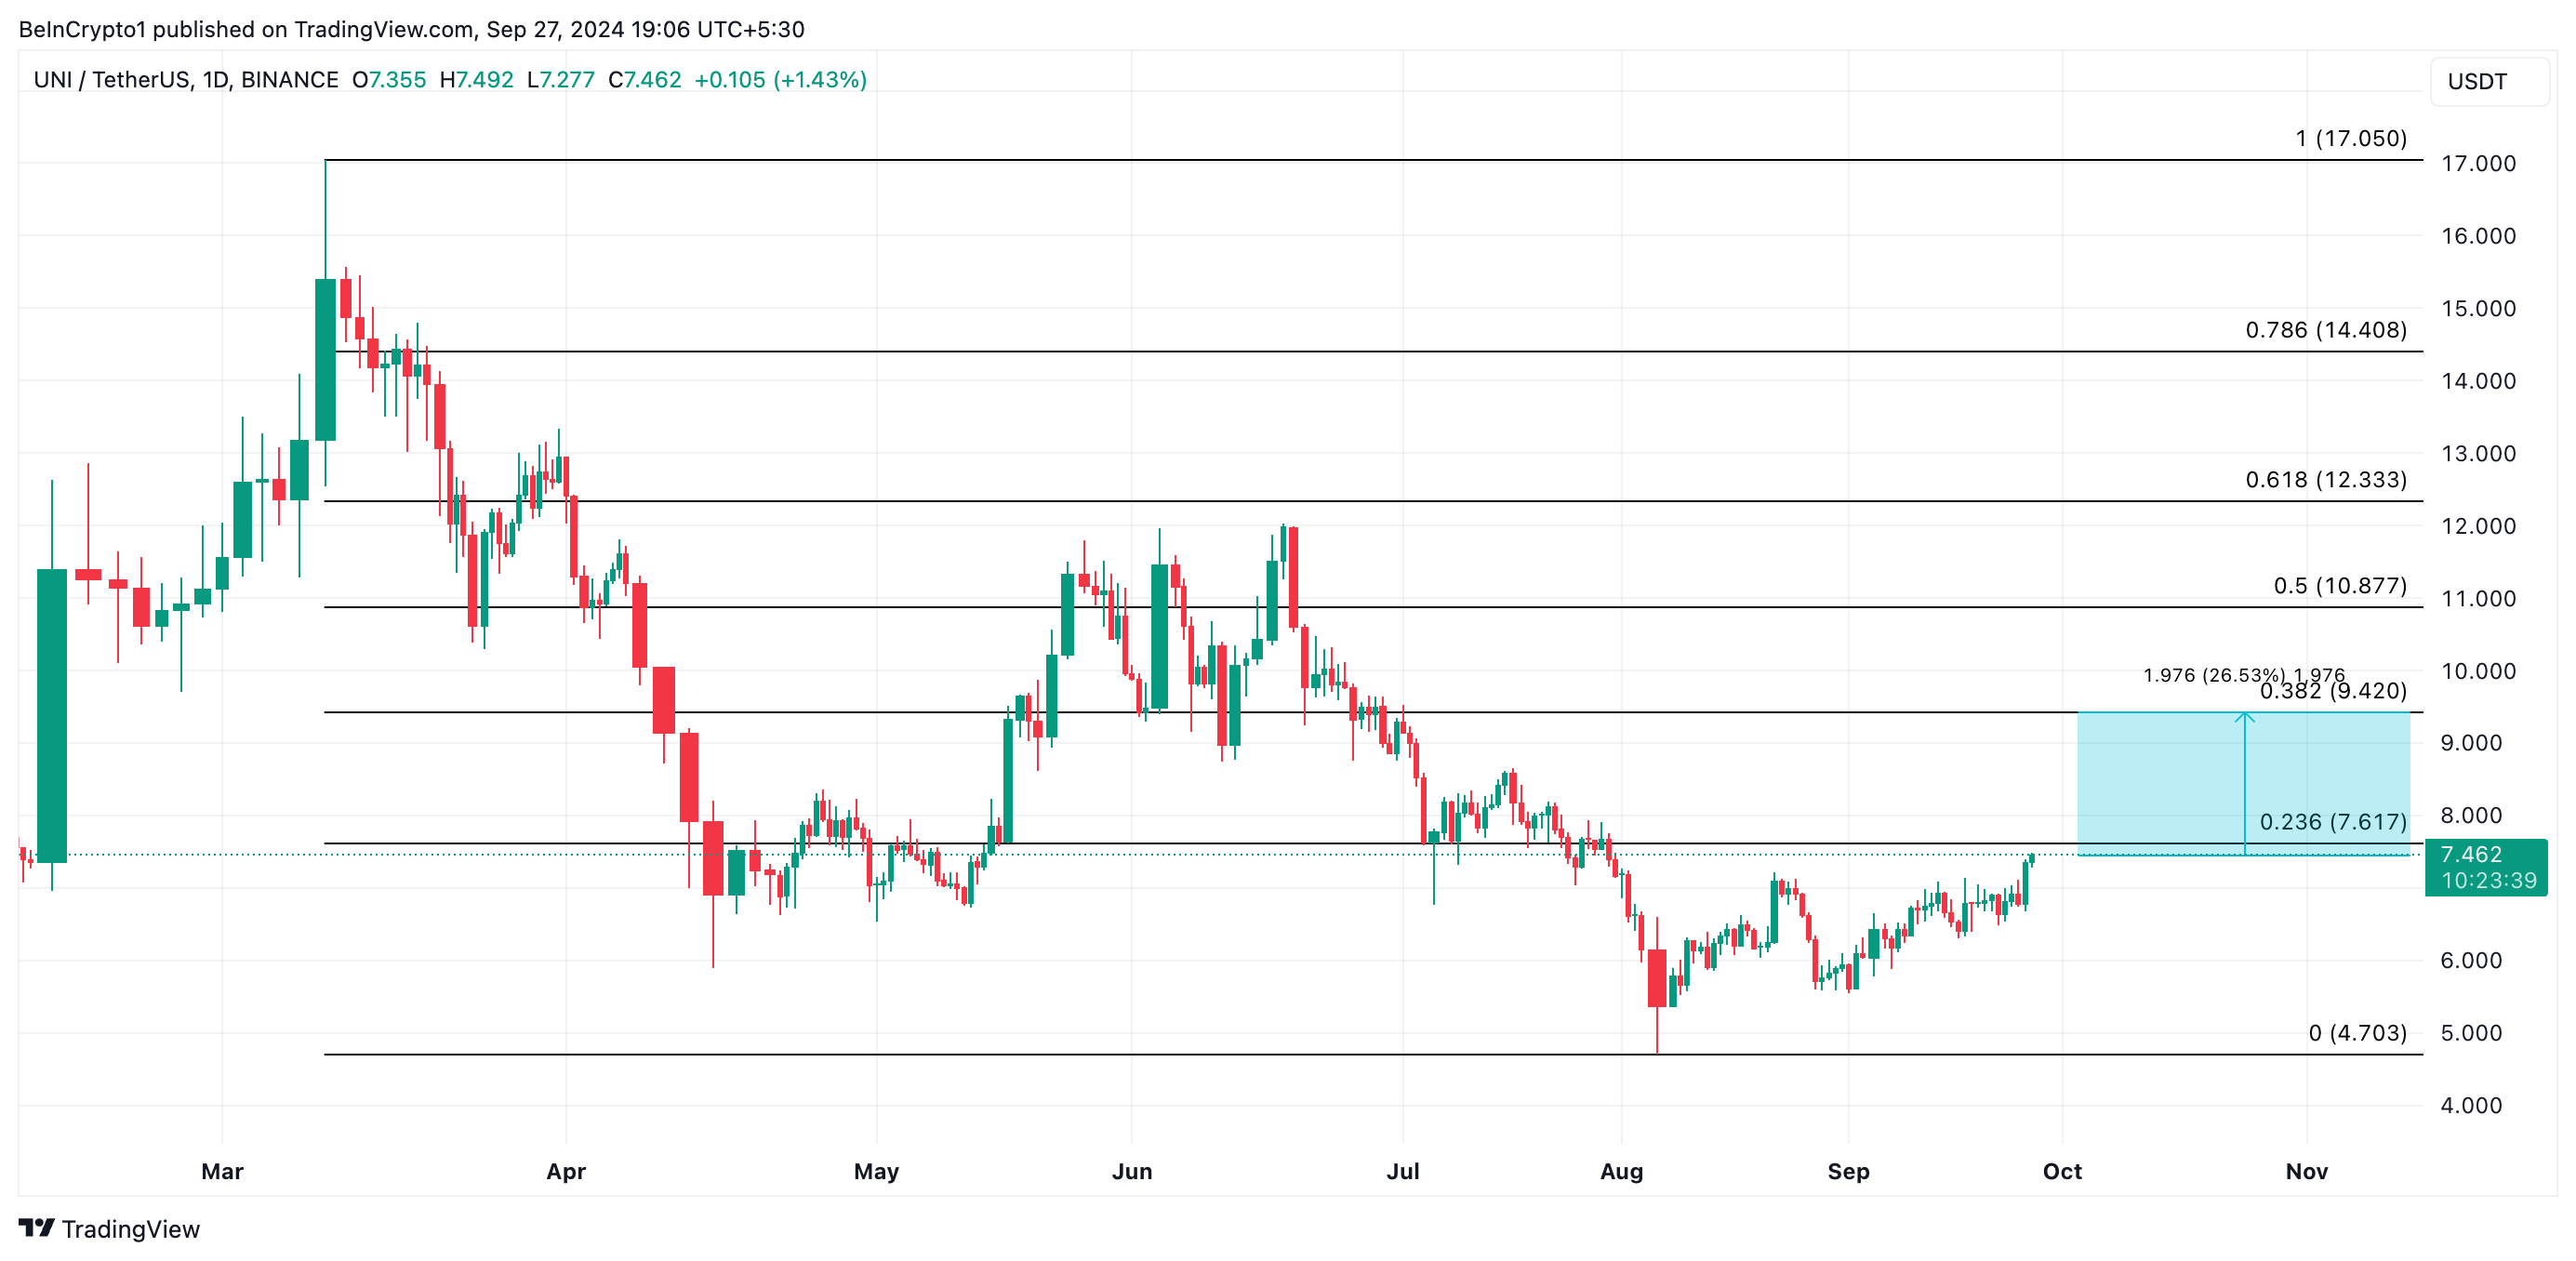
The anticipation of this upgrade could propel UNI’s price in October. At press time, the altcoin trades at $7.46, noting a 28% uptick in the last month. If the market’s upward trend is maintained, UNI may attempt to breach the critical resistance level of $9.42.
Sei (SEI)
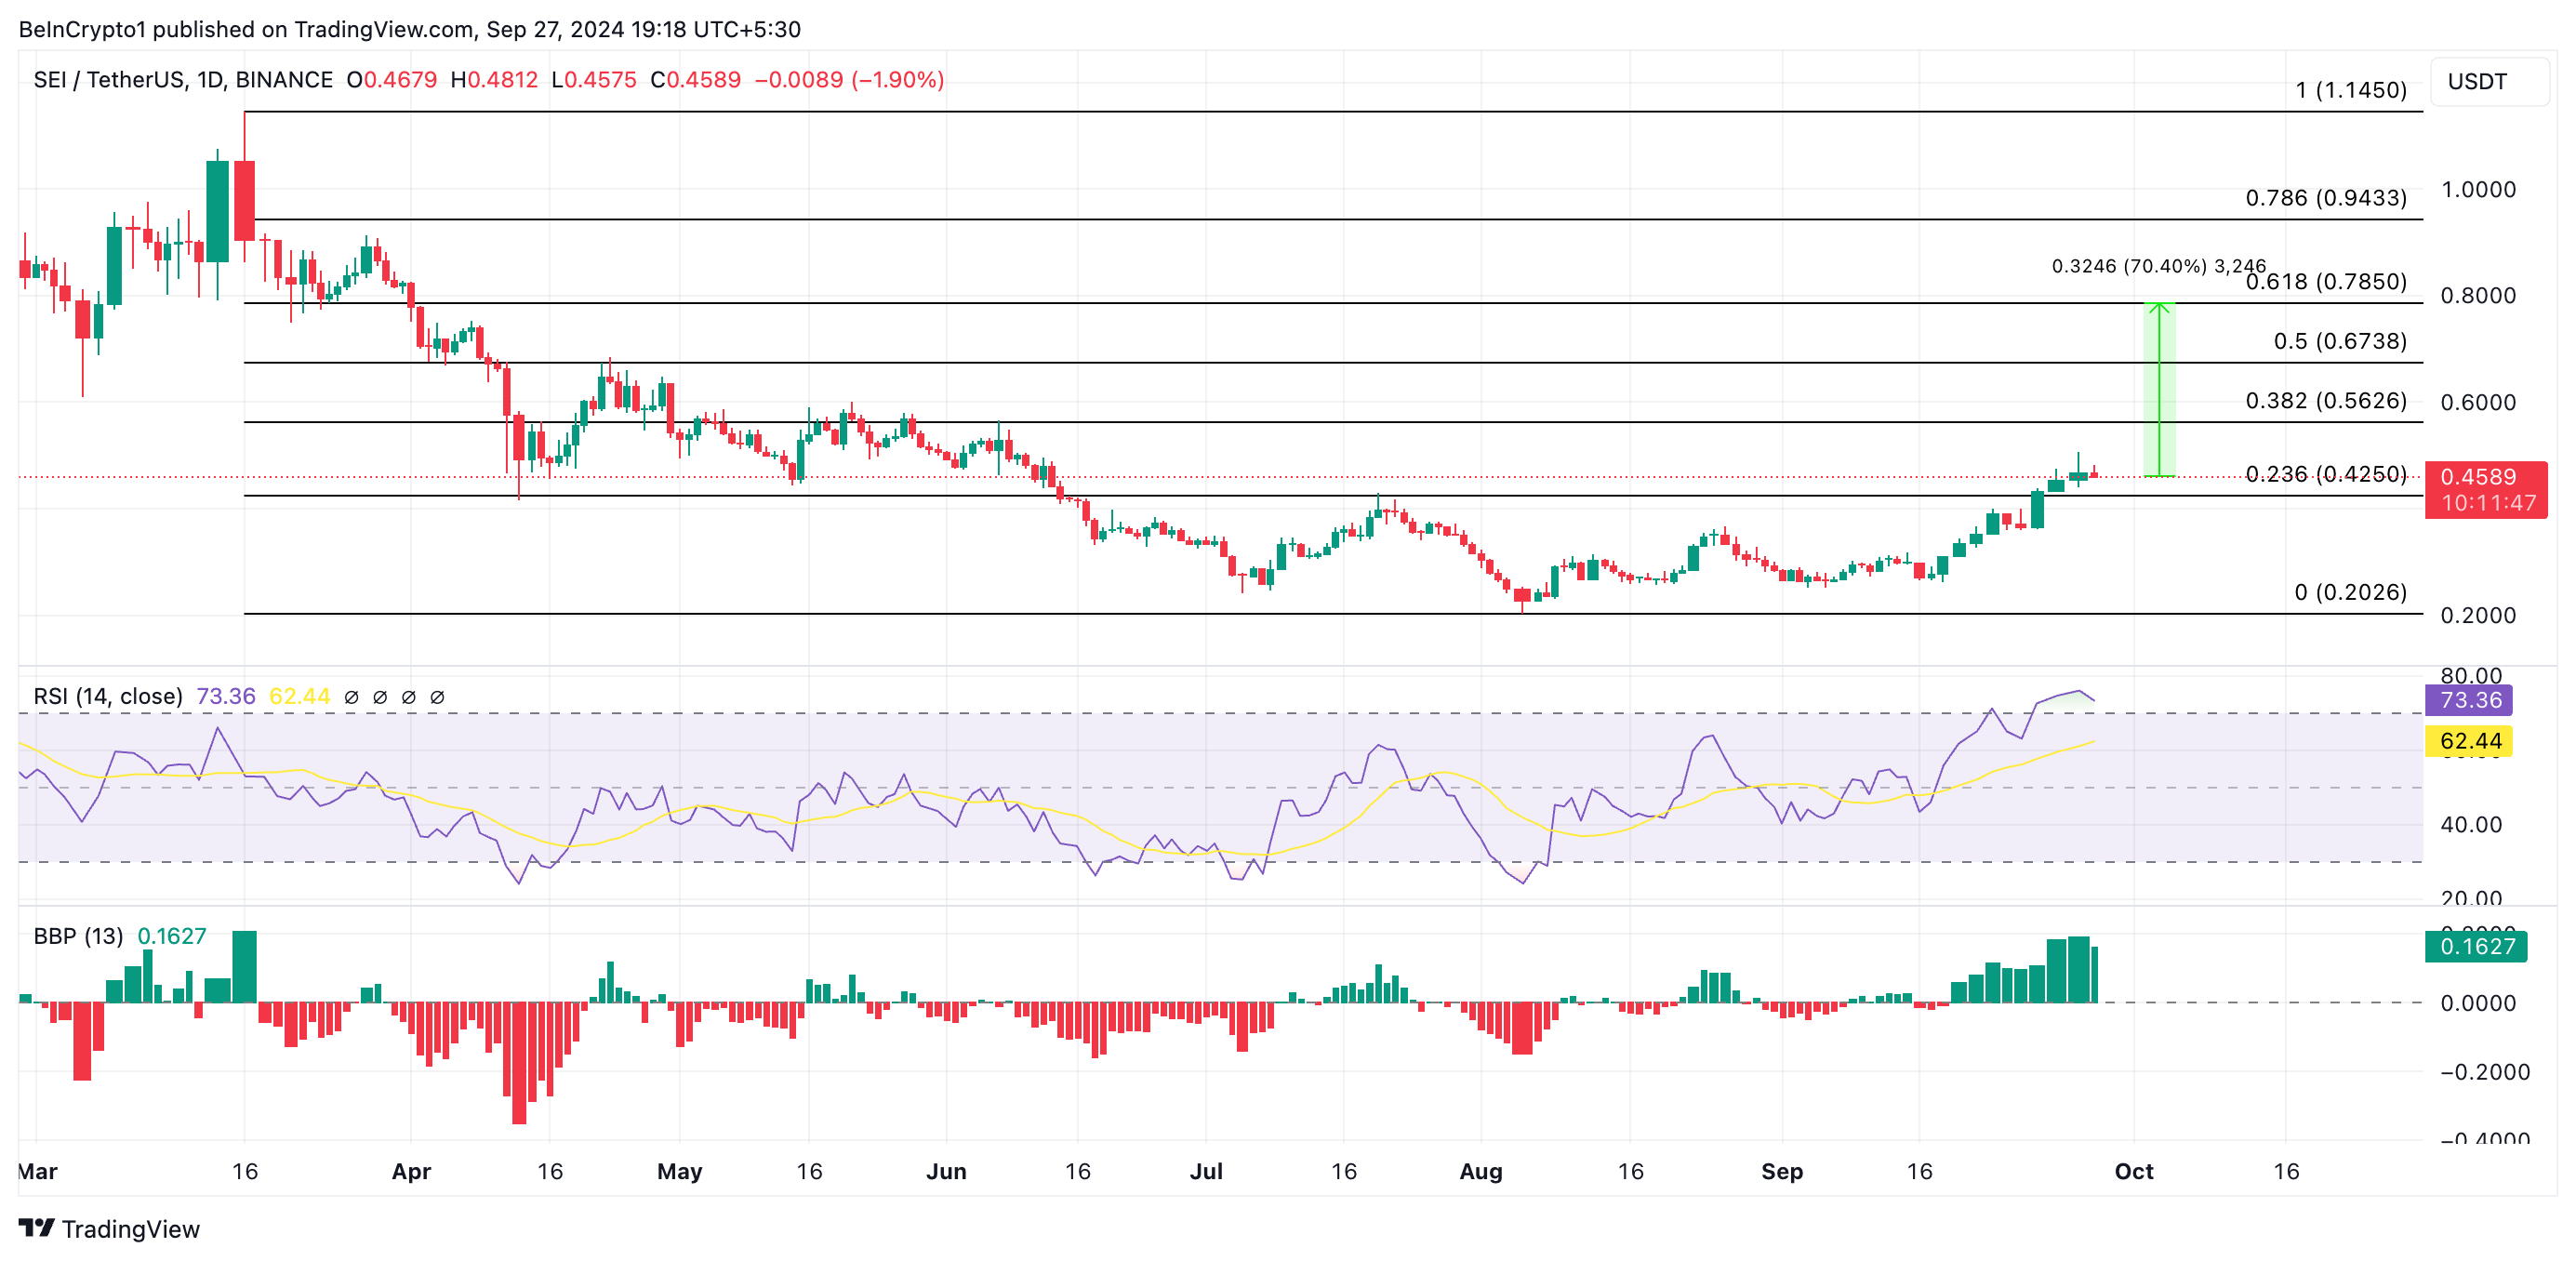
Sei has been in the news lately as its native coin, SEI, continues to record new highs. At a current price of $0.45, SEI ranks as the third fastest-growing altcoin among the top 100 by market cap over the past week. During that period, its price has surged by 32%.
An assessment of its bull/bear power reveals that the bullish sentiment in the market is significant. This is evidenced by its positive Elder-Ray Index, which measures the strength of buyers and sellers in the market. At press time, this is 0.16, indicating that buying pressure is high.
However, for traders looking to profit from the rally, it is key to point out that SEI may witness a price reversal in October. Readings from its Relative Strength Index (RSI), which is 73.36, signal that the altcoin is overbought.
Read more: 11 Cryptos To Add To Your Portfolio Before Altcoin Season
RSI measures an asset’s overbought or oversold market conditions. It ranges between 0 and 100, with values above 70 suggesting that an asset is overbought and due for a correction, while values below 30 signal that the asset is oversold and may soon see a rebound.
A correction in SEI’s price may see it trade at $0.20 in October. However, if demand continues to enter the market, the coin’s price may extend its gains by another 70%, although this is unlikely.
Ripple (XRP)
There is ongoing speculation that the US Securities and Exchange Commission (SEC) will appeal against Judge Analisa Torres’ July 13 decision in the Ripple case. The deadline for filing such an appeal is October 7. If the regulator goes ahead with the same, XRP may lose some of its recent gains.
An SEC appeal will likely increase XRP’s selling pressure. Market sentiment toward the altcoin may shift from bullish or neutral to negative as a result.
Read more: Everything You Need To Know About Ripple vs SEC
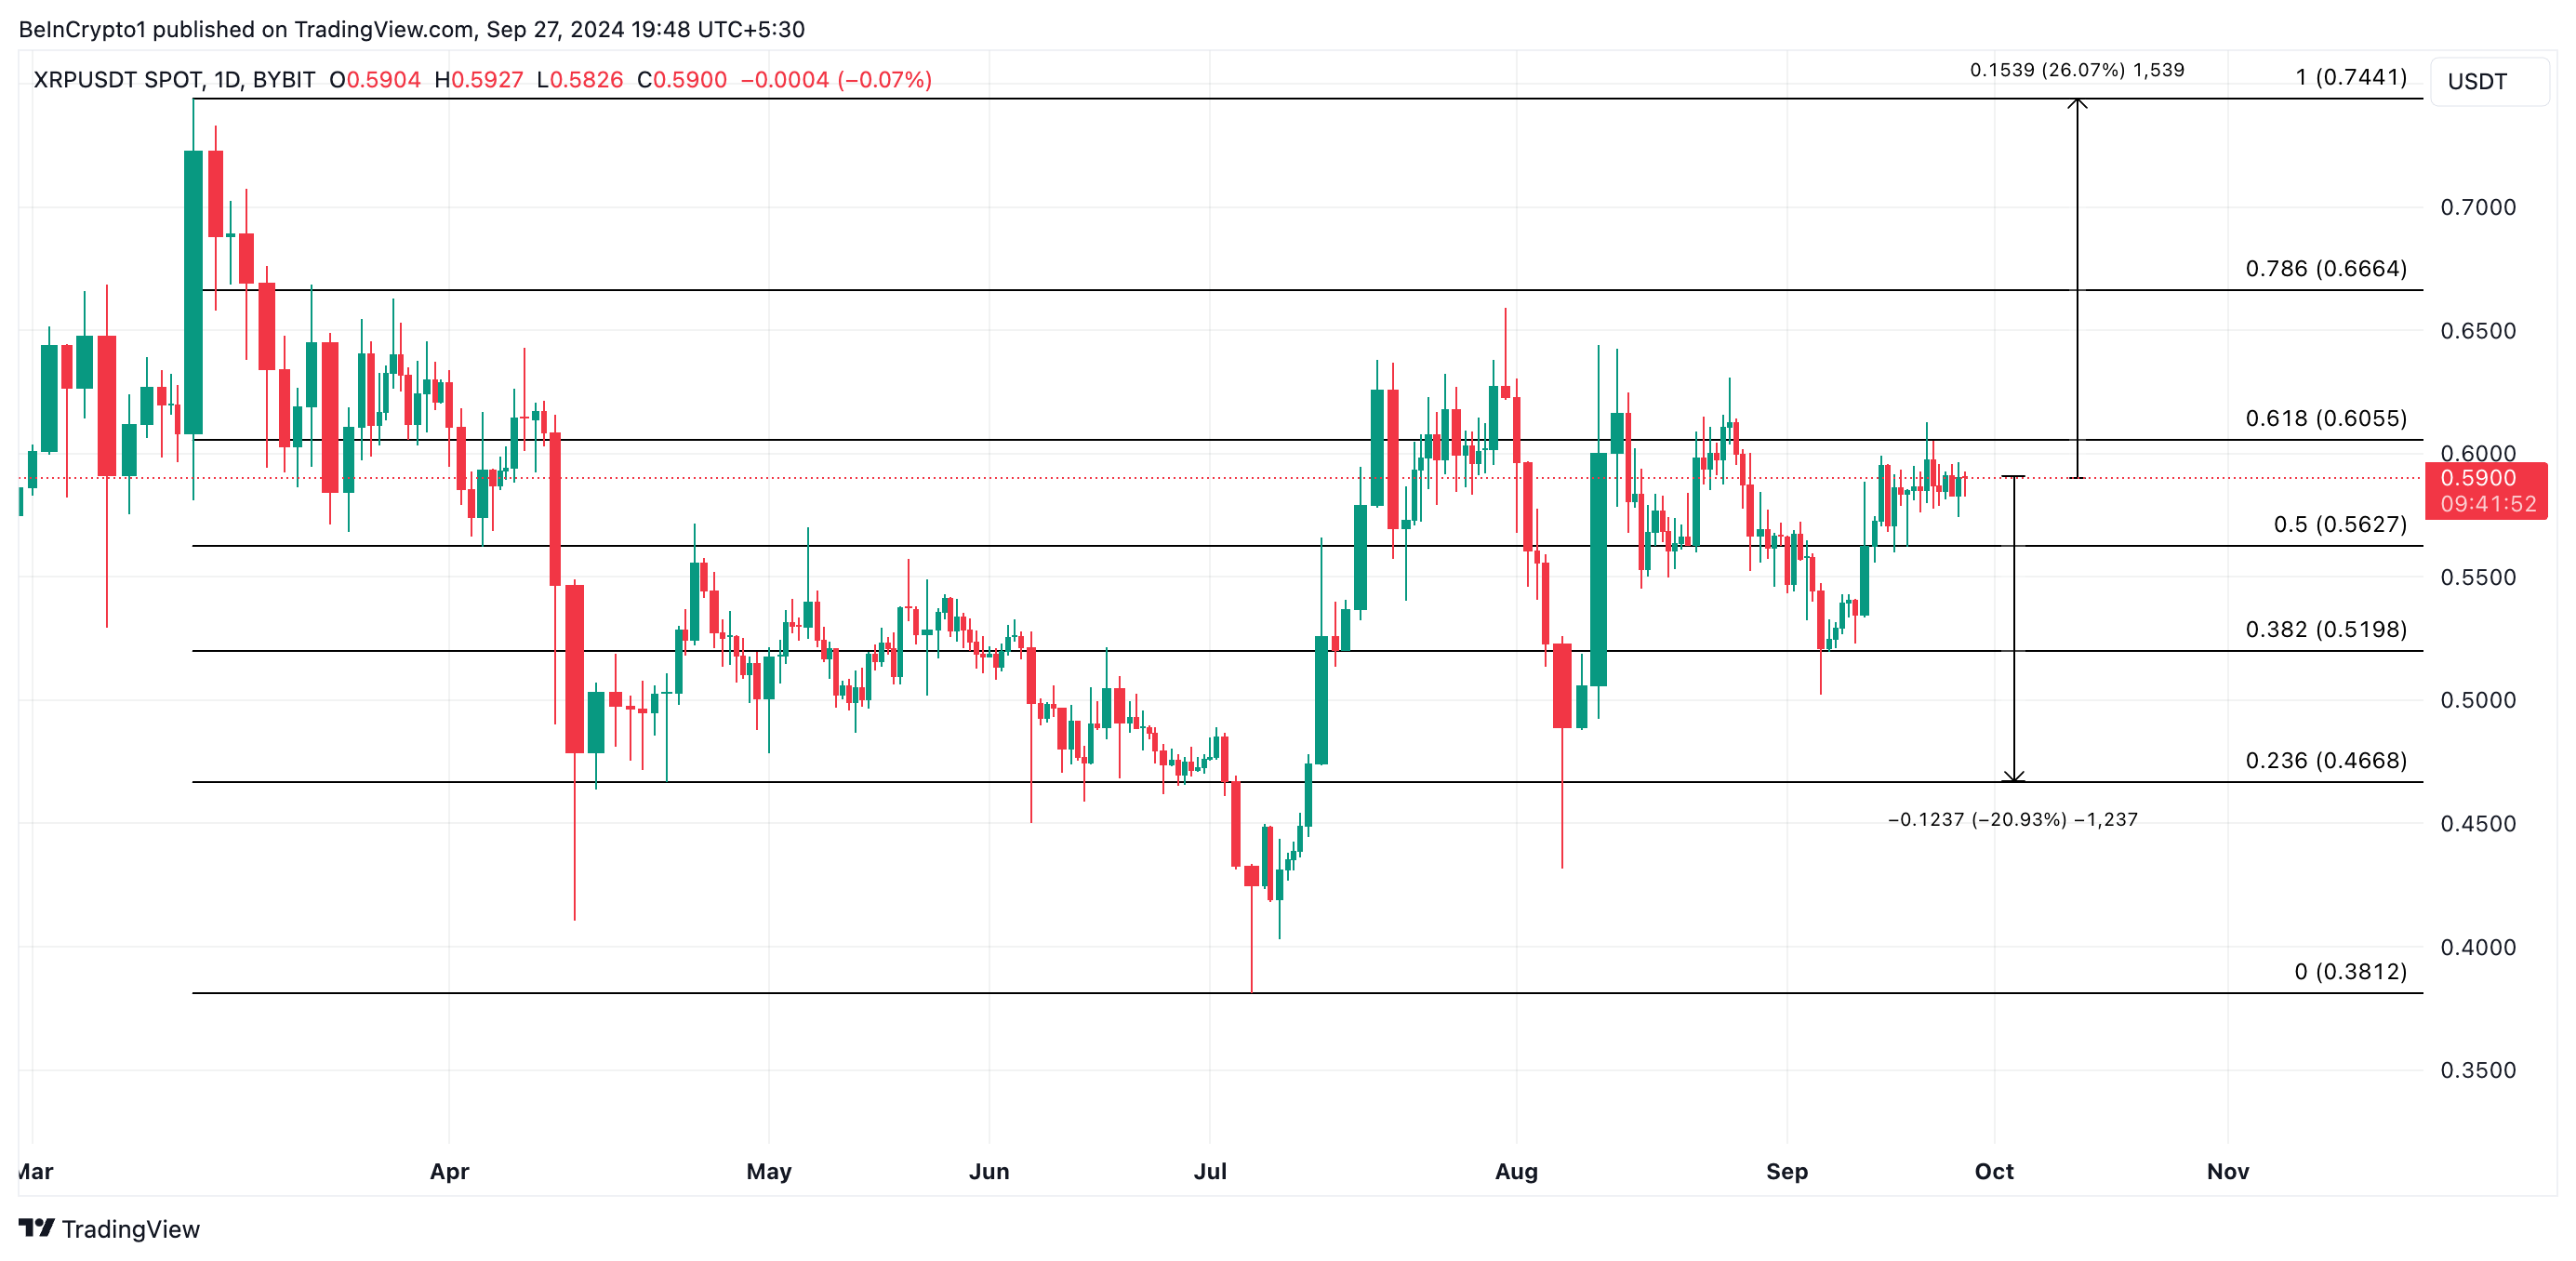
If this happens, XRP’s price may drop by 21% to trade at support floor formed at $0.46. However, if no such appeal is filed, the token may continue its uptrend and rally by another 26% to exchange hands at $0.74.
Fantom’s upcoming Sonic upgrade has driven FTM’s rally throughout this month, with momentum expected to carry into October. Set to launch on the mainnet in November, the upgrade will significantly boost the network’s performance by introducing the new Fantom Virtual Machine (FVM), an optimized Lachesis consensus mechanism, and the Carmen database storage system.
Read more: 9 Best Fantom (FTM) Wallets in 2024
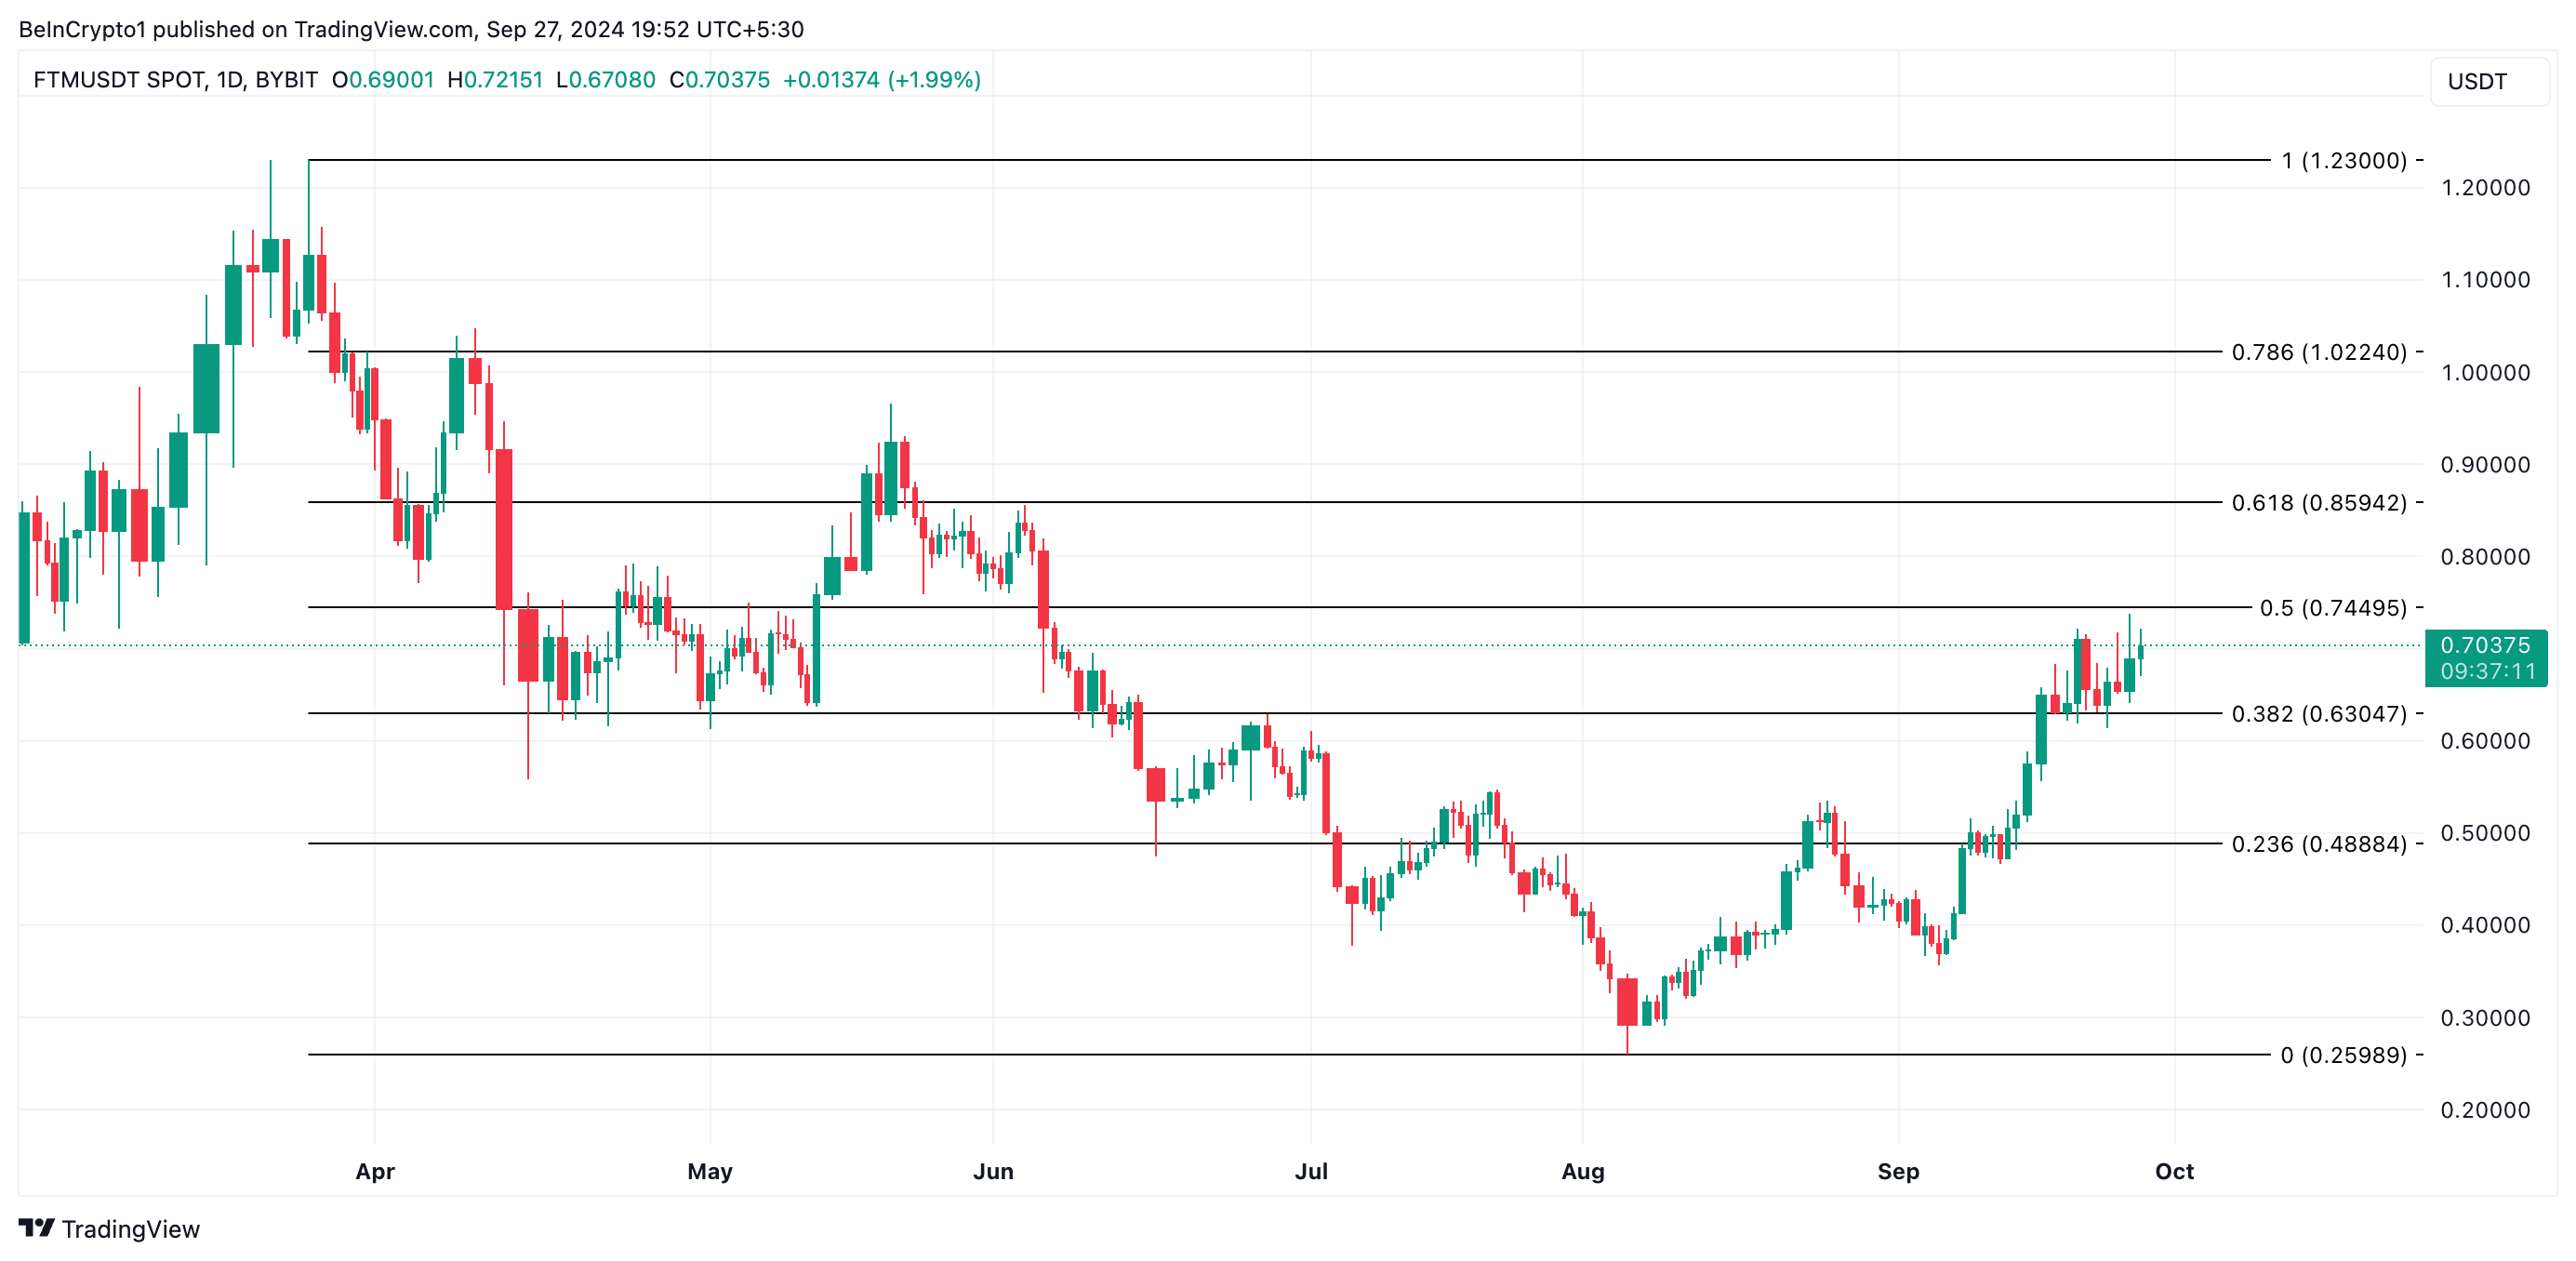
As excitement builds for the mainnet launch, FTM’s price could climb to $1.02, potentially paving the way for it to reach a five-month high of $1.23.
Disclaimer
In line with the Trust Project guidelines, this price analysis article is for informational purposes only and should not be considered financial or investment advice. BeInCrypto is committed to accurate, unbiased reporting, but market conditions are subject to change without notice. Always conduct your own research and consult with a professional before making any financial decisions. Please note that our Terms and Conditions, Privacy Policy, and Disclaimers have been updated.


Onchain data shows that RWA tokenization is bucking macroeconomic trends by growing remarkably while other crypto sectors face uncertainty and contractions. There is an increasing belief that these are some of the safest Web3 assets.
Several experts shared key insights into this remarkable growth with BeInCrypto.
How Can RWAs Change Crypto?
Real-world Assets (RWAs) are an important part of the crypto market for several reasons. For example, a report from Binance Research claims that they are the Web3 economy’s most tariff-resilient asset sector.
According to new data, RWAs are growing substantially, surpassing $20 billion on-chain with 12% growth in the last 30 days.
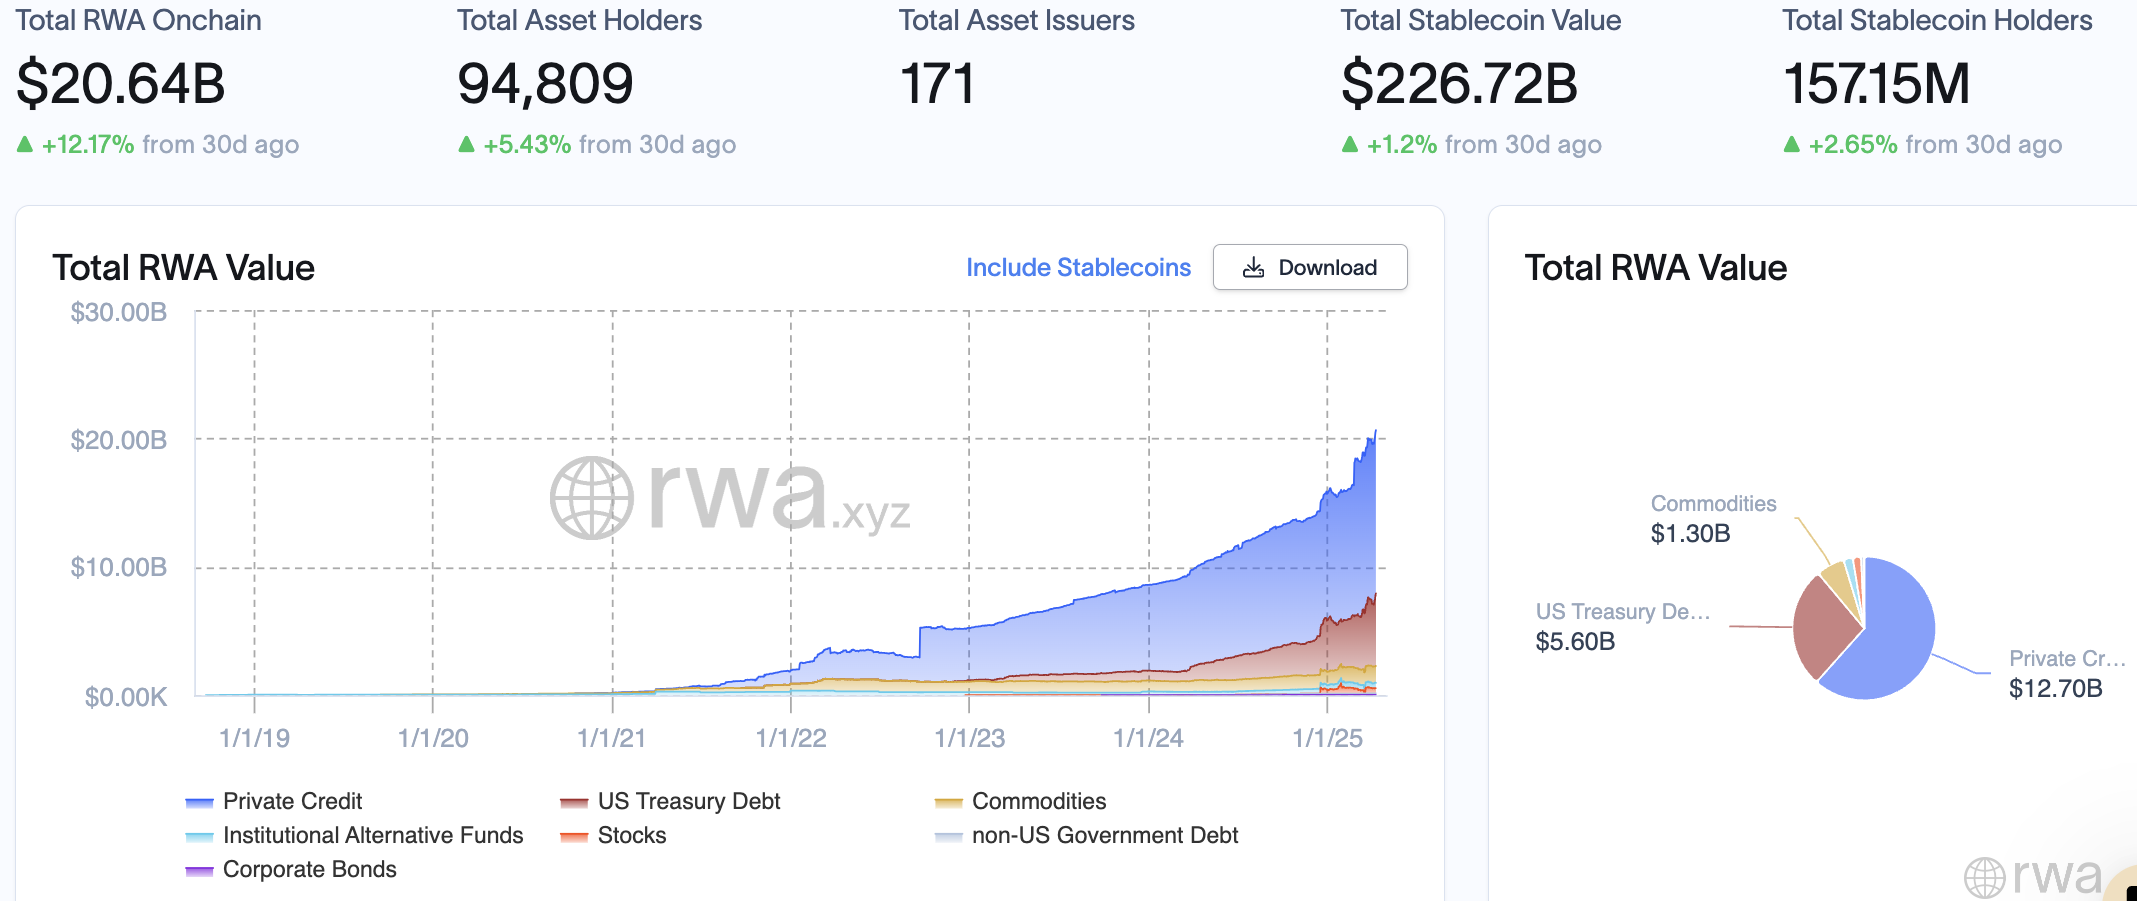
This data gives a few key insights that may be especially relevant in the near future. Importantly, while most of the crypto market is retreating under macroeconomic concerns, the RWA sector is on the rise.
Over the past month, Trump’s on-and-off tariff chaos and inflation fears have injected extreme volatility into the crypto market. Altcoins like Ethereum and XRP have lost over 10% on the monthly chart, but daily volatility has been much worse.
However, major RWA tokens, like Chainlink, Mantra, and ONDO, either remained comparatively stable or had positive positive gains during this period.
Kevin Rusher, founder of RWA lending platform RAAC, remarked on these dynamics in an exclusive commentary shared with BeInCrypto.
“The tokenized RWA market crossing $20 billion in this market is a strong signal. First, it is the only sector in crypto still reaching new ATHs while most are far from their highest levels and suffering heavy losses. Secondly, it shows that it’s not only hype anymore. Institutions are not just talking about it; they are actively tokenizing Real World Assets now,” Rusher said.
Rusher’s comments about institutional RWA investment are clearly visible in the crypto market. On April 7, MANTRA’s OM token held onto value despite broad-sector losses, as it announced a $108 million RWA fund.
Major institutional investors like BlackRock and Fidelity have also increased their RWA commitments.
Rusher went on to state that RWAs are especially attractive because of their stability. Although most of the crypto market is highly susceptible to volatility, RWAs are “building actual infrastructure with long-term value” and generating liquidity.
Tracy Jin, COO of crypto exchange MEXC, also echoed these sentiments:
“Historically, during seasons of liquidity crunch, investors seek refuge in more traditional stable assets like treasuries or cash. However, this time, the geopolitical turbulence has also triggered a sell-off in treasuries. With tokenized gold approaching a $2 billion market cap and tokenized treasuries seeing an 8.7% increase over the past 7 days, these assets continue to build market momentum at the heart of the general market slump,” Jin stated.
Overall, the capital flowing into the RWA ecosystem amid the financial market storm is a positive indicator for the broader crypto space. These funds could even encourage investors to increase their crypto exposure after the market settles. For these reasons, the RWA space has a lot of immediate potential.
Disclaimer
In adherence to the Trust Project guidelines, BeInCrypto is committed to unbiased, transparent reporting. This news article aims to provide accurate, timely information. However, readers are advised to verify facts independently and consult with a professional before making any decisions based on this content. Please note that our Terms and Conditions, Privacy Policy, and Disclaimers have been updated.

Welcome to the US Morning Crypto Briefing—your essential rundown of the most important developments in crypto for the day ahead.
Grab a coffee to see how investors in emerging markets are doubling down on digital assets and tokenized alternatives as the US dollar falters and inflation risks rise.
Investors Turn To Crypto, Gold Amid Imminent Challenging Economy for the US
Escalated trade war chaos and abounding recession concerns, these narratives have put the status of the US as a haven in question while exacerbating volatility in financial markets.
Now, headlines in Washington are focused on escalating trade tensions, making US crypto news a key market driver. According to Raafi Housain, CEO of digital asset platform Fasset, trading volume has surged internationally for particular assets.
“While US tariff headlines have dominated the macro conversation, in emerging markets we’re seeing a more nuanced response. In countries like Indonesia and Pakistan, trading activity on Fasset has more than doubled this week — partly as users return from Eid, but also due to growing demand for assets that feel resilient amid uncertainty,” Housain told BeInCrypto.
This suggests that perceptive investors are rethinking their strategies and repurposing their portfolios. Specifically, they are looking to new avenues, such as emerging markets, where access to traditional assets has historically been limited.
“Crypto is leading that surge, but we’re also seeing increased appetite for tokenized gold and, interestingly, US equities,” he added.
This portfolio diversification effort is unsurprising, considering US President Donald Trump’s tariff agenda is triggering global market volatility.
Already, macroeconomic signals are darkening despite the Federal Reserve’s (Fed) current inflation figures not fully reflecting the impact of ongoing tariffs.
Economists are sounding the alarm, with Moody’s Analytics chief economist Mark Zandi warning of inflationary pressures by summer.
“…inflation statistics will look pretty ugly by mid-summer if the current trade policies remain in place,” Zandi stated.
Zandi did not rule out the possibility of a recession, with his sentiment coming despite President Donald Trump’s 90-day pause on all reciprocal tariffs, but for China.
This warning aligns with China’s assertion that retaliatory tariffs on US goods lack competitiveness under current tariffs. Recognizing that tariffs are effectively a tax on imports paid by US businesses, Zandi added that these costs are usually passed on to consumers.
Meanwhile, as the investment scope shifts for well-informed investors, Housain notes adaptation, not panic.
“It’s clear that investors in high-growth markets aren’t retreating; they’re recalibrating — seeking diversification and more control in an unpredictable environment,” Housain explained.
Elsewhere, the dollar index (DXY) is dipping against a progressively rising cost of goods. Against this backdrop, crypto, tokenized commodities, and digital access to US equities are the hedges of choice for now.
Chart of the Day
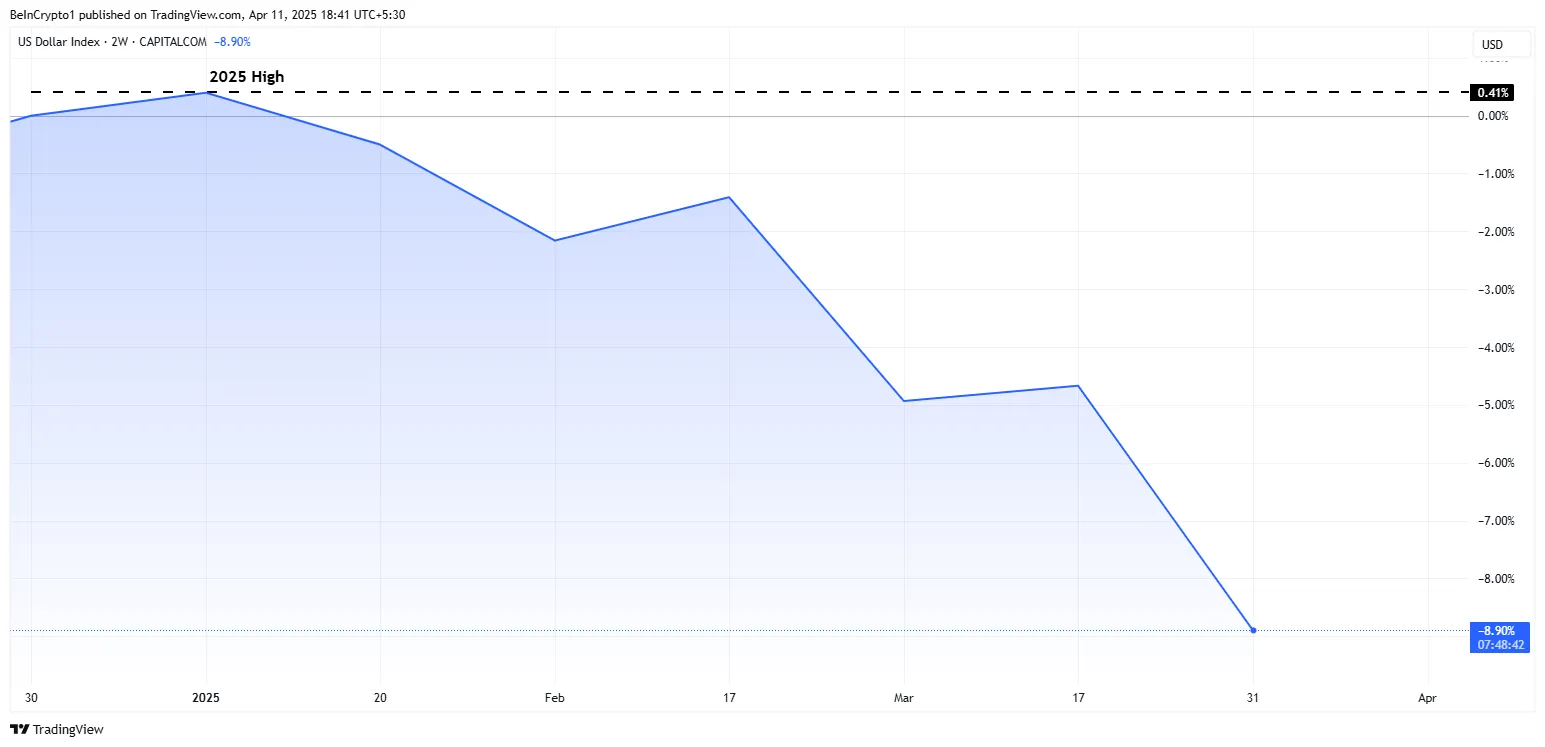
Data on TradingView shows the DXY is down by nearly 10% year-to-date (YTD), from the January 13 intra-day high of $109.87 to $99.04 as of this writing.
Byte-Sized Alpha
Crypto Equities Pre-Market Overview
| Company | Market open |
| Strategy (MSTR) | $284.26 (+5.98%) |
| Coinbase Global (COIN): | $171.09 (+1.22%) |
| Galaxy Digital Holdings (GLXY) | $14.29 (+3.97%) |
| MARA Holdings (MARA) | $11.94 (+7.10%) |
| Riot Platforms (RIOT) | $6.85 (+4.41%) |
| Core Scientific (CORZ) | $6.75 (1.91%) |
Disclaimer
In adherence to the Trust Project guidelines, BeInCrypto is committed to unbiased, transparent reporting. This news article aims to provide accurate, timely information. However, readers are advised to verify facts independently and consult with a professional before making any decisions based on this content. Please note that our Terms and Conditions, Privacy Policy, and Disclaimers have been updated.

The crypto market’s “altcoin season” isn’t what it used to be. In past cycles, Bitcoin rallies gave way to altcoin booms, lifting almost every token. Now, new market trends suggest those days of indiscriminate gains are fading.
Analysts predict a more selective altcoin cycle – “the era of everything pumping is over.” In an interview with BeInCrypto, Hitesh Malviya, the founder of the crypto analytical tool DYOR, said that retail investors looking for the next big winner must adapt to these evolving trends.
How to Find Winning Altcoins Amidst Choppy Markets
Traditionally, altcoin season meant Bitcoin’s dominance fell, and most altcoins surged. That broad rally may be ending.
“If the idea of a full-blown alt season comes from past cycles, then that’s something I really don’t expect. What we have seen so far in altcoins was simply the blooming and bursting of a bubble that happened over two bull cycles and two bear cycles,” Malviya told BeInCrypto.
Market experts foresee a more nuanced phase where only the strongest projects thrive. In short, instead of a rising tide lifting all boats, the next altcoin season may favor quality (projects with real usage and revenue) over quantity.
Investors should focus on fundamentals like usage, revenue, and community growth—the market now rewards substance over hype. Indeed, interest in speculative sectors such as meme coins has drastically declined since late January 2025.
“The adoption curve will take a new shape upwards, while the speculative curve will lose its charm, introducing lower volatility in the market, providing more stable returns, and making the market less correlated to stocks. This will create a new asset class in crypto, which should have two major types of asset offerings—tokenized equities with strong cash flow (e.g., AAVE) and store-of-value assets (BTC, ETH),” Malviya continued.

A key reason for the evolution of the altcoin season is that liquidity now rotates between different narratives.
Liquidity flows toward compelling stories. There have been mini-cycles where certain themes catch fire – meme coins, AI tokens, DeFi projects, metaverse gaming, etc. Money chases one hot narrative, then moves to the next.
Savvy investors watch social media, developer activity, and news to catch emerging narratives early and get in before the crowd.
“Liquidity will always flow into different narratives at different times, as there are multiple categories within crypto—just like in stocks, where some categories always outperform others. The same market dynamics will be seen in crypto as well,” Malviya stated.
How to Find Potential Altcoin Season Winner? Identifying Strength in Downtrends
Malviya believes that investors should watch for altcoins showing relative strength during downturns. If an altcoin can hold its value or even rise while Bitcoin slides, that resilience signals strong demand (likely early accumulation).
“At DYOR, we offer a metric called Optimised Relative Strength, which helps track some of the best coins and narratives that have shown the highest strength in the past 7, 30 and 90 days. Coins that have outperformed against the broader market in the past 30 days have a great chance of rallying when the market finds a bottom and starts a fresh leg up,” Malviya explained.

Moreover, Malviya also discussed other fundamental metrics to track. These include:
- DEX Volume: Rising trading volumes on decentralized exchanges can push the native token’s prices higher.
- Total Value Locked (TVL): Growth in deposits and total value locked implies user trust – bullish for the lending protocol’s token.
- Derivatives Volume: Increasing on-chain trading activity means more traders and fees supporting its token.
- Oracle Total Value Secured (TVS): Climbing total value secured by an oracle (e.g., Chainlink) shows a greater reliance on it, boosting token demand.
- DePIN Revenue: Actual revenue from a DePIN project (real-world service) signals a sustainable model, not just hype.
Furthermore, Malviya also emphasized the tokenomics of a crypto project. He believes that even a great project can falter if its tokenomics are flawed.
Tokenomics – a token’s supply and incentive design can make or break an altcoin. Good tokenomics (fair distribution, strong utility) create lasting demand, whereas poor tokenomics (excessive inflation or constant insider unlocks) often doom a project.
“Ideally, the community and ecosystem fund should get at least 60% of the supply to generate actual demand for the product by incentivizing developers and users through planned token emissions at different stages. Tokens are actually created to drive real user demand for the product. They can be considered as bribes to get user attention, but since these bribes are also tradable in the market, they can create a ripple effect that could potentially lead to the product’s failure. This happens because retail sentiment often mixes both the product and the token, where, in most cases, the token price eventually determines how much adoption the product gets,” Malviya elaborated.
Lastly, he shares tools that can help users potentially find the next winner for the altcoin season.
- DYOR – Users can use DYOR to find relative strength data on more than 200+ coins, detailed demand-side tokenomics data on 70+ coins, and fundamental data on 65+ coins, along with detailed research reports on top projects.
- DeFiLlama – It tracks multi-chain DeFi data like TVL and volumes.
- Dune Analytics – It is a community-driven platform offering custom on-chain data dashboards.
“The community should learn to use DeFiLlama and DUNE dashboards to uncover some interesting alphas. Most on-chain data is tracked on both of these platforms—all you need to do is find the right dashboard, take notes of the different growth metrics you notice, and build your thesis around a coin using that data to reach better due diligence,” Malviya concluded.
Those armed with solid research stand the best chance of catching the next altcoin season winner.
Disclaimer
In adherence to the Trust Project guidelines, BeInCrypto is committed to unbiased, transparent reporting. This news article aims to provide accurate, timely information. However, readers are advised to verify facts independently and consult with a professional before making any decisions based on this content. Please note that our Terms and Conditions, Privacy Policy, and Disclaimers have been updated.

Is It the Safest Crypto Sector?
Investors Shift to Crypto, Gold, and Equities Amid Tariff Volatility

How You Can Find Altcoin Winners Early

Binance, Trade Wars, Ripple and SEC

China Raises Tariffs on US to 125%, Crypto Markets Steady

Is Bitcoin Ready for Another Surge?

2.52 Million Altcoins Are Ruining Crypto’s Future

Animoca Brands Valuation Tanks 75% In Two Years, Here’s Why

Crypto exchange BingX hacked for $43 million

Are The Big Players Losing Interest?

Hong Kong’s Securities Association Tips Authorities On Crypto Self-Regulation

Coinbase cbBTC Set to go Live on Solana
2.52 Million Altcoins Are Ruining Crypto’s Future
Animoca Brands Valuation Tanks 75% In Two Years, Here’s Why
Crypto exchange BingX hacked for $43 million
Are The Big Players Losing Interest?
Hong Kong’s Securities Association Tips Authorities On Crypto Self-Regulation
Coinbase cbBTC Set to go Live on Solana
-

 Bitcoin24 hours ago
Florida Bitcoin Reserve Bill Passes House With Zero Votes Against
-

 Market21 hours ago
ADA Price Surge Signals a Potential Breakout
-

 Market24 hours ago
Fuser on How Crypto Regulation in Europe is Finally Catching Up
-
 Altcoin23 hours ago
Dogecoin (DOGE) Reclaims Previous Breakdown, Will This Mark The Bottom?
-

 Market23 hours ago
3 Bullish Altcoins Surging After Trump’s Tariff Pause
-
 Altcoin12 hours ago
XRP Price Risks 40% Drop to $1.20 If It Doesn’t Regain This Level
-

 Bitcoin21 hours ago
Bitcoin Holders are More Profitable Than Ethereum Since 2023
-

 Market10 hours ago
XRP Price Ready to Run? Bulls Eyes Fresh Gains Amid Bullish Setup