
Market
Altcoins to Watch in October 2024: 3 Underrated Gems

October is historically a bullish month for the crypto market. Because of this, investors might be on the lookout for hidden gem altcoins that could bring significant gains.
These lesser-known cryptocurrencies sometimes have strong fundamentals and increasing community support, which could make them worth monitoring. As such, this analysis uncovers three under-the-radar altcoins that show promising signs of a major pump in October.
Echelon Prime (PRIME)
PRIME, the native token of the decentralized finance and gaming web3 project, tops this list of altcoins. One reason for its inclusion is the assertion that gaming tokens could be one of the trending narratives next month and throughout the rest of the year.
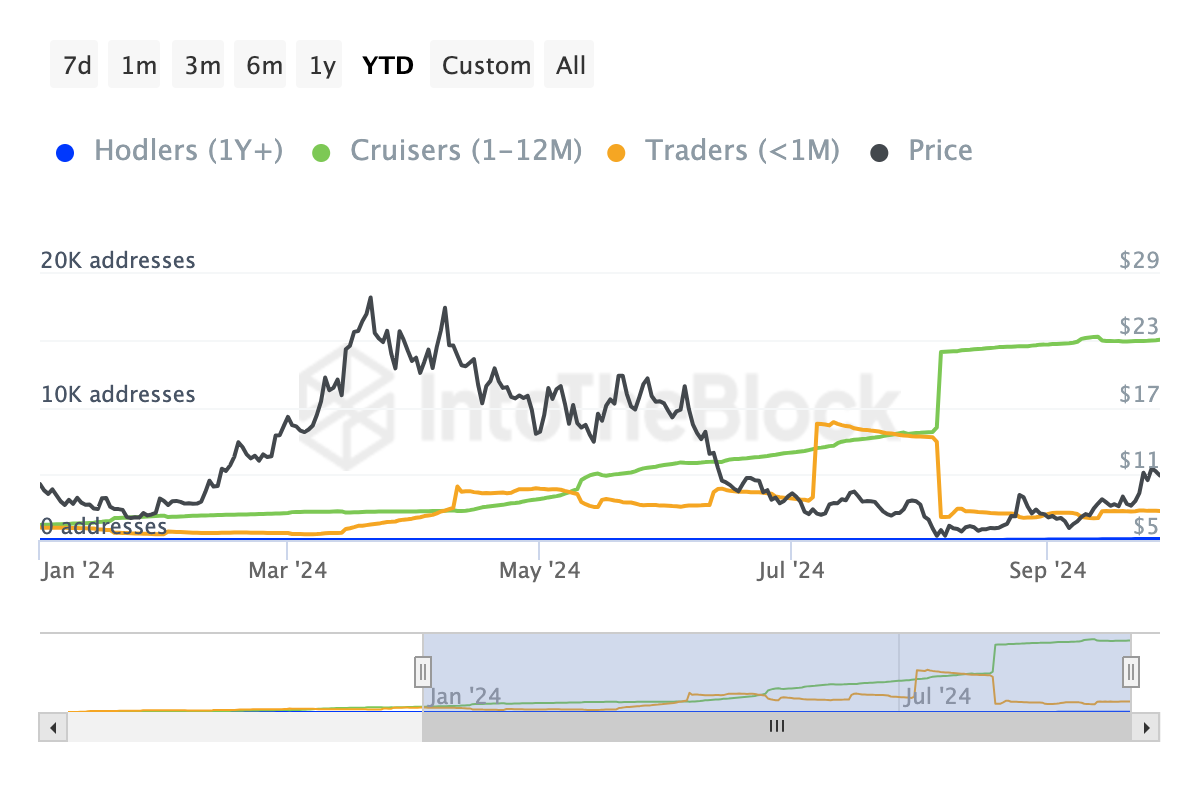
Built on the Ethereum blockchain, PRIME’s price has increased by 35.39% in the last 30 days, with the most gains coming from the recent token unlock.
Furthermore, a look at the addresses by time held shows that many investors who have owned the token within the last month through the last 365 days have refrained from selling it. Thus, this suggests a high conviction in its short to long-term potential and that PRIME might not undergo a major price correction.
On the daily chart, PRIME’s prime jumped above $12 on September 28. This surge could be attributed to the breakout from the descending triangle, which is due to the formation of lower highs and a horizontal support level.
PRIME’s price has decreased to $10.20. However, the Money Flow Index (MFI) reveals that substantial capital is still flowing into the altcoins. As a result, a major rebound could occur from its current price.
Read more: 5 Best Crypto Payment Gateways Every Business Should Know
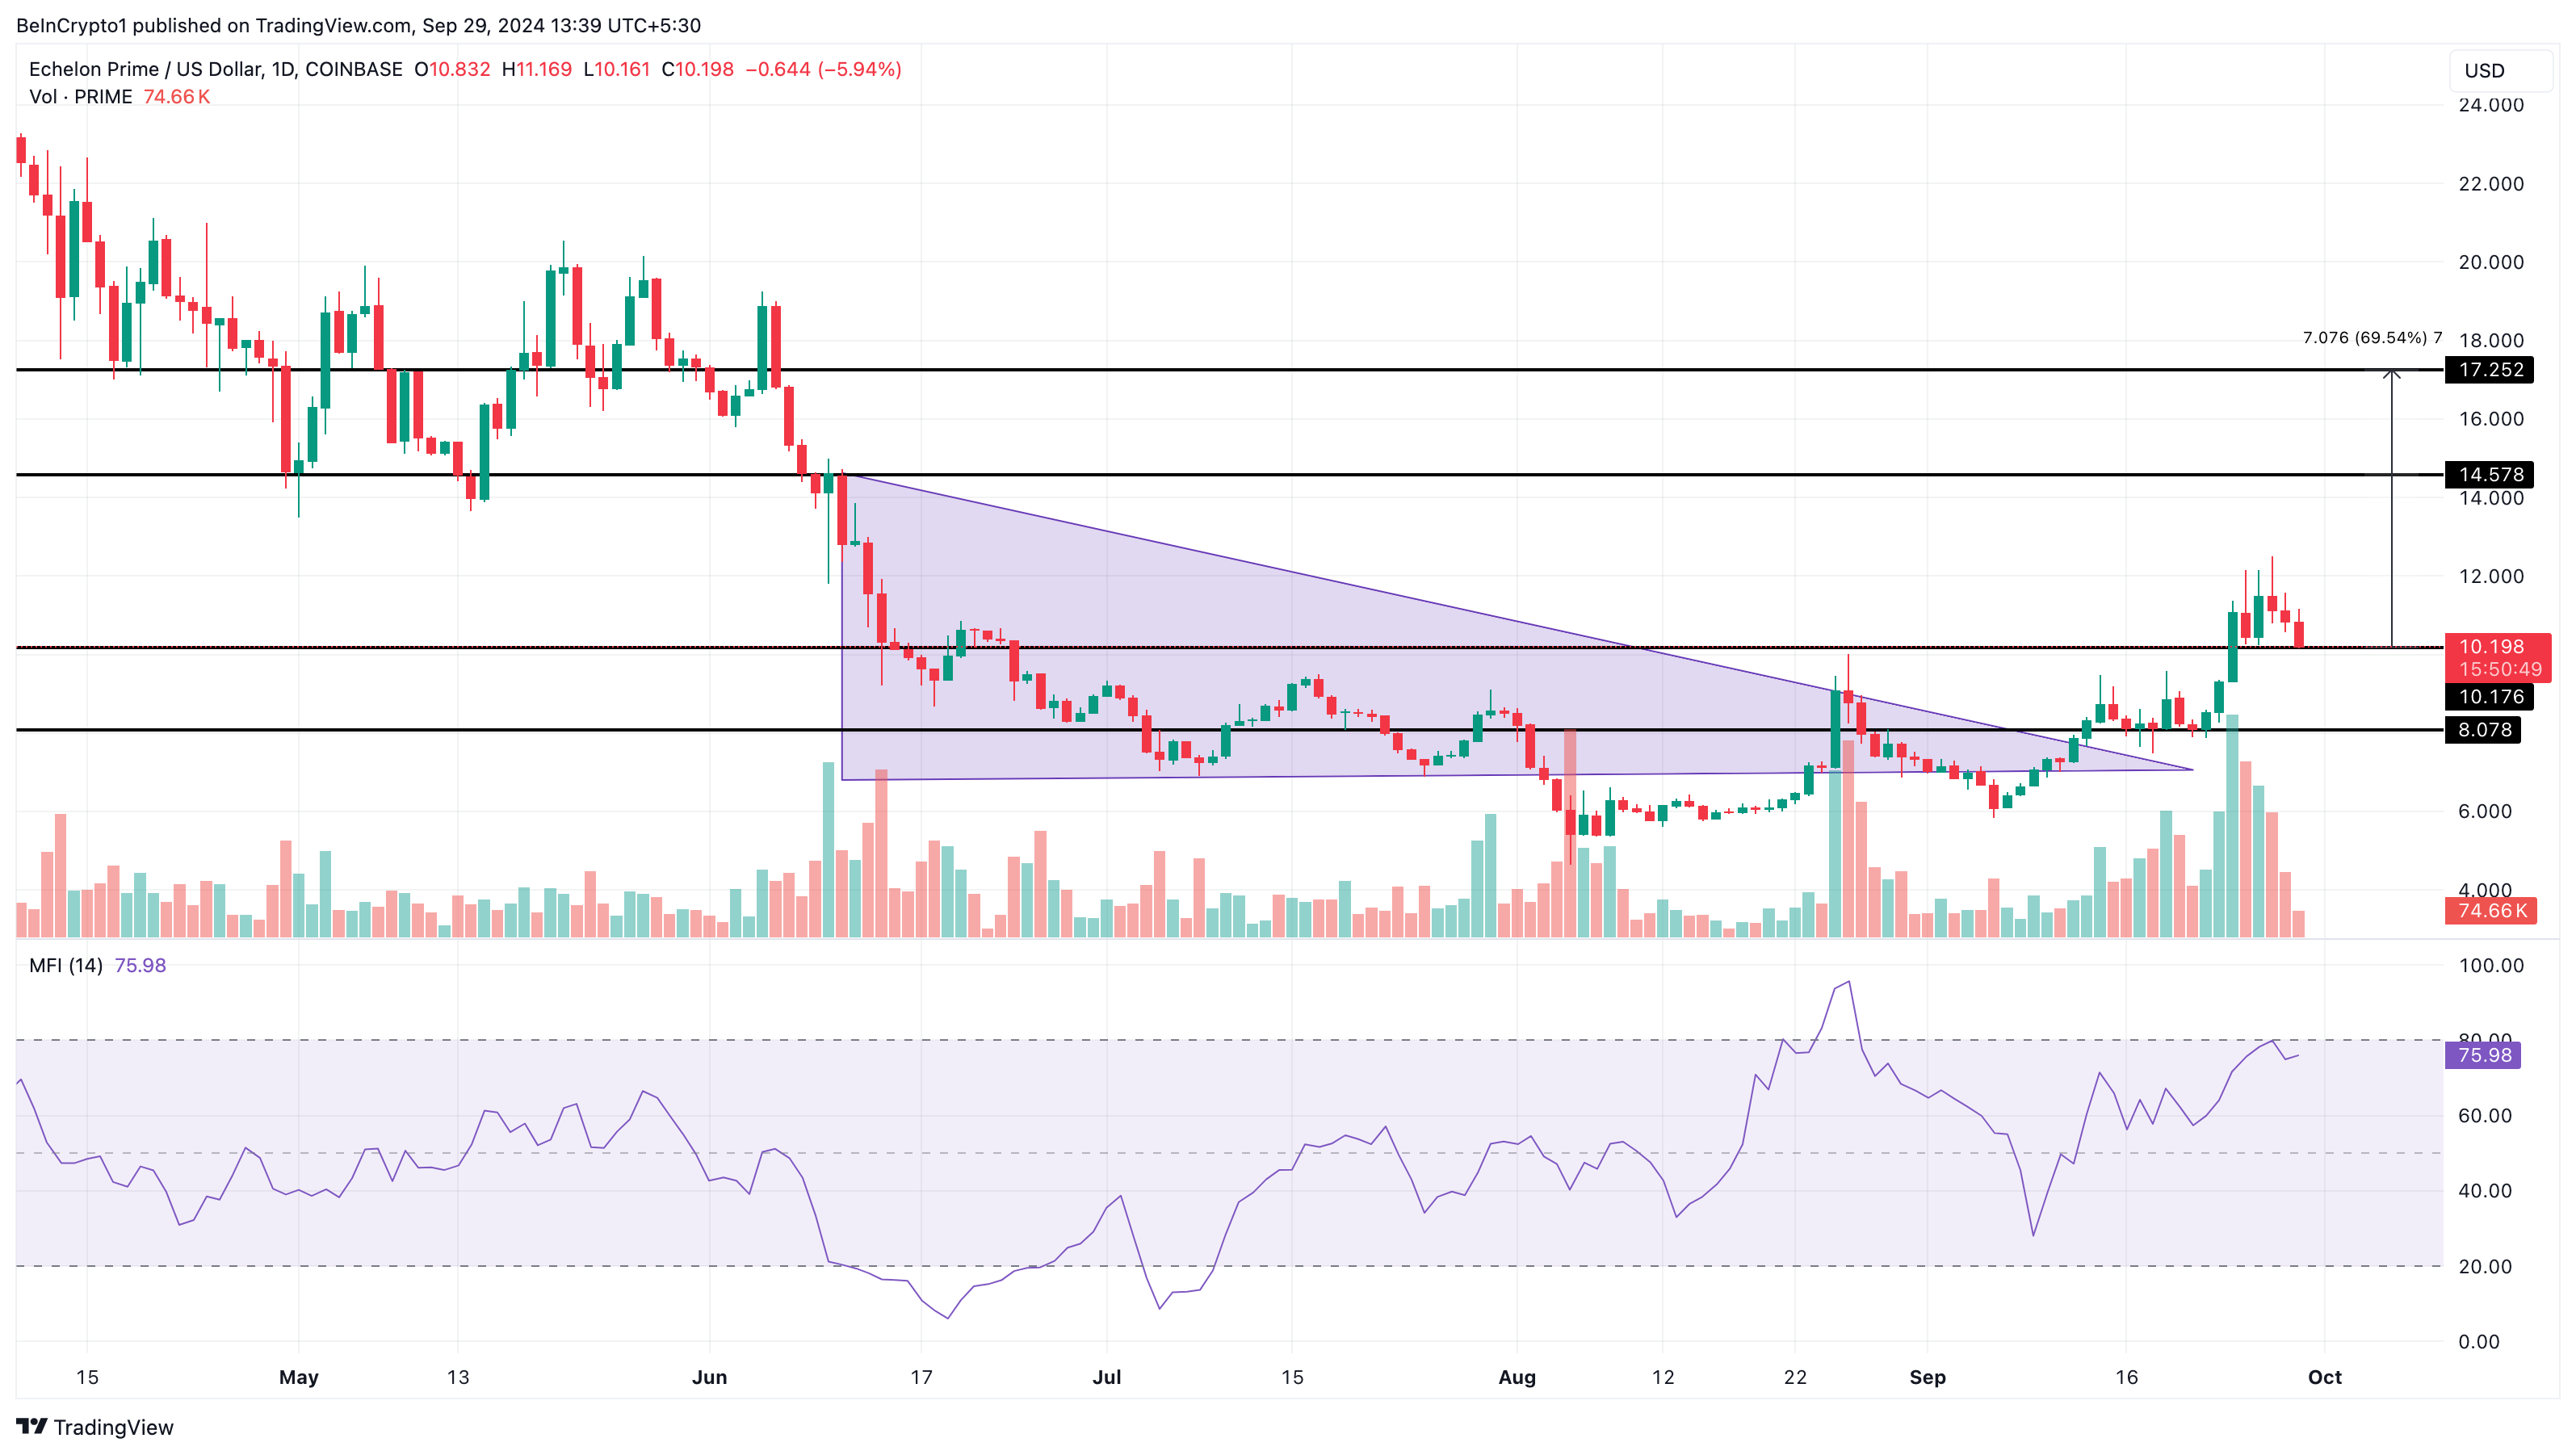
If that happens, PRIME’s value might surge by 70% in October, potentially reaching $17.25 before the month ends. On the other hand, the altcoin’s price might face a notable downturn if it drops below $10.17. In that scenario, the price could fall to $8.07.
Celo (CELO)
Celo is ranked the 159th most valuable crypto in terms of market capitalization. It is built on Ethereum and focuses on real-world stablecoin utility. On September 25, Ethereum co-founder Vitalik Buterin applauded Celo for surpassing Tron in terms of stablecoin activity.
This development implied improved user engagement on the Ethereum layer-2 project. Apart from that, digital asset management firm Grayscale added CELO to the list of altcoins, which it expects to perform well during this year’s last quarter.
Based on the daily chart, CELO’s price climbed over 50% in less than two weeks after the formation of an inverse head and shoulder pattern. This technical pattern is a bearish-to-bullish reversal, which usually brings about a staggering price increase.
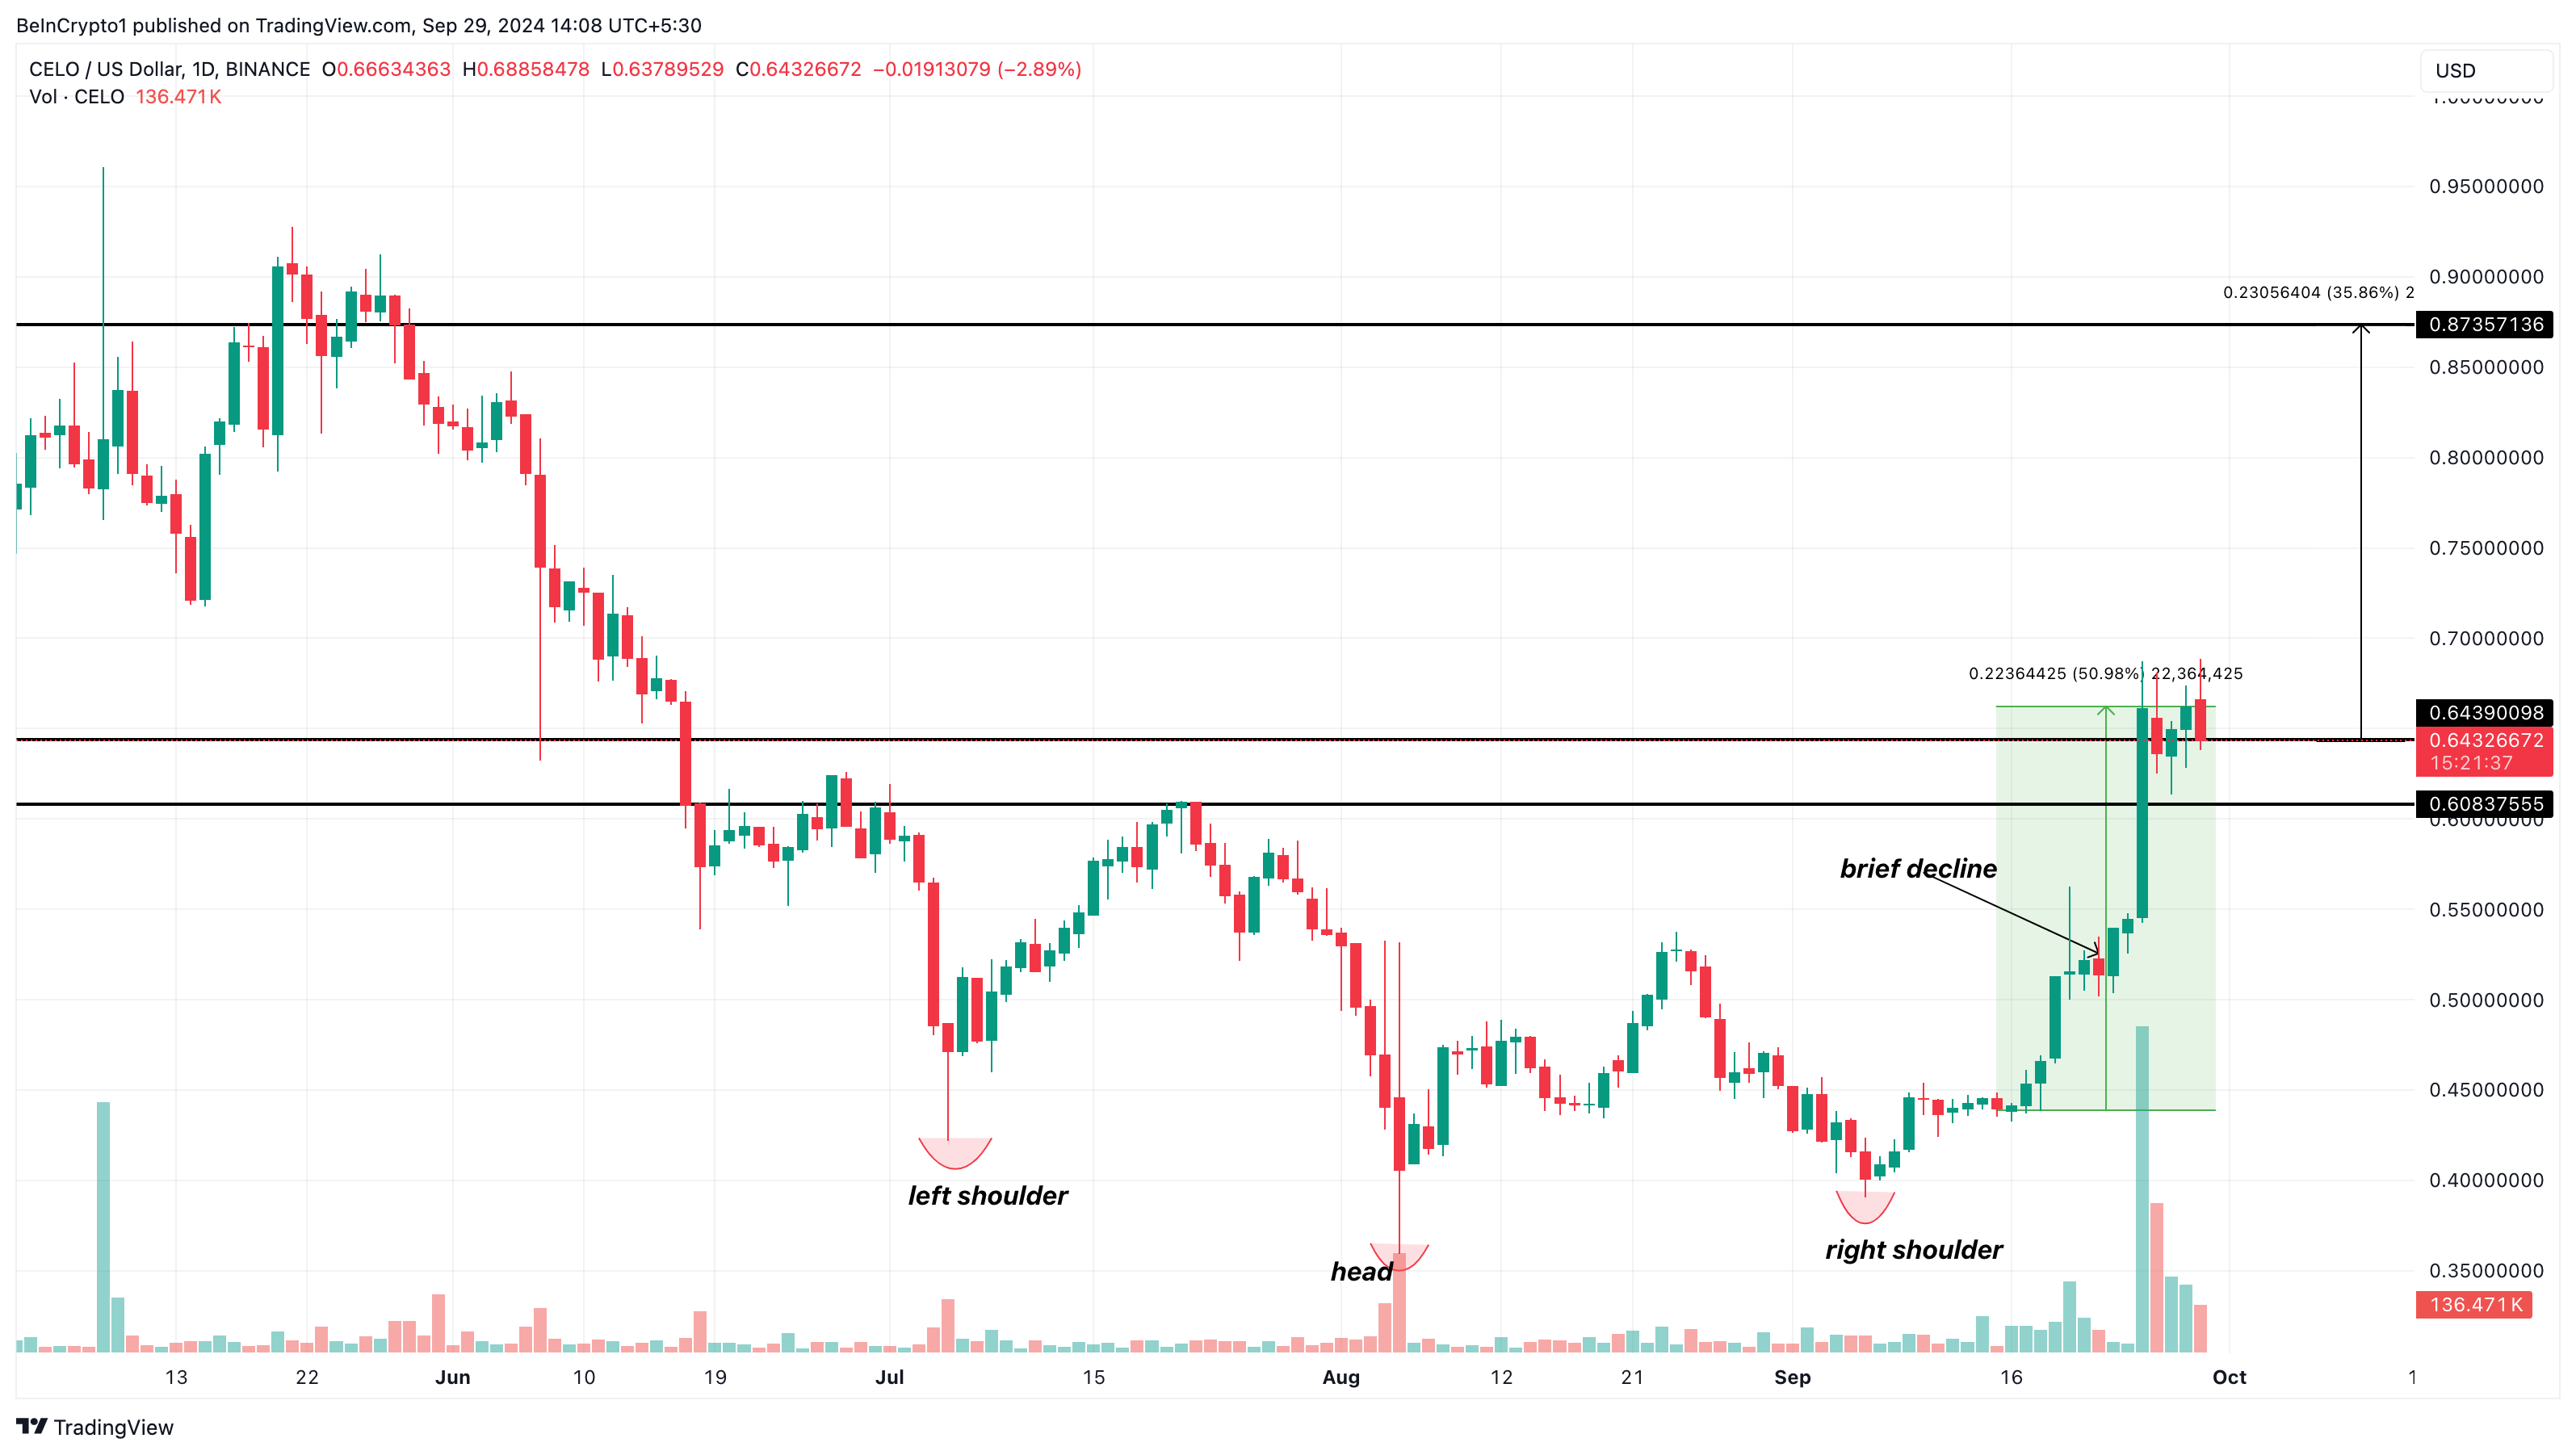
As of this writing, CELO’s price is 0.64. However, as it happened during the uptrend, this decline could be a brief drawdown, and a rebound might likely be likely in the coming days.
Once validated, CELO might increase by nearly 36% and hit $0.87 in October. However, if CELO’s price slips below $0.60, it might end the month in a net negative.
Aethir (ATH)
As a Decentralized Physical Infrastructure Network (DePIN) project, Aethir (ATH) enhances the distribution of AI chips. With its structure, the ATH is also a gaming token, reinforcing the notion that AI tokens, as well as gaming altcoins, could perform well in October.
Interestingly, ex-BitMEX CEO Arthur Hayes appears to share a similar value, especially after he dumped other altcoins for the token. Based on the daily chart, the 20-day Exponential Moving Average (EMA) — in blue has crossed over the 50 EMA (yellow) for the first time in a long while.
The EMA measures trend direction. When the longer EMA crosses above the shorter one, the trend is bearish. Therefore, the current situation (golden cross) with ATH trading at $0.065 means that the altcoin trend is bullish.
Read more: 10 Best Altcoin Exchanges In 2024
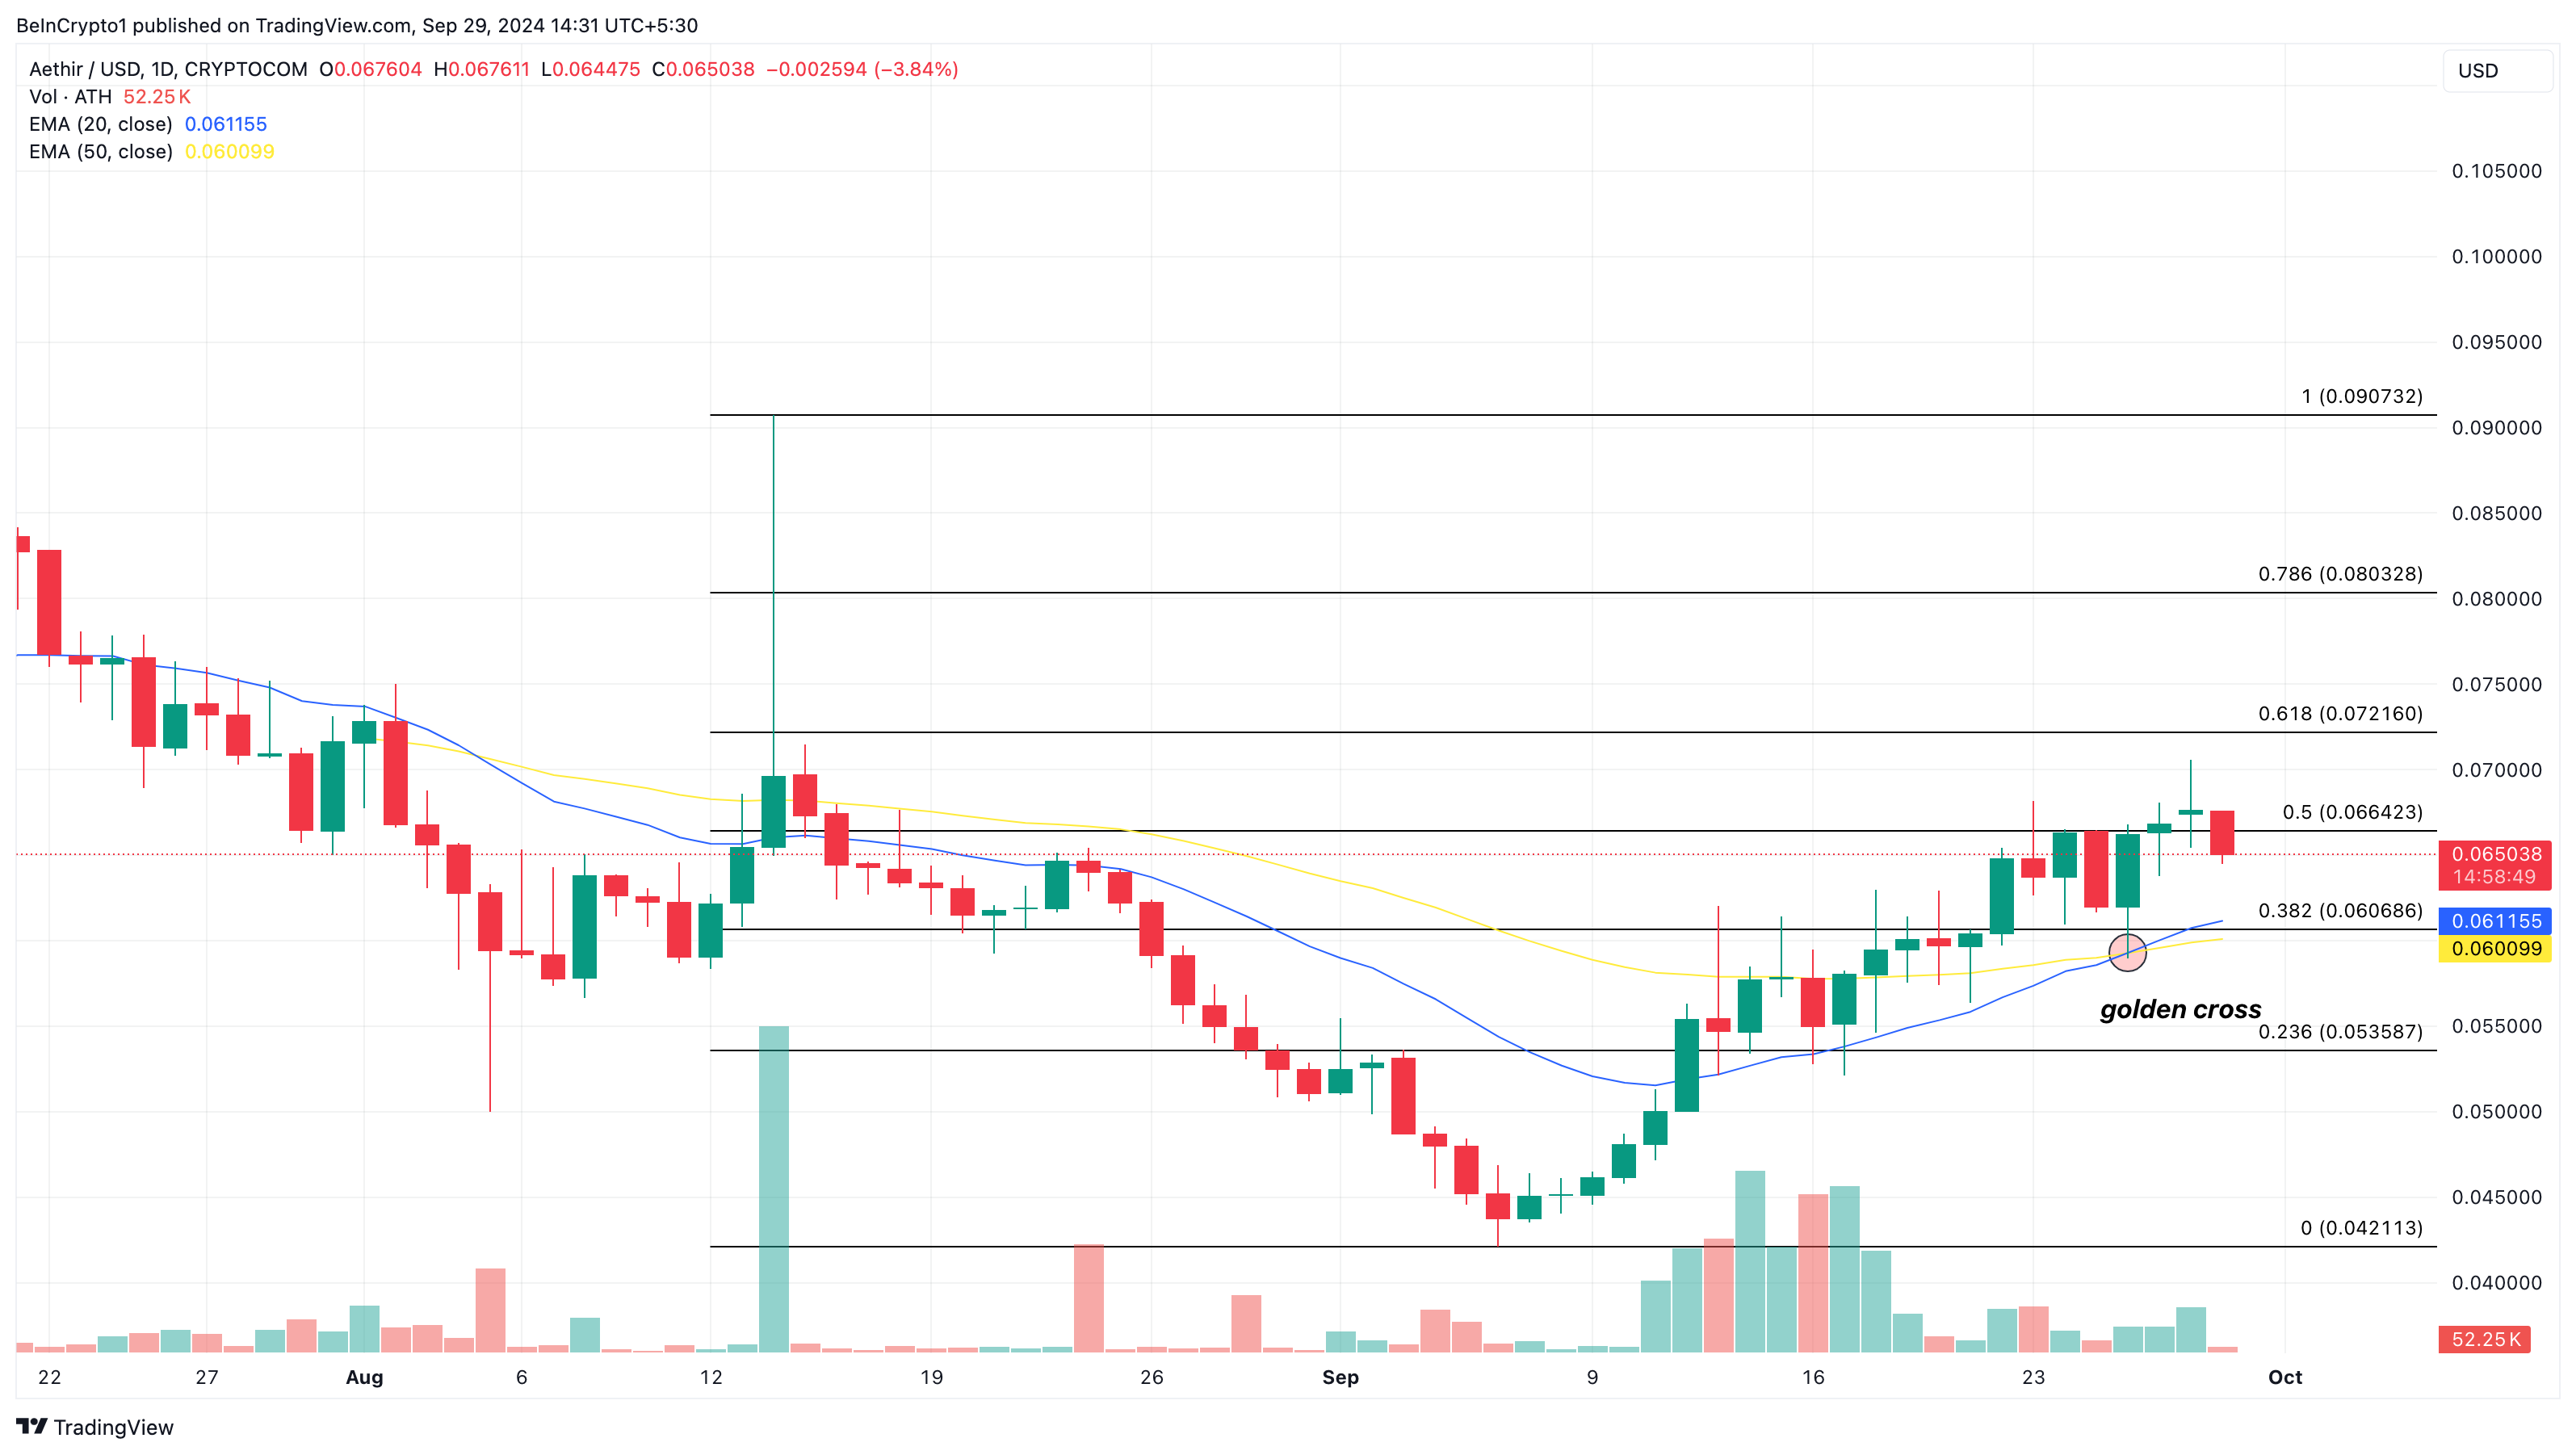
Despite a recent decline, the Golden Cross formation suggests that ATH’s price might return northward. If that happens, then ATH could rise toward $0.090 next month. On the flip side, Aethir’s price could decrease to $0.053 if the 50 EMA rises above the 20 EMA again, invalidating the bullish prediction.
Disclaimer
In line with the Trust Project guidelines, this price analysis article is for informational purposes only and should not be considered financial or investment advice. BeInCrypto is committed to accurate, unbiased reporting, but market conditions are subject to change without notice. Always conduct your own research and consult with a professional before making any financial decisions. Please note that our Terms and Conditions, Privacy Policy, and Disclaimers have been updated.


World Liberty Financial (WLFI), backed by the Trump family, announced a new governance proposal to test its airdrop system by distributing its USD1 stablecoin to WLFI token holders.
The move comes shortly after the decentralized finance (DeFi) project launched the stablecoin in late March.
World Liberty Financial Eyes USD1 Stablecoin Airdrop
WLFI’s initiative serves three primary goals. First, it seeks to validate the project’s technical infrastructure. Secondly, it serves as a reward mechanism for early supporters, and lastly, it aims to increase USD1’s visibility ahead of a broader rollout.
“Testing the airdrop mechanism in a live setting is a necessary step to ensure smart contract functionality and readiness. This distribution also serves as a meaningful way to thank our earliest supporters and introduce them to USD1,” the proposal read.
The airdrop will distribute a fixed amount of USD1—a stablecoin pegged to the US dollar and backed by assets like US Treasuries—to all eligible WLFI holders on the Ethereum (ETH) mainnet.
The exact amount per wallet will be determined based on the total number of eligible wallets and WLFI’s budget. In addition, the company reserves the right to modify or terminate the test at its discretion.
Interestingly, comments in the proposal reflect strong community support. The general consensus is likely in favor of a USD1 stablecoin airdrop.
“I believe it is a very valid proposal, which serves both to keep the community engaged and to test the network for implementation. Therefore, I believe it is a positive measure for both holders and the institution. Let’s go ahead, let’s design in order to build,” a user wrote.
The next step would include finalizing the details of the airdrop. Afterward, the proposal will proceed to a governance vote. The voting options will include “Yes” to approve the airdrop, “No” to reject it, and “Abstain” for those who wish not to vote. This process ensures transparency and community involvement in the decision-making process.
Meanwhile, the proposal emerges amid intensified scrutiny of the Trump family’s role in the cryptocurrency venture.
On April 2, Senator Elizabeth Warren and Representative Maxine Waters sent a letter to SEC acting chair Mark Uyeda. The lawmakers requested that the SEC preserve all records and communications related to World Liberty Financial.
They also requested access to information to clarify how the Trump family’s financial stake in WLFI might be influencing SEC operations. Additionally, they expressed concerns that this potential conflict of interest could undermine the SEC’s mission to protect investors and ensure fair, orderly markets.
“The Trump family’s financial stake in World Liberty Financial represents an unprecedented conflict of interest with the potential to influence the Trump Administration’s oversight—or lack thereof—of the cryptocurrency industry, creating an obvious incentive for the Trump Administration to direct federal agencies, including the SEC, to take positions favorable to cryptocurrency interests that directly benefit the President’s family,” the letter read.
Earlier, Senator Warren and five other democrats had sent a letter to the Federal Reserve and the OCC, raising similar concerns.
Disclaimer
In adherence to the Trust Project guidelines, BeInCrypto is committed to unbiased, transparent reporting. This news article aims to provide accurate, timely information. However, readers are advised to verify facts independently and consult with a professional before making any decisions based on this content. Please note that our Terms and Conditions, Privacy Policy, and Disclaimers have been updated.

Solana-based meme coin FARTCOIN is today’s talk of the town. The altcoin has outperformed broader market trends, recording a 28% gain over the past day.
While many assets struggle with declining prices and trading volumes amid recent market troubles, FARTCOIN has seen a surge in both, attracting significant buy orders.
FARTCOIN Defies Market Meltdown
FARTCOIN’s upward momentum is evident, driven by a sharp rise in trading volume. Reflecting on the meme coin’s recent trend, crypto trader “RookieXBT” noted in a March 7 post on X that FARTCOIN is seeing “increasing volume while the world falls apart,” adding that “no other coin is doing this.”
FARTCOIN’s trading volume totals $363 million as of this writing, rocketing over 80% in the past 24 hours.
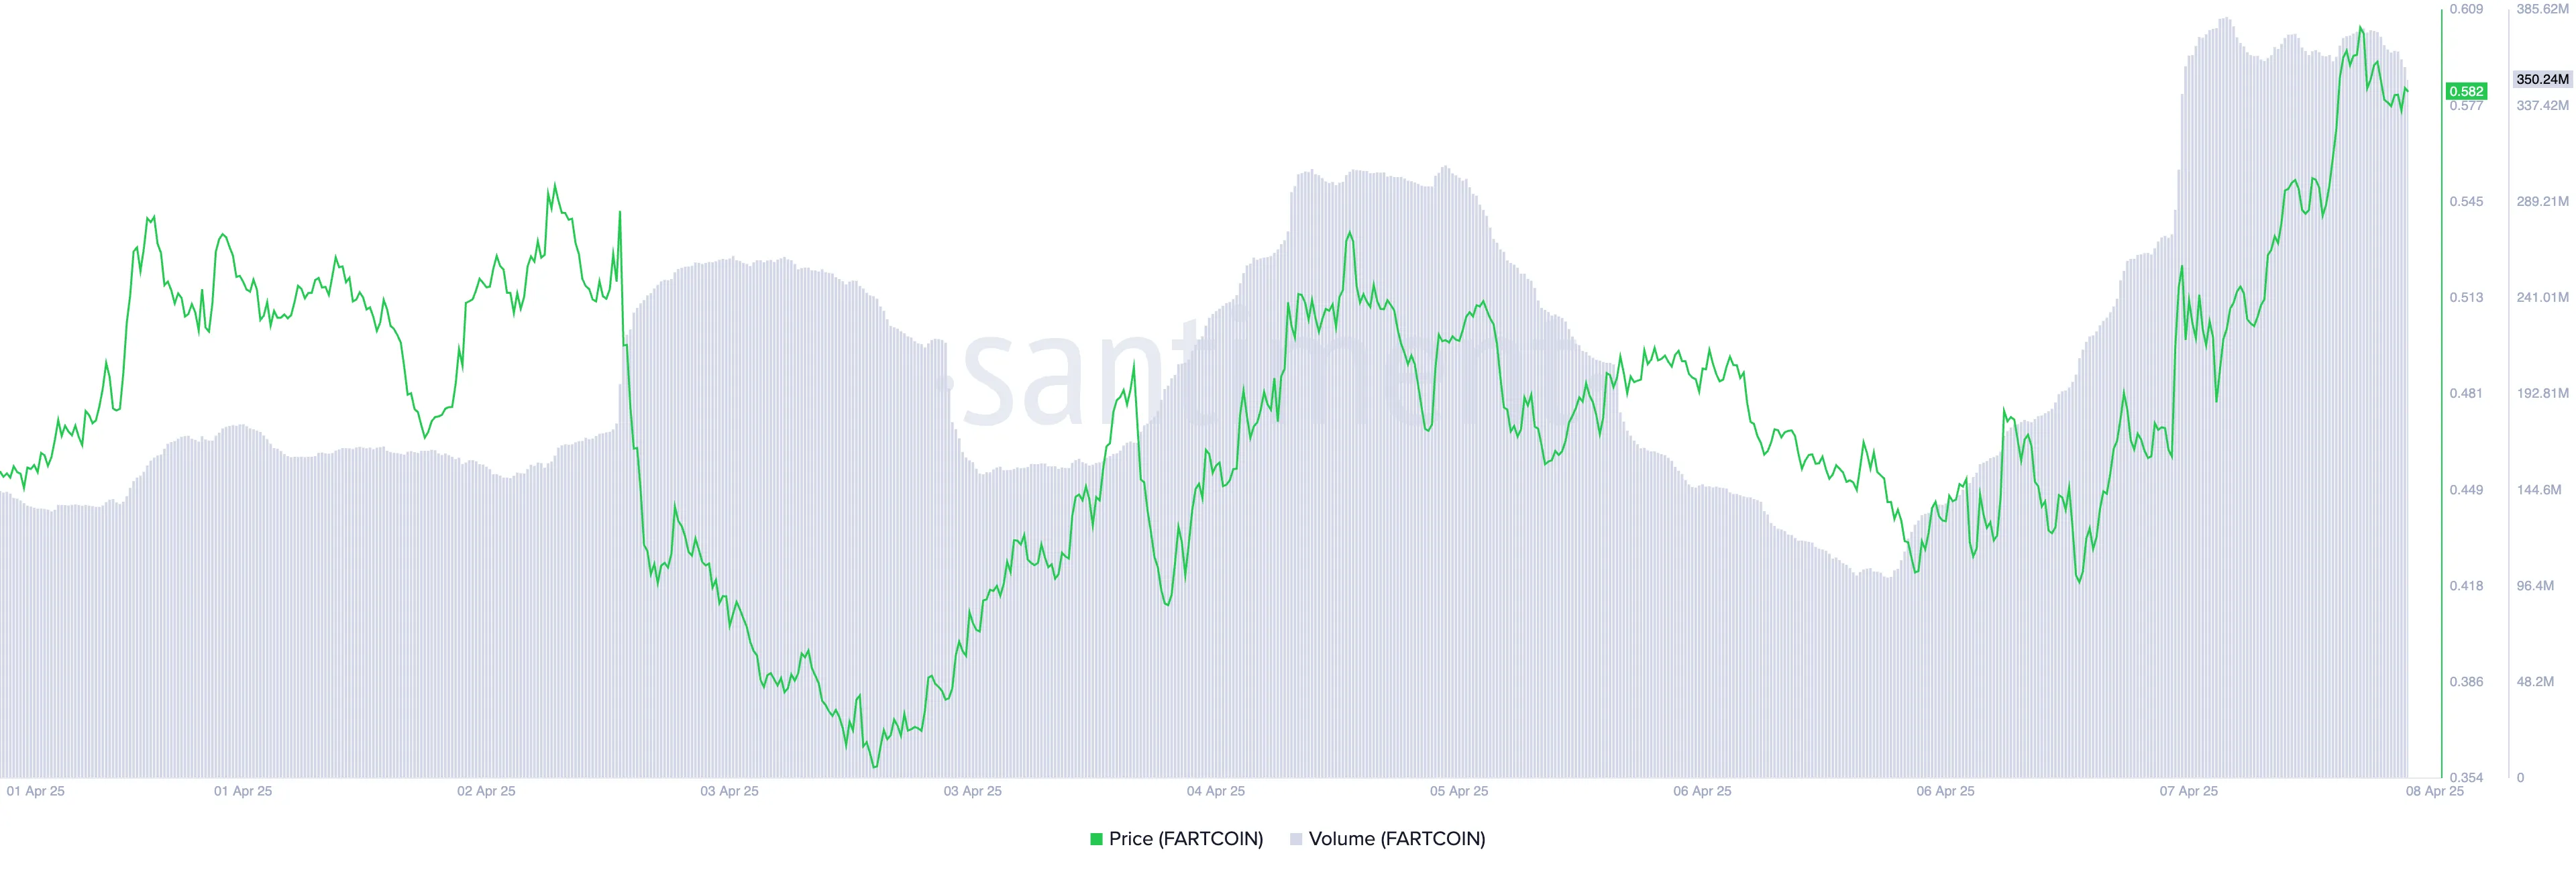
When an asset’s price rises alongside its trading volume, it signals strong market interest and conviction behind the price move.
FARTCOIN’s high trading volume confirms that widespread participation rather than isolated trades support its rally. This combination is a bullish signal, suggesting the uptrend may have the momentum to continue.
Further, the setup of the token’s Parabolic Stop and Reverse (SAR) indicator supports this bullish outlook. At press time, the dots of the momentum indicator rest below FARTCOIN’s price on the daily chart.
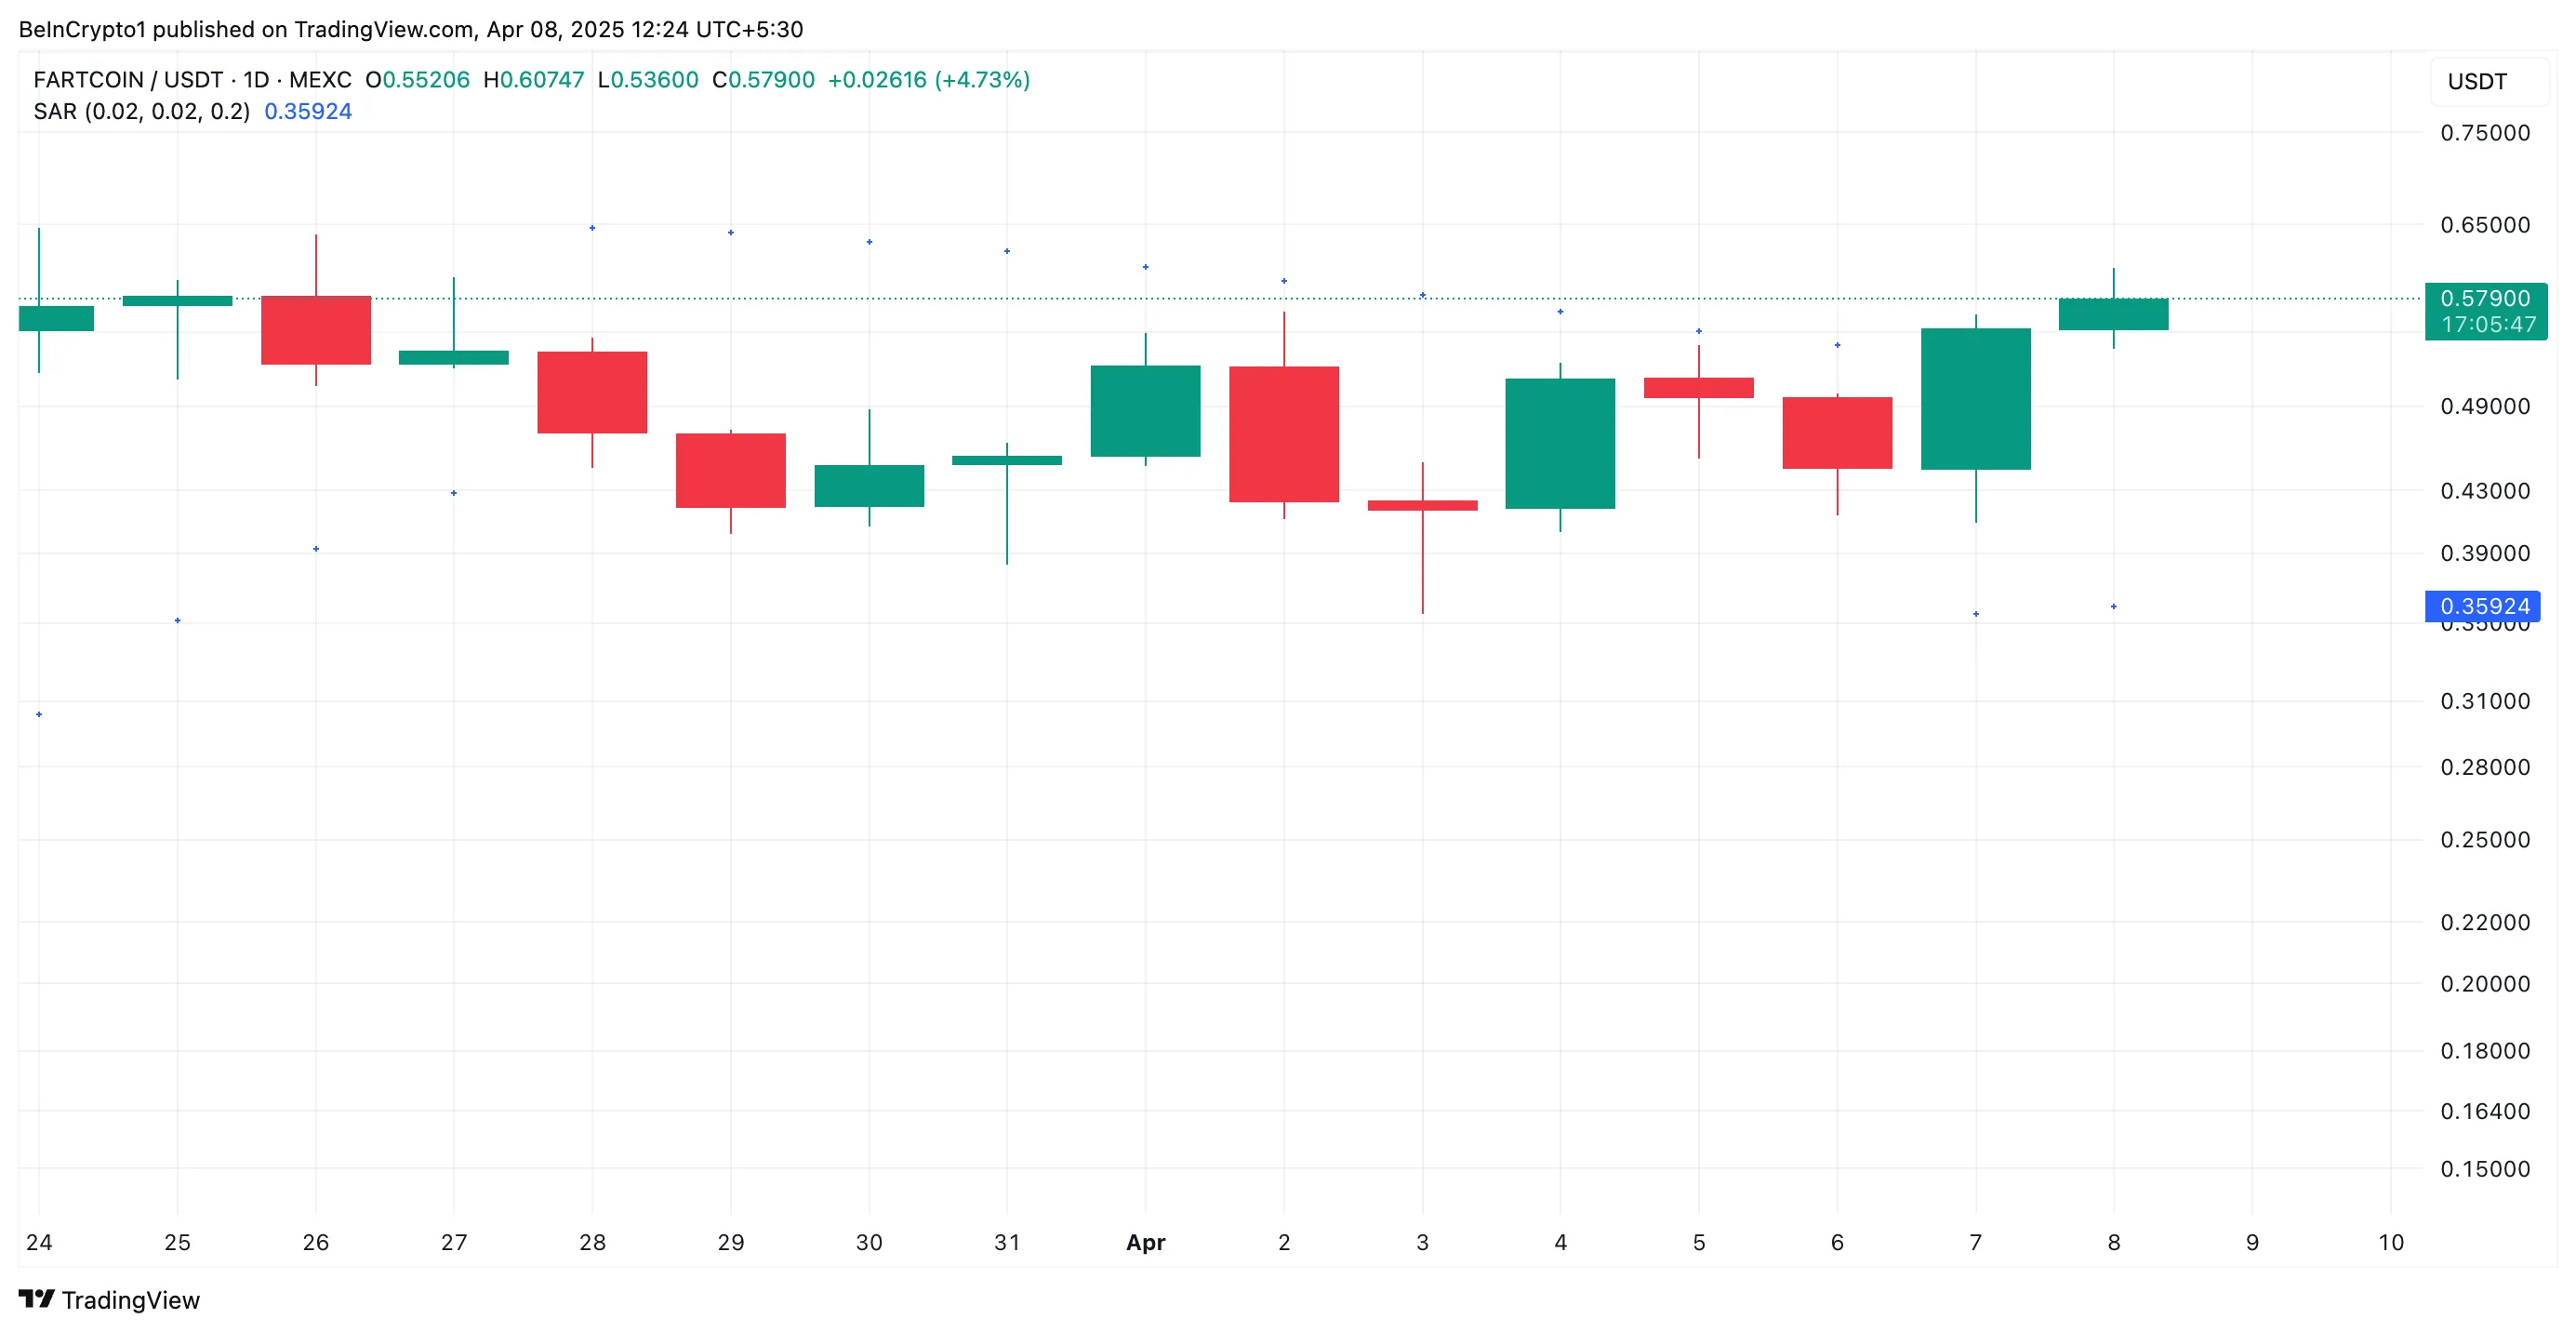
An asset’s Parabolic SAR indicator identifies potential trend direction and reversals. When its dots are placed under an asset’s price, the market is in an uptrend. It indicates an asset’s price is rising, and the rally may continue.
FARTCOIN Breakout Sets Stage for Bullish Continuation or Sharp Reversal
FARTCOIN’s double-digit rally has pushed its price past the key resistance of $0.54, which it had struggled to break above in the past two weeks. If demand strengthens, that price level will solidify into a support floor, and the token’s rally could continue.
In that scenario, FARTCOIN’s price could climb to $0.73.

On the other hand, a failed retest of the $0.54 support floor could trigger FARTCOIN’s price to fall to $0.34.
Disclaimer
In line with the Trust Project guidelines, this price analysis article is for informational purposes only and should not be considered financial or investment advice. BeInCrypto is committed to accurate, unbiased reporting, but market conditions are subject to change without notice. Always conduct your own research and consult with a professional before making any financial decisions. Please note that our Terms and Conditions, Privacy Policy, and Disclaimers have been updated.

Reason to trust
![]()
Strict editorial policy that focuses on accuracy, relevance, and impartiality
Created by industry experts and meticulously reviewed
The highest standards in reporting and publishing
Strict editorial policy that focuses on accuracy, relevance, and impartiality
Morbi pretium leo et nisl aliquam mollis. Quisque arcu lorem, ultricies quis pellentesque nec, ullamcorper eu odio.
Bitcoin price started a fresh decline below the $80,000 zone. BTC is now correcting losses and might face resistance near the $80,500 zone.
- Bitcoin started a fresh decline below the $80,000 zone.
- The price is trading below $81,500 and the 100 hourly Simple moving average.
- There is a connecting bearish trend line forming with resistance at $80,400 on the hourly chart of the BTC/USD pair (data feed from Kraken).
- The pair could start another increase if it clears the $81,500 zone.
Bitcoin Price Starts Recovery
Bitcoin price started a fresh decline below the $82,000 and $81,200 levels. BTC traded below the $80,500 and $80,000 levels to enter a bearish zone.
The price even dived below the $78,000 support zone. A low was formed at $74,409 and the price started a recovery wave. There was a move above the $76,800 level. The price climbed above the 50% Fib retracement level of the recent decline from the $83,680 swing high to the $74,409 low.
However, the price is struggling to continue higher. Bitcoin price is now trading below $81,200 and the 100 hourly Simple moving average. On the upside, immediate resistance is near the $80,400 level. There is also a connecting bearish trend line forming with resistance at $80,400 on the hourly chart of the BTC/USD pair.

The first key resistance is near the $81,500 level or the 76.4% Fib retracement level of the recent decline from the $83,680 swing high to the $74,409 low. The next key resistance could be $82,500. A close above the $82,500 resistance might send the price further higher. In the stated case, the price could rise and test the $83,500 resistance level. Any more gains might send the price toward the $85,000 level.
Another Decline In BTC?
If Bitcoin fails to rise above the $80,500 resistance zone, it could start a fresh decline. Immediate support on the downside is near the $79,500 level. The first major support is near the $78,000 level.
The next support is now near the $76,500 zone. Any more losses might send the price toward the $75,000 support in the near term. The main support sits at $74,400.
Technical indicators:
Hourly MACD – The MACD is now gaining pace in the bullish zone.
Hourly RSI (Relative Strength Index) – The RSI for BTC/USD is now above the 50 level.
Major Support Levels – $79,500, followed by $78,000.
Major Resistance Levels – $80,500 and $81,500.
Trump-Backed WLFI Proposes Airdrop Test for USD1 Stablecoin

Why Curve Finance (CRV) Price Is Up 10% Despite Founder Dumping Heavily?
FARTCOIN Rally Pushes Price to New Heights as Market Struggles

Will the Fed Return to Quantitative Easing?
Here’s Where Ethereum’s Last Line Of Defense Lies, According To On-Chain Data
Bitcoin +6%, Ethereum +10% Amid Tariff Uncertainty; FARTCOIN Skyrockets +38%, Recovery or Bubble?


-

 Regulation22 hours ago
Pakistan’s Crypto Council Appoints Binance Founder Changpeng Zhao As Strategic Advisor
-

 Market21 hours ago
XRP and Bitcoin Briefly Rallies After Rumors of 90-Day Tariff Pause
-

 Market20 hours ago
Is $0.415 the Key to Further Gains?
-
 Market22 hours ago
Binance Founder CZ Joins Pakistan Crypto Council as Advisor
-
 Altcoin22 hours ago
Dogecoin Whale Dumps 300M Coins Amid Market Crash, Can DOGE Price Dip Below $0.1?
-

 Market17 hours ago
Crypto Whales Are Buying These Altcoins Post Market Crash
-
 Altcoin20 hours ago
Peter Schiff Predicts Ethereum Price To Drop Below $1,000, Compares It To Bitcoin And Gold
-

 Ethereum20 hours ago
Ethereum Capitulation May Be Nearing End – Will A Fed Pivot Spark A Recovery?
 Arabic
 Chinese (Simplified)
 Dutch
Dutch English
 French
 German
 Italian
 Portuguese
 Russian
 Spanish
 Vietnamese