
Market
Altcoin Season Hopes Revived by These 3 Leading Altcoins

Just a few days ago, only six out of the top 50 altcoins outperformed Bitcoin (BTC). But today, that has changed, fueling fresh speculation of an altcoin season.
The interesting part of this development is not only the addition of three new cryptocurrencies but also the fact that the new entrants are all in the top ten by market cap. They include Solana (SOL), Ethereum (ETH), and Ripple (XRP).
Is the Rotation to Altcoins High Risk, High Reward?
It is important to note that altcoin season starts when at least 75% of the non-Bitcoin cryptos perform better than BTC. Still, only nine are doing that, meaning that the altcoins’ dominance period has yet to be confirmed.
As mentioned above, the performance of SOL, ETH, and XRP is boosting the market’s confidence. Glassnode founders Jan Happel, Rafael Schultze-Kraft, and Yann Allemann also echo this assertion.
Using their joint X account Negentropic, the founders of the on-chain analytic platform, noted that the rotation of capital into riskier assets may soon begin in the crypto market.
Firstly, they compared the changes in the traditional market and used that as an inference for potential switches in the crypto market.
“Will we also see this is BTC and Alts? Well – in November 2020, we had a day just like yesterday. IWM soared and continued up for the coming months. This was the starting signal to the strongest part of the Alt-rally for the coming 4 months as Total3 rallied by ~400% in just 4 months. Will we see the same again? Will rotation create a massive rally in Alts? We think that may well happen!” Negentropic posted on July 12.
Furthermore, Solana, Ripple, and Ethereum’s entrance into the fold can be linked to their price action.
Over the last seven days, SOL’s price increased by 9.31%, ETH jumped by 9.56%, and XRP was the surprising gainer with an incredible 21.97% hike.
Here is how the cryptos may perform as the much-anticipated altcoin season nears.
Solana (SOL) Eyes Higher Prices After 9% Increase
The current SOL/USD daily chart shows that the altcoin has formed a symmetrical triangle. This chart pattern is characterized by converging trendlines which connect a series of lower highs and higher lows.
The lower highs act as resistance, while the higher lows act as support. In addition, the price of SOL is looking to break through the triangle. If this happens, Solana will exit the consolidation phase and head toward a huge breakout.
Furthermore, the Fibonacci Retracement indicator spots potential resistance and support points for the token. As seen in the chart below, SOL may elevate toward $162.79 in the coming days.
Read More: What Is Altcoin Season? A Comprehensive Guide
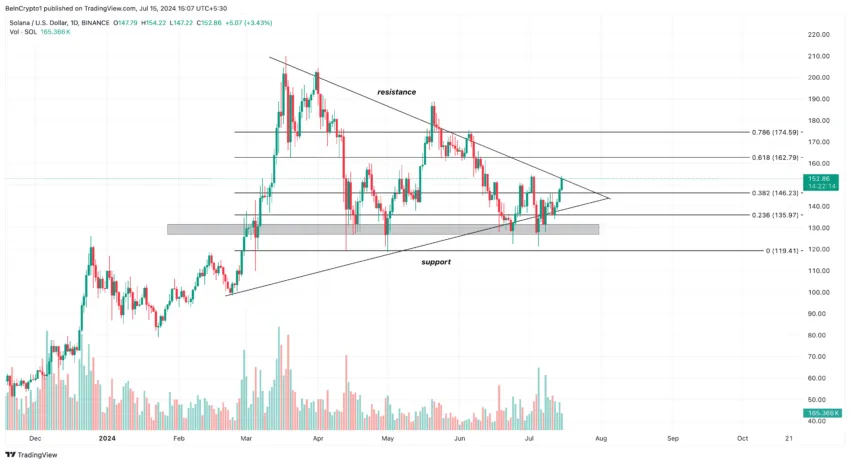
This is where the 0.618 Fibonacci positions. If successful, this can drive the altcoin price to retest $174.59. However, in the case of a pullback, SOL’s price can retrace to $135.97.
Ethereum (ETH) Breaches Key Resistance, Set for $3,622
At press time, ETH trades at $3,360. The price is also trading above the 20-day EMA (blue). EMA is an acronym for Exponential Moving Average, and it measures changes in price direction over a period of time.
If the EMA is above the price, it means the trend is bearish. But since ETH changes hands above the 20 EMA, it implies that the trend is bullish. Further, the Relative Strength Index (RSI) supports this bias.
The RSI measures momentum, and since it is above the neutral line, it means bulls are in control of ETH’s movement. Evidence of this is the break past the resistance at $3,255 and the defense at $2,946.
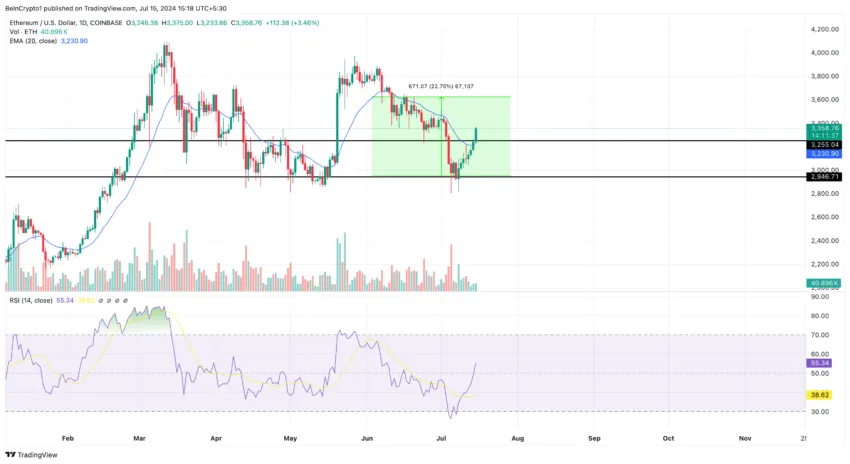
Should the momentum remain bullish and the hype around the spot Ethereum ETF launch persist, the price may reach $3,622. However, if selling pressure comes into play, ETH’s price may decrease to $3,132.
Ripple (XRP) Breaks Out of Descending Channel
Initially, XRP encountered a multi-month descending channel, with downward trendlines connecting lower highs and lower lows. However, analysis shows that the altcoin exploded after buying interest intensified at $0.42. This later led to the token’s hike to $0.53.
At press time, the Money Flow Index (MFI) reveals that high demand for XRP remains present. As such, it is not out of place to expect a price increase to $0.55. If successful, the price of XRP might reach $0.57.
Read More: 11 Cryptos To Add To Your Portfolio Before Altcoin Season
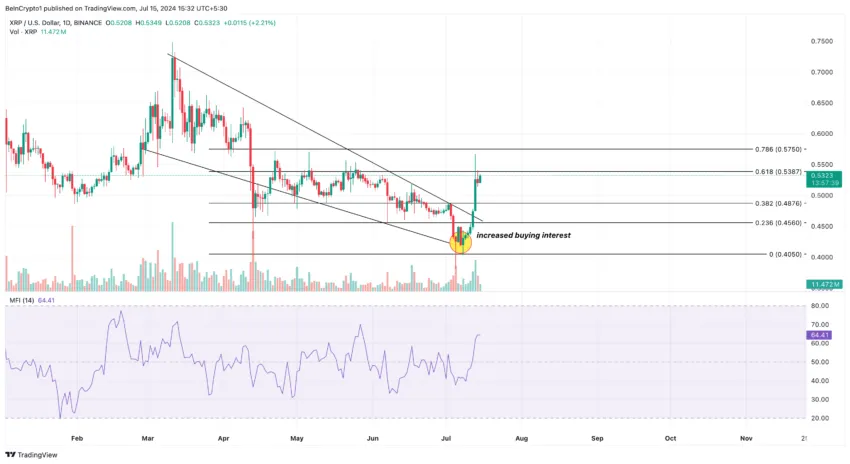
However, $0.57 is crucial for the token, especially as it has been rejected at this point a number of times. If bulls breach the resistance, Ripple can look toward $0.60. However, another rejection at this point may force the price back to $0.52.
All in all, it seems that the altcoin season for this cycle is getting closer by the day. However, traders in the market need to watch Bitcoin, considering that it has been able to reclaim $62,000.
If the price of BTC continues to increase and Bitcoin dominance jumps, this will invalidate a rise in the prices of altcoins.
Disclaimer
In line with the Trust Project guidelines, this price analysis article is for informational purposes only and should not be considered financial or investment advice. BeInCrypto is committed to accurate, unbiased reporting, but market conditions are subject to change without notice. Always conduct your own research and consult with a professional before making any financial decisions. Please note that our Terms and Conditions, Privacy Policy, and Disclaimers have been updated.


Ethereum (ETH) co-founder Vitalik Buterin has proposed overhauling the blockchain’s smart contract infrastructure by replacing the Ethereum Virtual Machine (EVM) with RISC-V, a widely adopted open-source instruction set architecture.
This shift aims to address one of Ethereum’s key scaling bottlenecks by dramatically improving the efficiency and simplicity of smart contract execution.
Buterin Proposes Ditching EVM for RISC-V
The proposal was detailed in a post on the Ethereum Magicians forum. In it, Buterin suggested that smart contracts could eventually be compiled to RISC-V rather than EVM bytecode.
According to Buterin, this shift addresses long-term scalability challenges. This particularly includes keeping block production competitive and improving zero-knowledge (ZK) EVM-proof efficiency.
“It aims to greatly improve the efficiency of the Ethereum execution layer, resolving one of the primary scaling bottlenecks, and can also greatly improve the execution layer’s simplicity – in fact, it is perhaps the only way to do so,” he wrote.
Current ZK-EVM implementations spend around half of their proving cycles on EVM execution. By switching to a native RISC-V VM, Ethereum could potentially achieve up to 100x efficiency gains.
Importantly, many fundamental aspects of Ethereum’s architecture would remain unchanged, preserving continuity for developers and users. Core abstractions such as accounts, smart contract storage, ETH balances, and cross-contract calls would function exactly as they do today.
Developers would still write contracts in familiar languages like Solidity or Vyper. These would simply be compiled to RISC-V rather than EVM bytecode. Tooling and workflows would remain largely intact, ensuring a smooth transition.
Crucially, the proposal ensures backward compatibility. Existing EVM contracts will remain fully operational and interoperable with new RISC-V contracts.
Buterin outlines several potential implementation paths forward. The first would support both EVM and RISC-V smart contracts natively. The second suggests wrapping EVM contracts to run via an interpreter written in RISC-V. Thus, it would enable a full transition without breaking compatibility.
The third, more modular approach, builds on the second by formally enshrining interpreters as part of the Ethereum protocol. This would allow the EVM and the future virtual machines to be supported in a standardized way.
Buterin stated that the idea is “equally as ambitious as the beam chain effort.”
“The beam chain effort holds great promise for greatly simplifying the consensus layer of Ethereum. But for the execution layer to see similar gains, this kind of radical change may be the only viable path,” Buterin added.
For context, the Ethereum Beam Chain is a redesign of Ethereum’s consensus layer (Beacon Chain). It focuses on faster block times, faster finality, chain snarkification, and quantum resistance. The development will likely begin in 2026.
This proposal fits into Ethereum’s broader vision of modularity, simplicity, and long-term scalability. Previously, BeInCrypto reported on Buterin’s privacy-centric plans for the blockchain.
The proposal focused on integrating privacy-preserving technologies. Moreover, the Pectra upgrade is also nearing, with the launch expected on May 7.
Meanwhile, ETH continues to face market headwinds, trading at March 2023 lows. This year has been quite hard for the altcoin, as it saw a decline of 50.8%. In fact, Ethereum dominance hit a 5-year low last week.

Nonetheless, BeInCrypto data showed a slight recovery over the last 14 days. ETH rose by 6.1%. Over the past day alone, it saw modest gains of 1.7%. At the time of writing, ETH was trading at $1,639.
Disclaimer
In adherence to the Trust Project guidelines, BeInCrypto is committed to unbiased, transparent reporting. This news article aims to provide accurate, timely information. However, readers are advised to verify facts independently and consult with a professional before making any decisions based on this content. Please note that our Terms and Conditions, Privacy Policy, and Disclaimers have been updated.

Solana started a fresh increase from the $120 support zone. SOL price is now consolidating and might climb further above the $142 resistance zone.
- SOL price started a fresh increase above the $125 and $132 levels against the US Dollar.
- The price is now trading above $130 and the 100-hourly simple moving average.
- There is a connecting bullish trend line forming with support at $137 on the hourly chart of the SOL/USD pair (data source from Kraken).
- The pair could start a fresh increase if it clears the $142 resistance zone.
Solana Price Gains Over 5%
Solana price formed a base above the $120 support and started a fresh increase, like Bitcoin and Ethereum. SOL gained pace for a move above the $125 and $132 resistance levels.
The pair even spiked toward the $145 resistance zone. A high was formed at $143.06 and the price is now retreating lower. There was a move below the 23.6% Fib retracement level of the upward move from the $135 swing low to the $143 high.
Solana is now trading above $130 and the 100-hourly simple moving average. There is also a connecting bullish trend line forming with support at $137 on the hourly chart of the SOL/USD pair. The trend line is close to the 76.4% Fib retracement level of the upward move from the $135 swing low to the $143 high.

On the upside, the price is facing resistance near the $142 level. The next major resistance is near the $145 level. The main resistance could be $150. A successful close above the $150 resistance zone could set the pace for another steady increase. The next key resistance is $155. Any more gains might send the price toward the $165 level.
Pullback in SOL?
If SOL fails to rise above the $142 resistance, it could start another decline. Initial support on the downside is near the $138.50 zone. The first major support is near the $137 level and the trend line.
A break below the $137 level might send the price toward the $132 zone. If there is a close below the $132 support, the price could decline toward the $125 support in the near term.
Technical Indicators
Hourly MACD – The MACD for SOL/USD is gaining pace in the bullish zone.
Hourly Hours RSI (Relative Strength Index) – The RSI for SOL/USD is above the 50 level.
Major Support Levels – $137 and $132.
Major Resistance Levels – $142 and $145.

Reason to trust
![]()
Strict editorial policy that focuses on accuracy, relevance, and impartiality
Created by industry experts and meticulously reviewed
The highest standards in reporting and publishing
Strict editorial policy that focuses on accuracy, relevance, and impartiality
Morbi pretium leo et nisl aliquam mollis. Quisque arcu lorem, ultricies quis pellentesque nec, ullamcorper eu odio.
Bitcoin price is slowly moving higher above the $86,500 zone. BTC is gaining pace and might continue higher in the near term.
- Bitcoin found support at $84,200 and started a recovery wave.
- The price is trading above $85,500 and the 100 hourly Simple moving average.
- There was a break above a connecting bearish trend line with resistance at $85,000 on the hourly chart of the BTC/USD pair (data feed from Kraken).
- The pair could start another increase if it clears the $88,000 zone.
Bitcoin Price Eyes Steady Increase
Bitcoin price remained stable above the $83,200 level and started a fresh increase. BTC was able to climb above the $84,200 and $85,000 resistance levels.
There was a break above a connecting bearish trend line with resistance at $85,000 on the hourly chart of the BTC/USD pair. The bulls were able to pump the price above the $86,500 resistance. It even spiked above $87,000. A high is formed near $87,562 and the price might continue to rise unless there is a move below the 23.6% Fib retracement level of the upward move from the $84,007 swing low to the $87,562 high.
Bitcoin price is now trading above $86,500 and the 100 hourly Simple moving average. On the upside, immediate resistance is near the $87,500 level. The first key resistance is near the $88,000 level.

The next key resistance could be $88,800. A close above the $88,800 resistance might send the price further higher. In the stated case, the price could rise and test the $89,500 resistance level. Any more gains might send the price toward the $90,000 level.
Downside Correction In BTC?
If Bitcoin fails to rise above the $88,000 resistance zone, it could start a downside correction. Immediate support on the downside is near the $87,000 level. The first major support is near the $86,750 level.
The next support is now near the $86,000 zone. Any more losses might send the price toward the $85,750 support or the 50% Fib retracement level of the upward move from the $84,007 swing low to the $87,562 high in the near term. The main support sits at $84,850.
Technical indicators:
Hourly MACD – The MACD is now gaining pace in the bullish zone.
Hourly RSI (Relative Strength Index) – The RSI for BTC/USD is now above the 50 level.
Major Support Levels – $86,750, followed by $86,000.
Major Resistance Levels – $87,500 and $88,000.

Vitalik Buterin Proposes to Replace EVM with RISC-V
US Economic Indicators to Watch & Potential Impact on Bitcoin

Solana Rallies Past Bitcoin—Momentum Tilts In Favor of SOL

Expert Says Solana Price To $2,000 Is Within Reach, Here’s How

Bitcoin Price Breakout In Progress—Momentum Builds Above Resistance

Here Are The Bitcoin Levels To Watch For The Short Term

2.52 Million Altcoins Are Ruining Crypto’s Future

Animoca Brands Valuation Tanks 75% In Two Years, Here’s Why

Crypto exchange BingX hacked for $43 million

Are The Big Players Losing Interest?

Hong Kong’s Securities Association Tips Authorities On Crypto Self-Regulation

Coinbase cbBTC Set to go Live on Solana
2.52 Million Altcoins Are Ruining Crypto’s Future
Animoca Brands Valuation Tanks 75% In Two Years, Here’s Why
Crypto exchange BingX hacked for $43 million
Are The Big Players Losing Interest?
Hong Kong’s Securities Association Tips Authorities On Crypto Self-Regulation
Coinbase cbBTC Set to go Live on Solana
-

 Ethereum21 hours ago
Ethereum Consolidates In Symmetrical Triangle: Expert Predicts 17% Price Move
-
 Market15 hours ago
1 Year After Bitcoin Halving: What’s Different This Time?
-

 Market21 hours ago
Today’s $1K XRP Bag May Become Tomorrow’s Jackpot, Crypto Founder Says
-

 Market19 hours ago
MELANIA Crashes to All-Time Low Amid Insiders Continued Sales
-
 Altcoin24 hours ago
What’s Up With BTC, XRP, ETH?
-

 Market20 hours ago
Charles Schwab Plans Spot Crypto Trading Rollout in 2026
-

 Ethereum23 hours ago
Ethereum Accumulators At A Crucial Moment: ETH Realized Price Tests Make-Or-Break Point
-

 Ethereum20 hours ago
Ethereum Enters Historic Buy Zone As Price Dips Below Key Level – Insights