
Market
AI Coins TAO and FET Hit Hard by OpenAI’s $6.6 Billion Raise

OpenAI’s latest funding could be a great development for the Sam Altman-led company. However, for Artificial Intelligence (AI) coins, including Bittensor (TAO) and Artificial Superintelligence Alliance (FET), it is a classic “sell the news” event.
On previous occasions, developments like this have triggered a substantial hike in the prices of this altcoin. But today, it is not the same as FET and TAO prices, which are down. But what’s next after this development?
OpenAI Value Rises, But TAO Goes the Other Way
On October 2, Open AI raised $6.6 billion from several investors. According to Reuters, Microsoft, the company’s largest backer, led the round. The report also saw a notable investment from Nvidia, the world’s leading Graphics Processing Unit (GPU) supplier.
“The funding came in the form of convertible notes, and the conversion to equity hinges on a successful structural change into a for-profit that would no longer be controlled by the non-profit board and the removal of the cap on returns for investors,” the Reuters report stated
However, unlike previous times when news triggered a hike in AI coins market cap, that did not happen. As of this writing, TAO’s price has decreased by 8.55% while trading below $500. FET is another AI coin affected by the development as its value tanked nearly 7%.
Read more: How To Invest in Artificial Intelligence (AI) Cryptocurrencies?
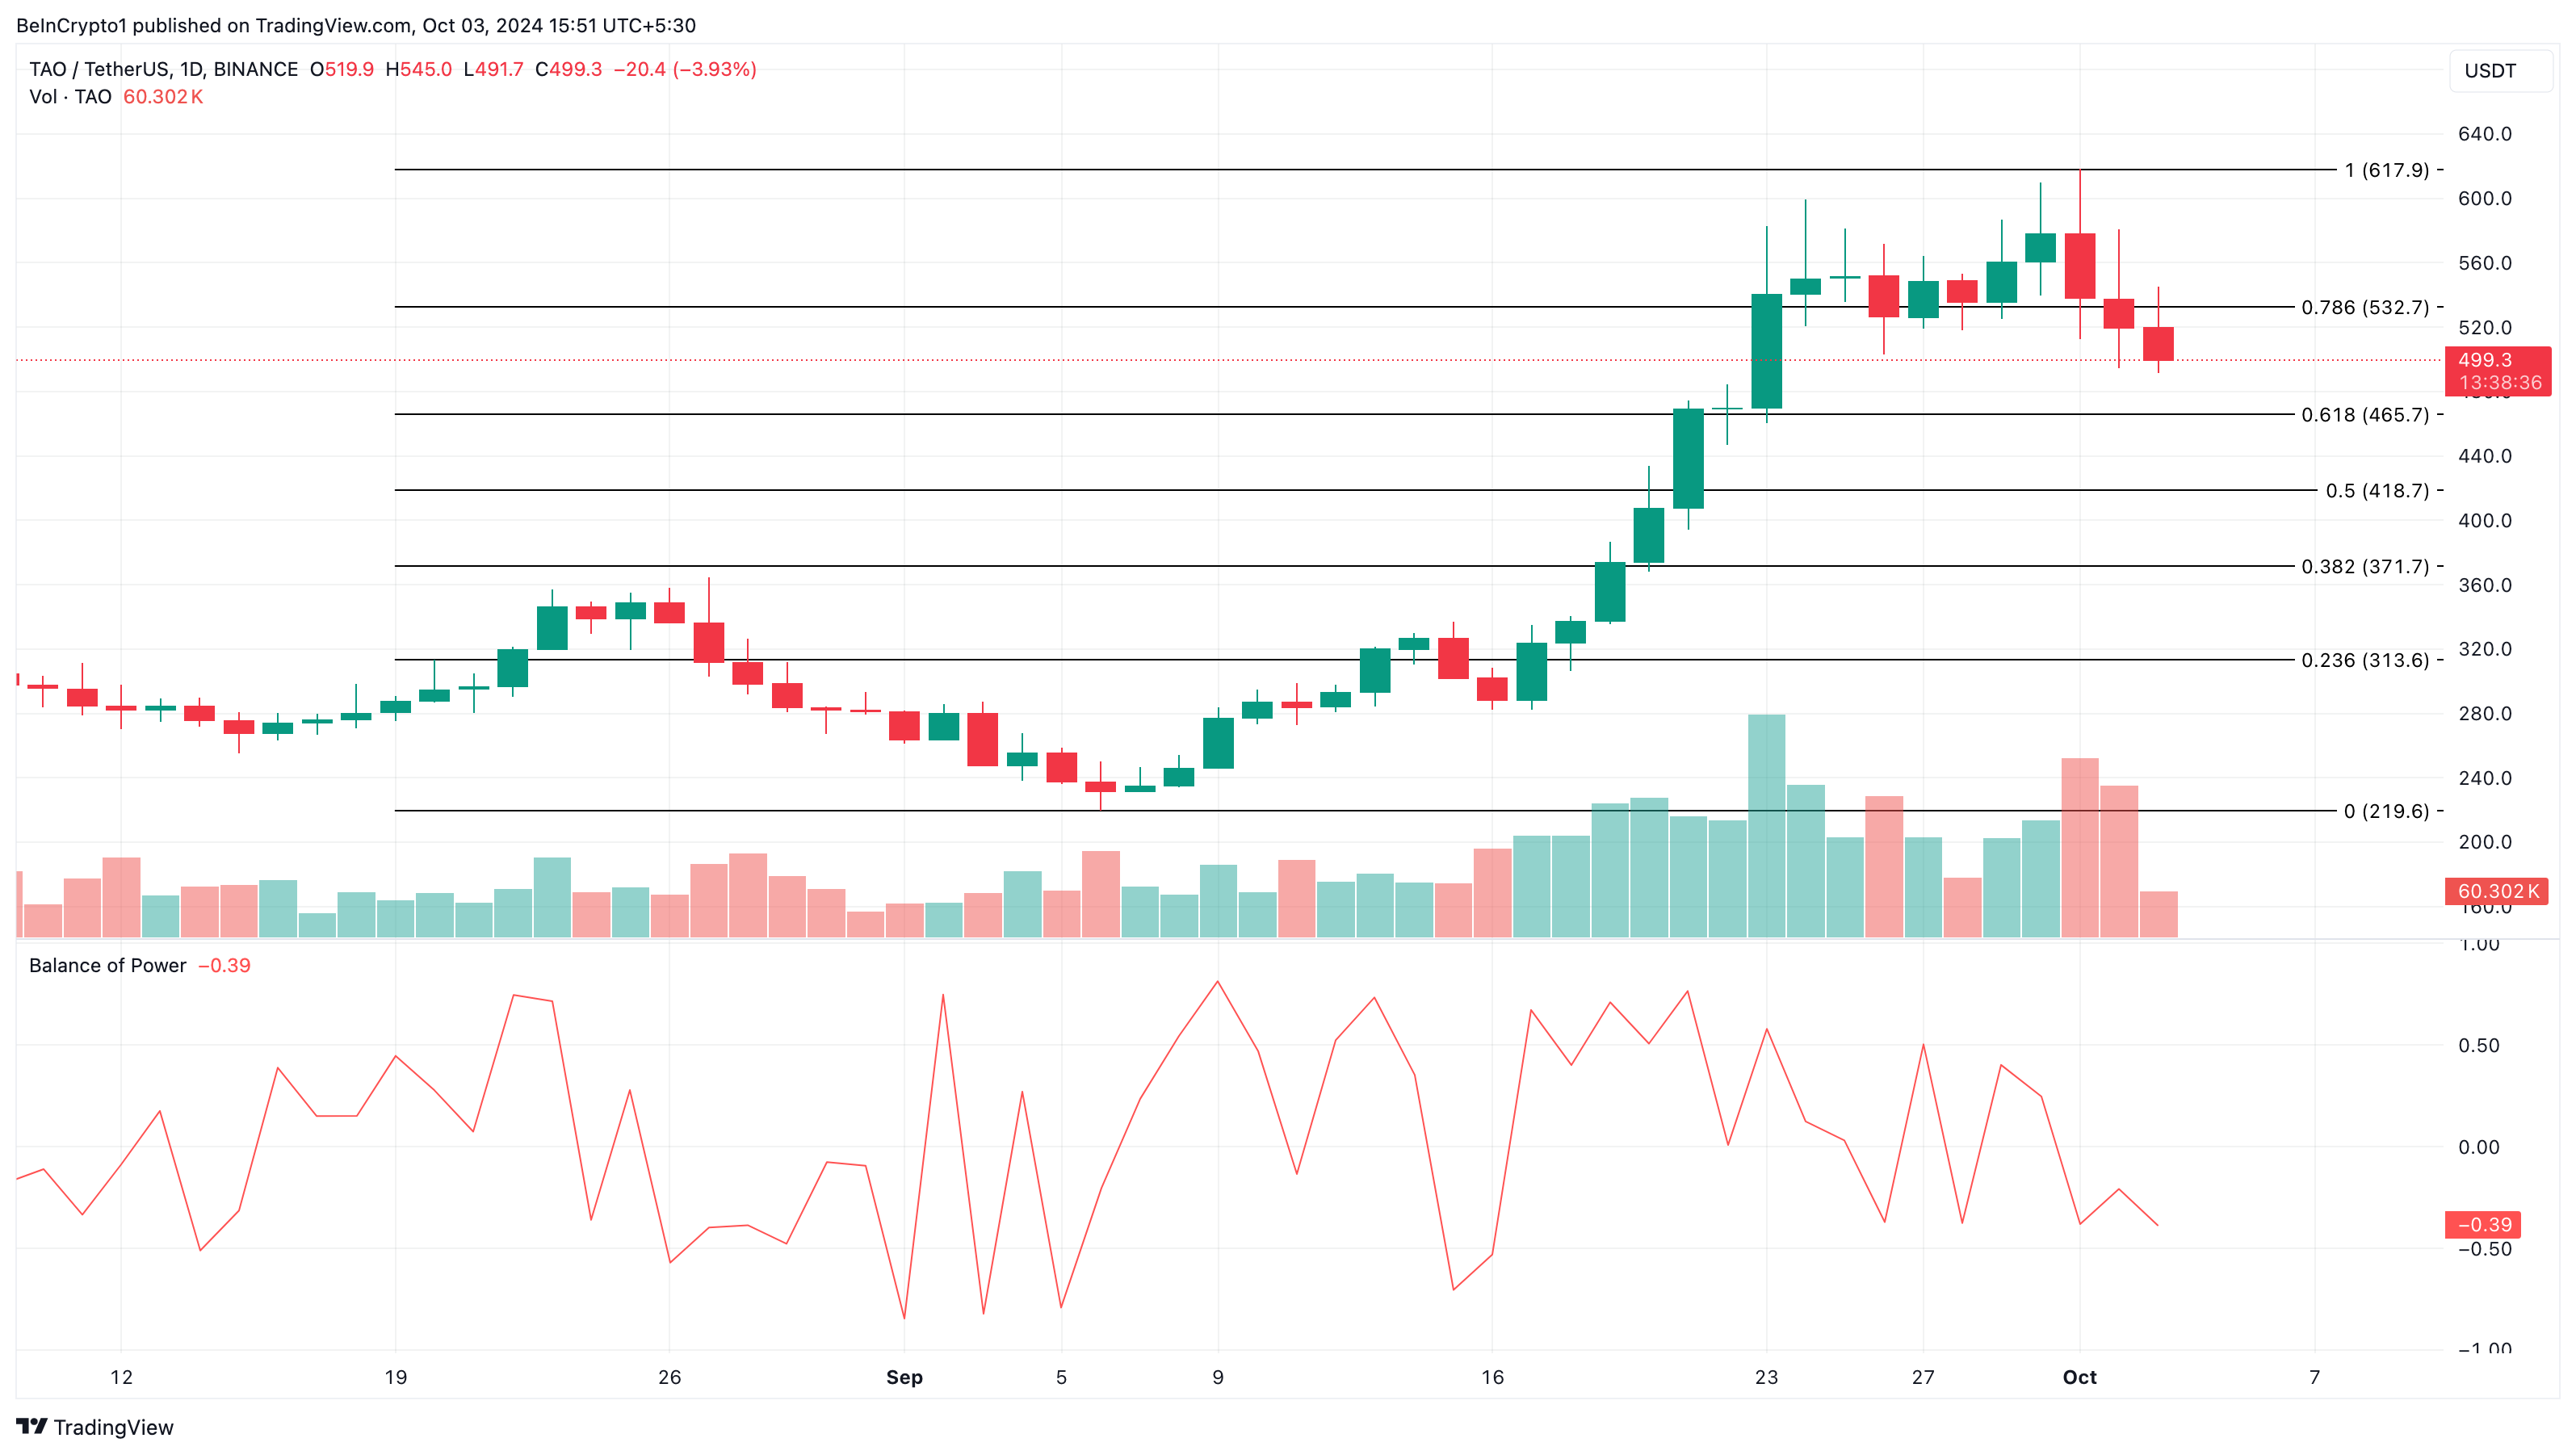
Three days ago, TAO showed readiness to climb toward $700. However, according to the Balance of Power (BoP), buyers’ strength has become weak. This decline gives sellers the upper hand.
Hence, TAO’s price could face another downturn. With TAO’s price at $498.30, the Fibonacci retracement indicator suggests that the token, which is one of the AI coins with the highest market cap, can drop to $465.70.
Meanwhile, TAO’s price might rebound if sellers get exhausted and bulls capitalize on the fatigue. In that circumstance, the altcoin’s value might jump to $617.90.
FET Price Could Drop Again
FET’s situation is not exactly different from that of TAO. As of this writing, FET’s price is $1.40 and has now dropped below the 20-day Exponential Moving Average (EMA). The EMA places great significance on recent price trends in order to measure trend direction.
When the price is above the EMA, the trend is bullish. However, since the AI coin’s value is below the threshold, it indicates a bearish trend. Considering the altcoin’s position, it might find it challenging to rebound. Instead, the FET’s price might continue to trend downward.
Read more: Top 9 Artificial Intelligence (AI) Cryptocurrencies in 2024
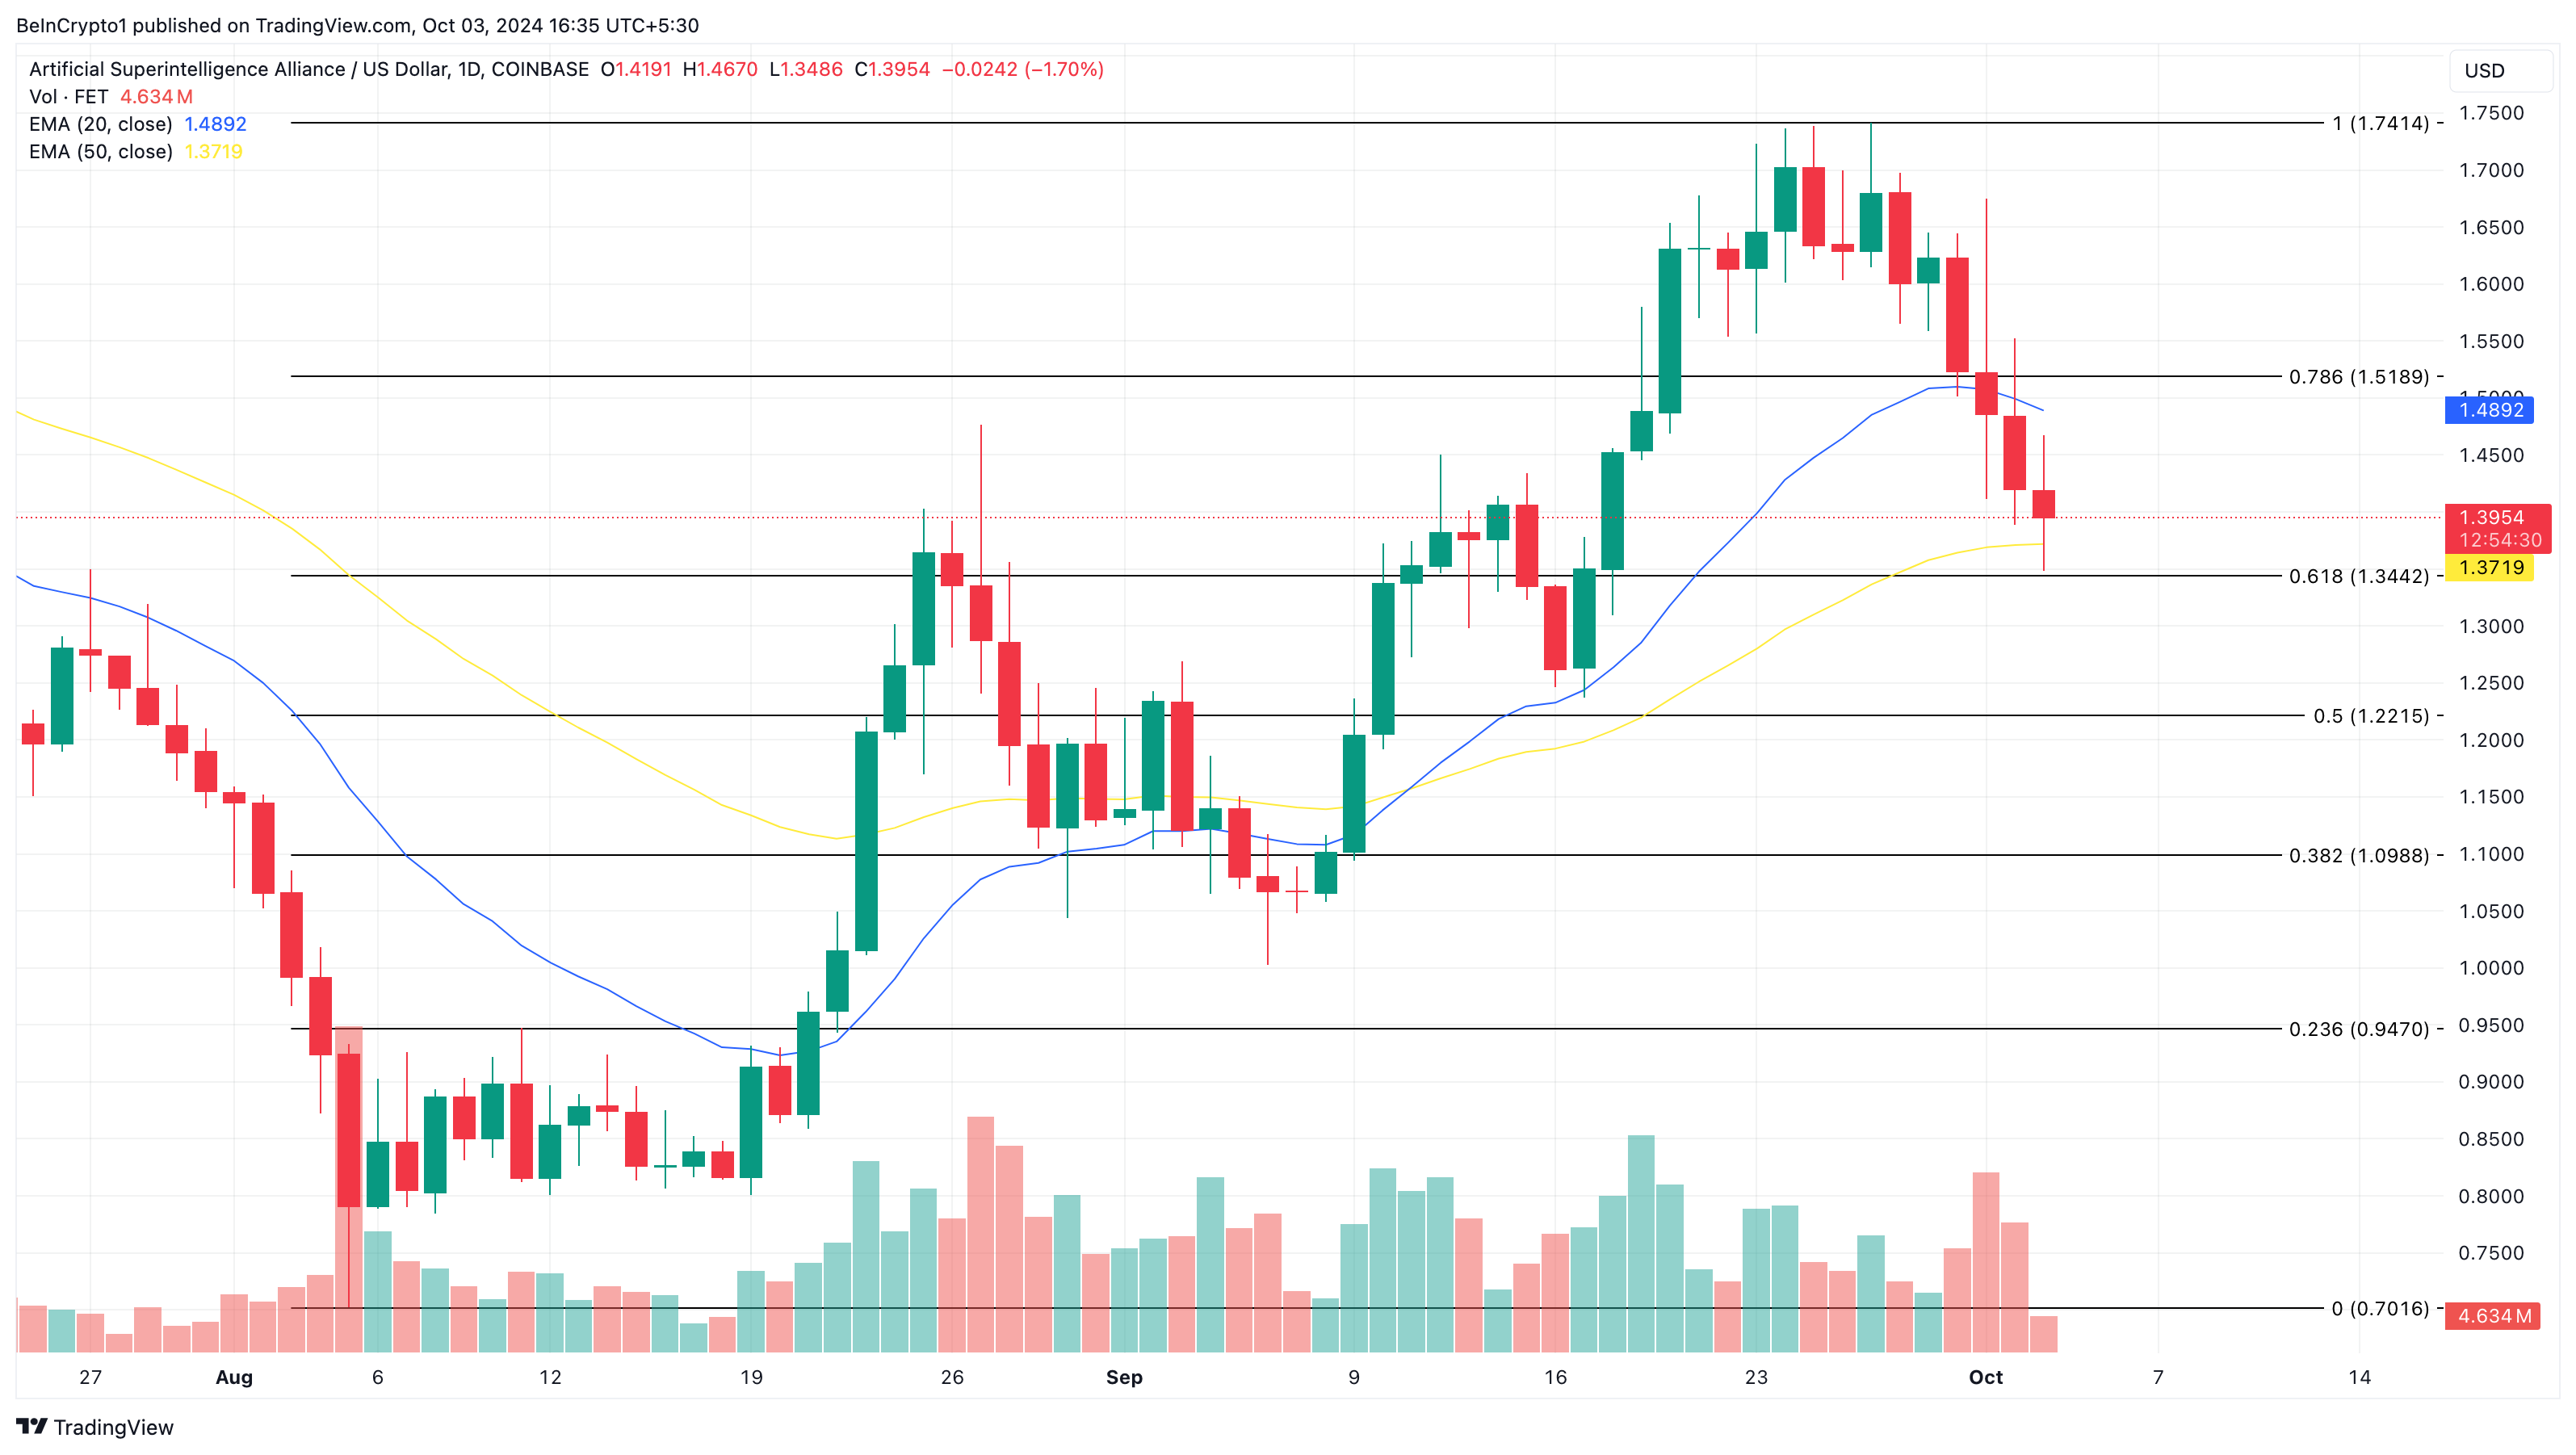
If that happens, the token could decline to $1.22. However, FET could rise to $1.74 if AI coins eventually see a bullish reversal largely due to increased capital flow.
Disclaimer
In line with the Trust Project guidelines, this price analysis article is for informational purposes only and should not be considered financial or investment advice. BeInCrypto is committed to accurate, unbiased reporting, but market conditions are subject to change without notice. Always conduct your own research and consult with a professional before making any financial decisions. Please note that our Terms and Conditions, Privacy Policy, and Disclaimers have been updated.


Cardano (ADA) has traded in a tight band between $0.64 and $0.60 for the last four days, reflecting a market in search of direction. Key indicators show a mix of weak trend strength and early signs of potential bullish momentum.
Whale activity has ticked up slightly, and short-term EMA lines are starting to slope upward, hinting at a possible breakout. Still, with the ADX remaining low and overall sentiment cautious, ADA’s next move hinges on whether it can break above resistance or hold its critical support.
Cardano’s Trend Remains Fragile With ADX Below Key Threshold
Cardano’s ADX (Average Directional Index) is currently at 16.66, rebounding slightly after falling from 28.35 four days ago to a low of 12 just a day ago.
This movement shows that while trend strength weakened significantly, there are early signs of a possible recovery. ADA appears to be attempting to form an uptrend, and the slight bounce in ADX may indicate that momentum is starting to rebuild.
However, the overall reading remains low, suggesting that any emerging trend is still weak and lacks strong conviction for now.
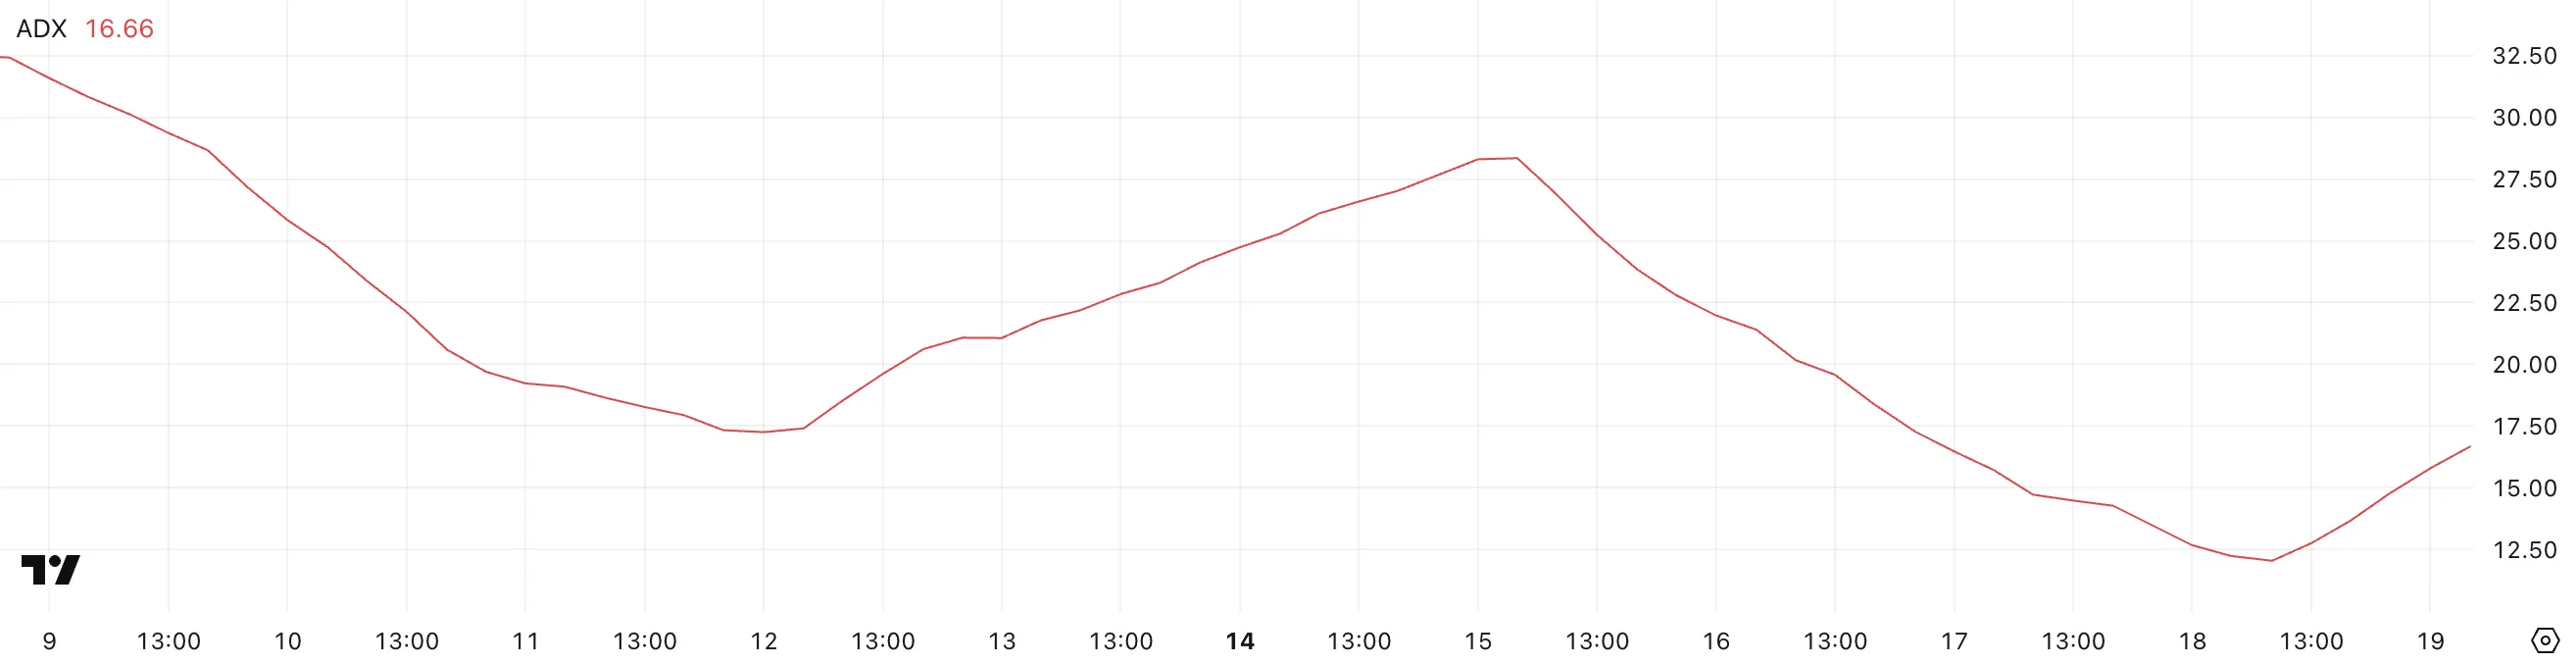
The ADX measures the strength of a trend, regardless of its direction, on a scale from 0 to 100. Readings below 20 suggest a weak or nonexistent trend, while values above 25 generally indicate that a strong trend is taking shape.
With ADA’s ADX now at 16.66, the current trend remains weak, but the recent uptick could hint at a shift.
If momentum continues to rise and ADX pushes above 25, it would confirm that a meaningful trend—likely bullish—is gaining strength. Until then, caution is warranted as the price remains in a fragile phase.
ADA Whales Return – But Still Below Recent Highs
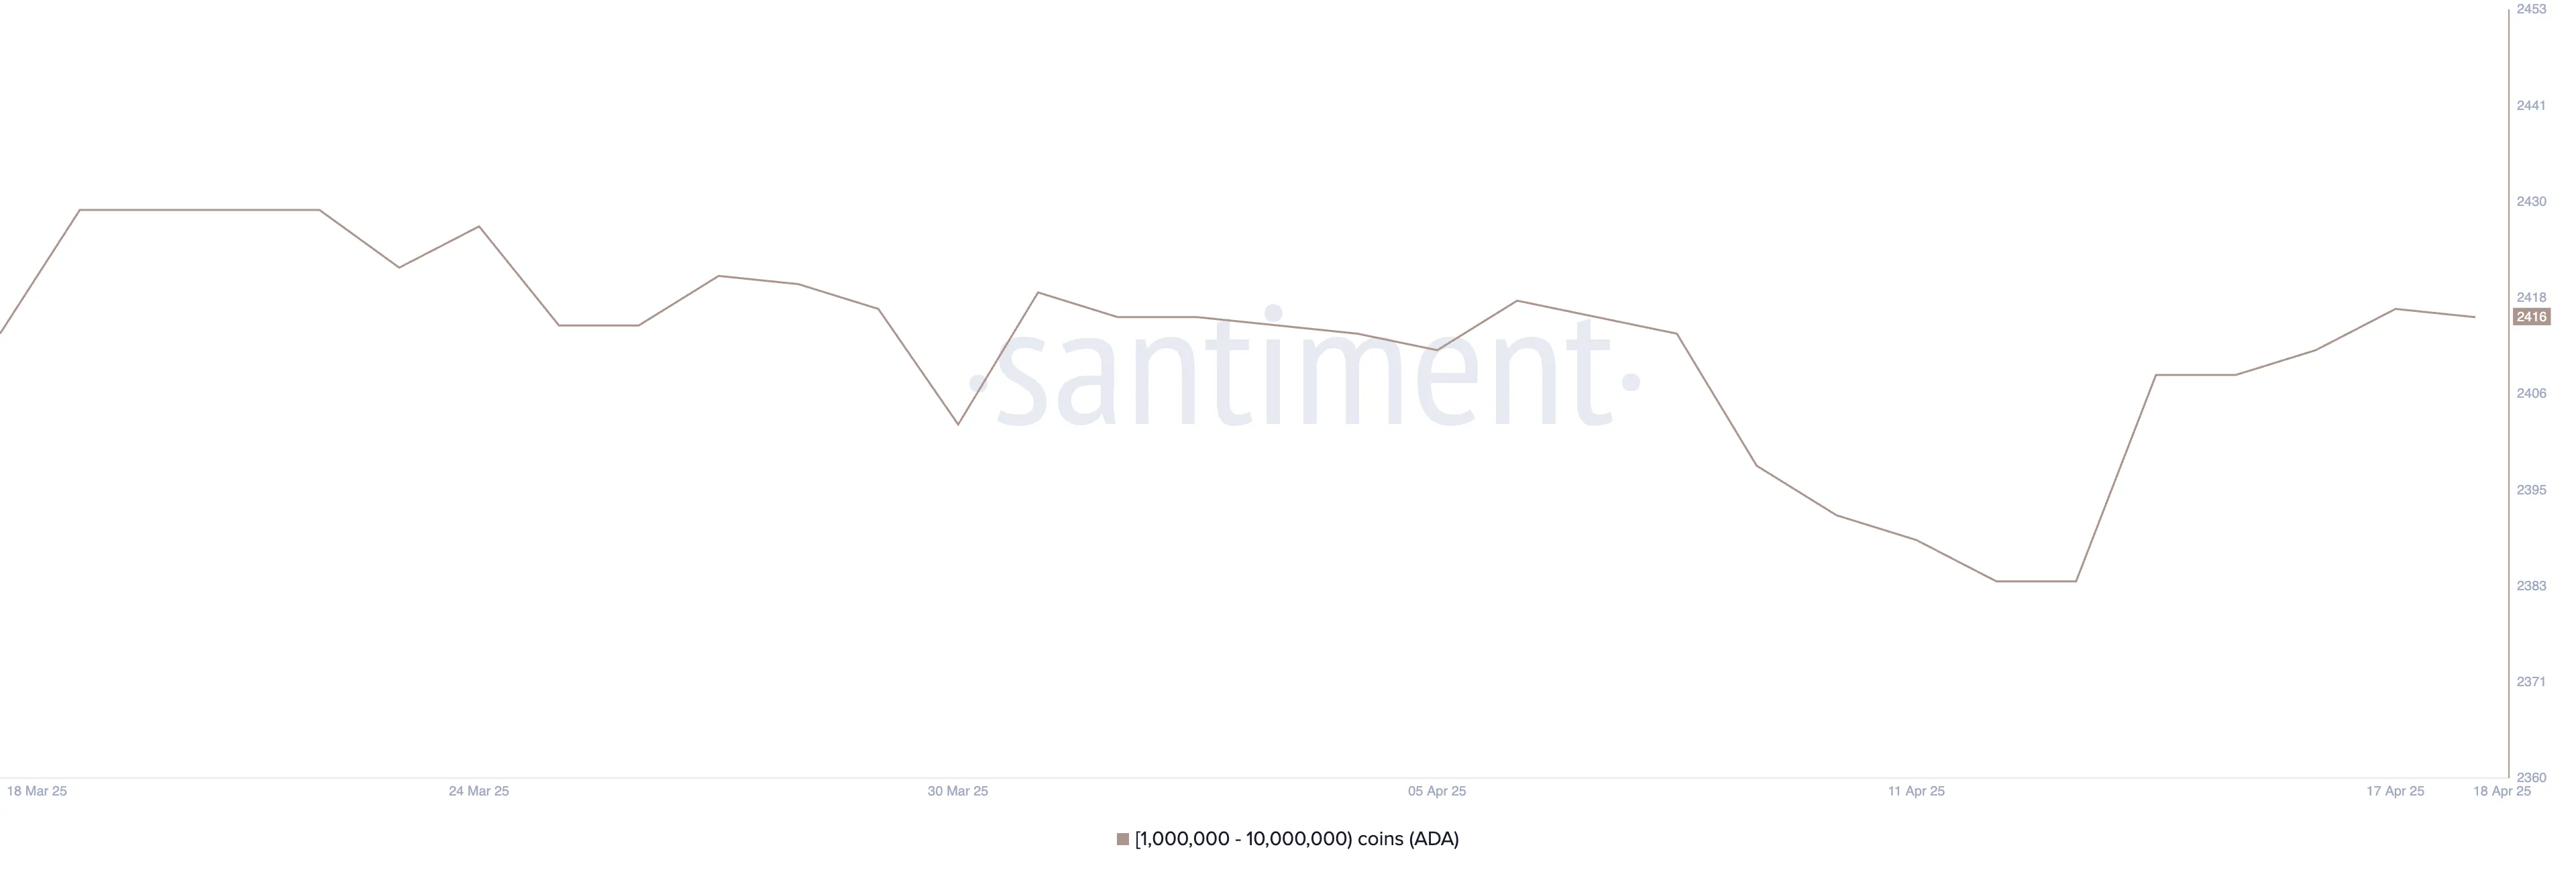
The number of Cardano whale addresses—wallets holding between 1 million and 10 million ADA—saw a sharp increase between April 13 and April 17, jumping from 2,384 to 2,417, marking the highest level since early April.
However, the momentum quickly cooled, with the number ticking down slightly to 2,416. This quick slowdown suggests that while accumulation picked up briefly, it may not have been strong or sustained enough to shift broader market sentiment.
The current whale count, despite the recent rise, remains well below the levels seen in previous months.
Tracking whale activity is important because large holders can significantly influence price action through concentrated buying or selling.
A rising number of whales may indicate growing confidence among major players, often preceding price rallies. However, the recent data shows only a modest increase with fading momentum, hinting at hesitation or limited conviction.
If whale accumulation doesn’t pick up again, ADA’s price may struggle to build strong upside momentum in the short term.
A Breakout Could Push Cardano to a 3-Week High
Cardano price is currently trading within a tight range, sitting between resistance at $0.64 and support at $0.59.
Its EMA lines point to consolidation, but the short-term averages are gradually turning upward, hinting at the possibility of a golden cross forming soon.
If that bullish crossover happens and the $0.64 resistance is broken, ADA could push toward $0.66 and $0.70, with a strong rally potentially sending it to $0.77, reclaiming territory not seen in over three weeks.
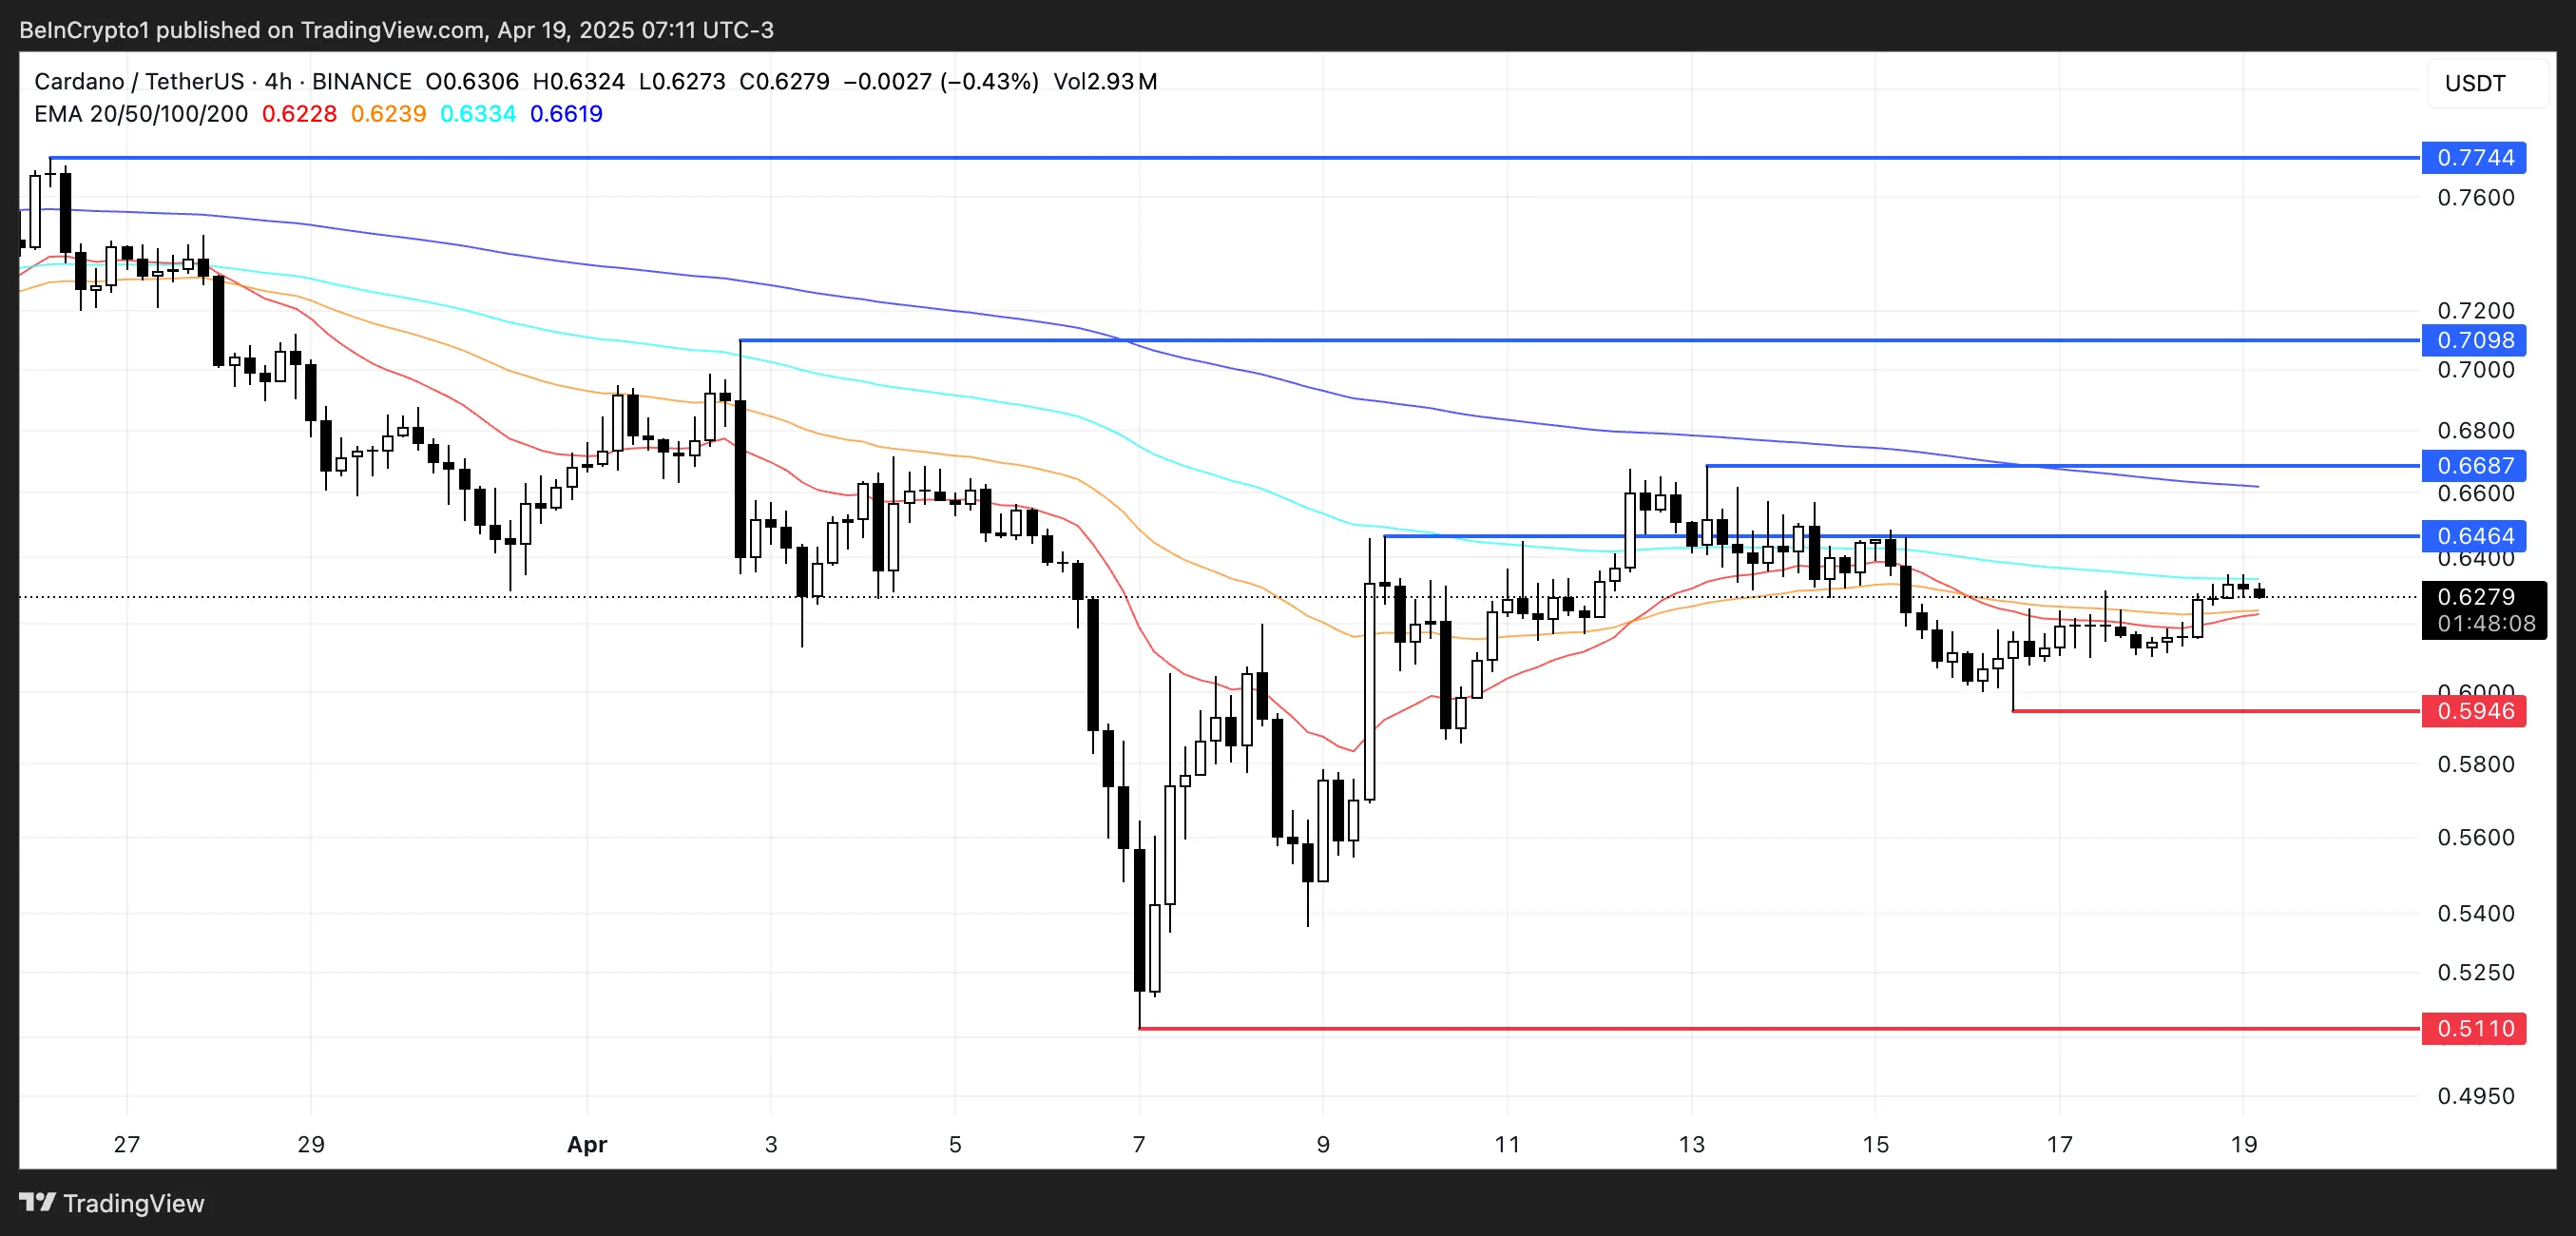
However, the outlook isn’t without risk. If the $0.59 support is tested and fails to hold, ADA could lose momentum and slide into a deeper downtrend, potentially falling all the way to $0.51.
With indicators showing a mix of consolidation and early bullish signals, the next move likely depends on whether buyers or sellers take control at these key levels.
Until a breakout or breakdown occurs, Cardano remains in a wait-and-see zone.
Disclaimer
In line with the Trust Project guidelines, this price analysis article is for informational purposes only and should not be considered financial or investment advice. BeInCrypto is committed to accurate, unbiased reporting, but market conditions are subject to change without notice. Always conduct your own research and consult with a professional before making any financial decisions. Please note that our Terms and Conditions, Privacy Policy, and Disclaimers have been updated.


Since the implementation of MiCA in the EU and the shift in US policy under President Trump, both jurisdictions have progressed in crypto legislation, albeit with distinct approaches. Europe got a head start by becoming the first to establish a comprehensive and unified regulatory framework for crypto-assets. Meanwhile, the US is catching up, with more capital to offer and a larger user base.
Manouk Termaaten, CEO of Vertical Studio AI, and Erwin Voloder, Head of Policy at the European Blockchain Association, shared their perspectives with BeInCrypto on the areas where the EU and the US are demonstrating leadership in the high-stakes development of crypto legislation and who will ultimately set the pace for global crypto regulation.
EU’s MiCA and Early Regulatory Certainty
By implementing the Markets in Crypto-Assets (MiCA) regulation on December 30, 2024, the European Union made history as the first jurisdiction to create a complete regulatory structure for crypto-assets that applies to all its member nations.
Since then, leading companies like Standard Chartered, MoonPay, BitStaete, Crypto.com, and OKX, to name a few, have secured their licenses.
The United States, in turn, was slower to act. Instead of lobbying for comprehensive crypto legislation, industry leaders have concentrated on getting approval from the US Securities and Exchange Commission (SEC). Under the Biden administration, that turned out to be a particularly hard feat.
“The EU definitely had a first-mover advantage in getting regulatory certainty out the gate with MiCA. Especially since at the time, the US was retreating from leadership in the digital asset space and the industry was facing what amounted to persecution back home in many cases,” Voloder told BeInCrypto.
Former SEC Chair Gary Gensler became known within the walls of the crypto industry as being particularly hostile toward the technology, taking a controversial regulation-by-enforcement policy stance. Crackdowns became common, and many innovators packed their bags and moved abroad, seeking opportunities in friendlier jurisdictions.
“The US relied on existing agencies like the SEC instead of building a unified crypto law. Remember, Gary Gensler almost cracked down on the market and caused massive fear but never managed to get anything through. This does not mean regulation will never come and creates legal uncertainty that’s driven many projects overseas,” Termaaten said.
Now, under Trump, things have taken quite a turn.
How Does the US Approach Crypto Innovation?
The Trump administration aims to foster a predictable environment for US crypto innovation and expansion through clear regulatory frameworks. It strongly emphasizes keeping that innovation within the United States to establish its global leadership.
In pursuit of this goal, the administration has created working groups and task forces to develop detailed regulatory frameworks, including stablecoins and crypto asset classification guidelines.
“What we’ve seen under the Trump administration so far has been a complete roll-back of Biden-era regulations and weaponization of the agencies against crypto in favour of a light- touch, pro-innovation stance. He’s dismantling the DOJ’s Crypto Enforcement Team, the SEC’s new Crypto-Asset Task Force has a new mandate, under new leadership in Commissioner Pierce, and there’s ongoing investigations in the House against the systematic de-banking of digital assets businesses, and banks with revelations coming to light almost weekly,” Voloder explained.
As part of this new chapter in crypto regulation, the United States intends to forge its path, developing distinct crypto regulations rather than adopting the EU’s MiCA framework. Its intent diverges significantly from the European approach.
MiCA’s Regulatory Framework in the EU
MiCA provides the EU with a comprehensive and unified regulatory framework for crypto assets, extending bank-like rules focused on financial stability and consumer protection.
The regulation mandates licensing for crypto service providers and stablecoin issuers, aligning them with traditional finance and supporting the creation of a Central Bank Digital Currency (CBDC) as a digital euro to safeguard monetary sovereignty.
“The EU treats crypto as part of its traditional financial system– it’s cautious, centralized, and prioritizes regulation through MiCA and the upcoming digital euro (CBDC),” Termaaten told BeInCrypto.
The US, however, operates with a contrasting attitude.
US Focus on Private Innovation and Opposition to CBDCs
Trump has clearly stated that he intends to eliminate any regulations that promote CBDCs, citing concerns about government overreach and the erosion of financial freedom.
The United States now charts a policy course that champions blockchain technology through private innovation while firmly opposing CBDCs. This stance is underscored by a recent executive order in which the White House argues that CBDCs “threaten the stability of the financial system, individual privacy, and the sovereignty of the United States.”
Trump has also clarified that stablecoins are the priority for innovation, as they can help reinforce US dollar dominance.
Meanwhile, a notably fragmented approach has characterized the advancement of crypto legislation in the US. The absence of nationwide regulations has allowed certain states to establish an early lead, but others continue to lag in pursuing crypto innovation.
“The US, especially under Trump’s recent shift, is leaning harder into private-sector innovation, explicitly opposing a CBDC and focusing on blockchain as a new tech frontier, which the USA will be the capital from. The EU’s approach is about control and stability; the US’s is about flexibility and economic leadership through innovation. Both aim to protect consumers, but through very different methods,” Termaaten said.
These fundamentally different philosophies also allow for the analysis of which regulations yield the most favorable outcomes.
What are the Financial Burdens of MiCA Compliance?
The significant investment companies must make to obtain a MiCA operating license has drawn scrutiny. Though member states set varying fees, these are generally steep.
“[There are] high costs that are not in proportion compared to the gain for a business. It also just adds a layer of legal complexity most projects dont want to bring into their project. At Vertical AI, we decided it’s strategic to proceed with becoming compliant, but others could just geo-block EU users to avoid the burden,” Termaaten told of his personal experience.
MiCA mandates minimum capital requirements based on the crypto services offered. These range from €50,000 for advisory and order-related services to €125,000 for exchange and trading platforms and up to €150,000 for custody services. Businesses must maintain this capital as a financial safeguard.
Beyond minimum capital requirements, companies must factor in government and legal fees, local presence costs, bank setups, and ongoing operational costs.
“MiCA is an expensive regulation. Compliance in Europe can be an exorbitant expense and I think the main challenge going forward at least for start-ups is justifying the high up-front costs of advisory, licensing, auditing etc., when many of these companies have a fixed burn they need to manage. The last thing you want to be doing as a start-up is piling all of your capital into compliance when that money could have been put to better use developing/refining your product and your GTM,” Voloder told BeInCrypto.
In contrast, the US allows crypto companies greater leeway to innovate.
Flexible Regulatory Stance and Private Sector Innovation in the US
While the European Union’s MiCA regulation establishes a comprehensive and structured regulatory environment, the United States has opted for a more flexible regulatory stance.
This approach prioritizes the growth of private blockchain innovation, aiming to encourage rapid development and technological advancement within the crypto industry by providing a less restrictive regulatory environment.
“The US favors letting the private sector innovate, especially with USD-backed stablecoins, which it believes can expand dollar dominance globally. This approach avoids centralization while still enabling digital payments innovation. It’s very much a “let the market lead” philosophy. In my opinion, the way to go with crypto,” Termaaten told BeInCrypto.
Should the US continue developing crypto-friendly legislation, it will quickly position itself to outpace Europe in this regulatory race.
“The EU still leads in terms of finalized law (MiCA), but the US is regaining ground by openly backing the crypto industry and promising regulatory clarity. If that clarity turns into actual, friendly regulation, the US will become more attractive than the EU– especially for developers and fintech firms who value speed and scale + access to more venture capital,” Termaaten said, adding that, “While the EU is a large crypto market, the US still dominates in capital, user base, and market liquidity.”
This contrasting approach, favoring a more agile and less burdensome regulatory environment, illustrates the fundamental differences in how each jurisdiction envisions the future of digital finance.
Will the US or EU Ultimately Secure Global Leadership?
While the European Union secured an early advantage in the global crypto regulatory landscape through the comprehensive and unified framework of MiCA, its thoroughness and the significant financial investment required for licensing have inadvertently created barriers to rapid innovation.
This situation has opened a window of opportunity for the United States, particularly with the shift in administration under Trump. By adopting a more permissive and innovation-centric approach, dismantling perceived regulatory obstacles, and prioritizing private blockchain development, the US is quickly emerging as the preferred jurisdiction for crypto innovation.
Despite Europe’s regulatory clarity, the US’s focus on flexibility, coupled with its robust capital markets and extensive user base, positions it to potentially eclipse the EU as the true leader in fostering the next wave of crypto advancements, provided it can deliver on its promise of clear and supportive legislation.
Disclaimer
Following the Trust Project guidelines, this feature article presents opinions and perspectives from industry experts or individuals. BeInCrypto is dedicated to transparent reporting, but the views expressed in this article do not necessarily reflect those of BeInCrypto or its staff. Readers should verify information independently and consult with a professional before making decisions based on this content. Please note that our Terms and Conditions, Privacy Policy, and Disclaimers have been updated.

Canary Capital has filed a Form S-1 registration with the US Securities and Exchange Commission (SEC) to launch a spot exchange-traded fund (ETF) focused on Tron (TRX).
The proposal, submitted on April 18, is the first of its kind to offer investors exposure to TRX’s market performance while also providing staking rewards. This sets the fund apart from previous spot crypto ETF proposals.
Canary Capital’s TRX ETF Could Test SEC Stance on Staking Assets
The filing designates BitGo Trust Company as the custodian for TRX holdings and appoints Canary Capital as the fund’s sponsor.
Justin Sun, the founder of Tron, weighed in on the development, encouraging US investors to act promptly. He emphasized TRX’s potential for long-term growth and suggested institutional interest would likely surge if the ETF is approved.
“US VCs should start buying TRX — and fast. Don’t wait until it’s too late. TRX is a price that only moves one way: up,” Sun said on X.
According to BeInCrypto data, TRX is currently the ninth-largest crypto by market capitalization, valued at approximately $22.94 billion.
Moreover, Tron’s blockchain has gained strong traction in stablecoin settlements, ranking second only to Ethereum. Its efficiency in processing fast and low-cost transactions has made it a preferred choice for Tether’s USDT, based on data from DeFiLlama.

While the proposal has created a buzz in the market, questions remain over its chances of gaining regulatory approval. The inclusion of staking within the ETF is a bold move, but the SEC has historically opposed similar features in other crypto funds.
The SEC has flagged staking services within investment products as potential unregistered securities, leading to increased scrutiny.
Due to this, past Ethereum ETF proposals were forced to remove staking components to align with regulatory expectations.
Nonetheless, several firms, including Grayscale, continue to push for altcoin ETFs that incorporate staking or offer broader asset exposure.
Still, regulatory uncertainty clouds the Canary TRX ETF proposal, especially in light of past controversies involving Justin Sun. The network has also faced allegations of being used by illicit actors, claims it has publicly denied.
If approved, Canary Capital’s ETF would mark a historic milestone by combining exposure to TRX with staking rewards. This structure could attract both retail and institutional investors seeking yield alongside market performance.
Disclaimer
In adherence to the Trust Project guidelines, BeInCrypto is committed to unbiased, transparent reporting. This news article aims to provide accurate, timely information. However, readers are advised to verify facts independently and consult with a professional before making any decisions based on this content. Please note that our Terms and Conditions, Privacy Policy, and Disclaimers have been updated.
XRP ETF Approval Could Spark a ‘Perfect Storm’ for Ripple Coin: Expert
Cardano (ADA) Moves Sideways, But Bullish Shift May Be Brewing

MiCA vs Trump’s Crypto Policy: Battle for Crypto Dominance

Ethereum Trades At Bear Market Lows: Fundamentals Signal Major Undervaluation

Canary Capital Aims to Launch TRON-Focused ETF

Cardano Price To Hit $4 If This Happens, Analyst Says Despite 180M ADA Dump

2.52 Million Altcoins Are Ruining Crypto’s Future

Animoca Brands Valuation Tanks 75% In Two Years, Here’s Why

Crypto exchange BingX hacked for $43 million

Are The Big Players Losing Interest?

Hong Kong’s Securities Association Tips Authorities On Crypto Self-Regulation

Coinbase cbBTC Set to go Live on Solana
2.52 Million Altcoins Are Ruining Crypto’s Future
Animoca Brands Valuation Tanks 75% In Two Years, Here’s Why
Crypto exchange BingX hacked for $43 million
Are The Big Players Losing Interest?
Hong Kong’s Securities Association Tips Authorities On Crypto Self-Regulation
Coinbase cbBTC Set to go Live on Solana
-

 Market14 hours ago
Pi Network Roadmap Frustrates Users Over Missing Timeline
-
 Altcoin22 hours ago
Ethereum ETFs Record $32M Weekly Outflow; ETH Price Crash To $1.1K Imminent?
-
 Altcoin18 hours ago
XRP Price History Signals July As The Next Bullish Month
-

 Market15 hours ago
MEME Rallies 73%, BONE Follows
-

 Ethereum21 hours ago
Ethereum Price Stalls In Tight Range – Big Price Move Incoming?
-

 Market13 hours ago
Solana (SOL) Price Rises 13% But Fails to Break $136 Resistance
-
 Market20 hours ago
How $31 Trillion in US Bonds Could Impact Crypto Markets in 2025
-

 Bitcoin20 hours ago
What Does This Mean for Altcoins?