
Market
5 Meme Coins to Watch in December 2024

November proved to be a turning point for the crypto market, and meme coins emerged as one of the best-performing sectors. In the last four weeks, following Bitcoin’s rise to $99,595, many unexpected meme tokens took the top spot, outperforming major altcoins.
Thus, BeInCrypto has analyzed five meme tokens that are showing signs of potentially becoming a top performer in the month of December.
Department of Government Efficiency (DOGE(GOV))
DOGE(GOV) reached an all-time high (ATH) of $0.545 in November, fueled by heightened interest in the US Presidential Elections. The hype surrounding the political conditions and the involvement of key figures has created a strong surge for the meme coin. However, some analysts suggest that this ATH may not be at its peak yet.
With Donald Trump’s anticipated return to office in January, alongside his announcement of the Department of Government Efficiency, led by Elon Musk, the momentum for DOGE(GOV) could intensify. Musk’s influence, combined with Trump’s backing, creates a unique synergy that could drive DOGE(GOV) to unprecedented heights. This connection may further fuel the coin’s potential rise.
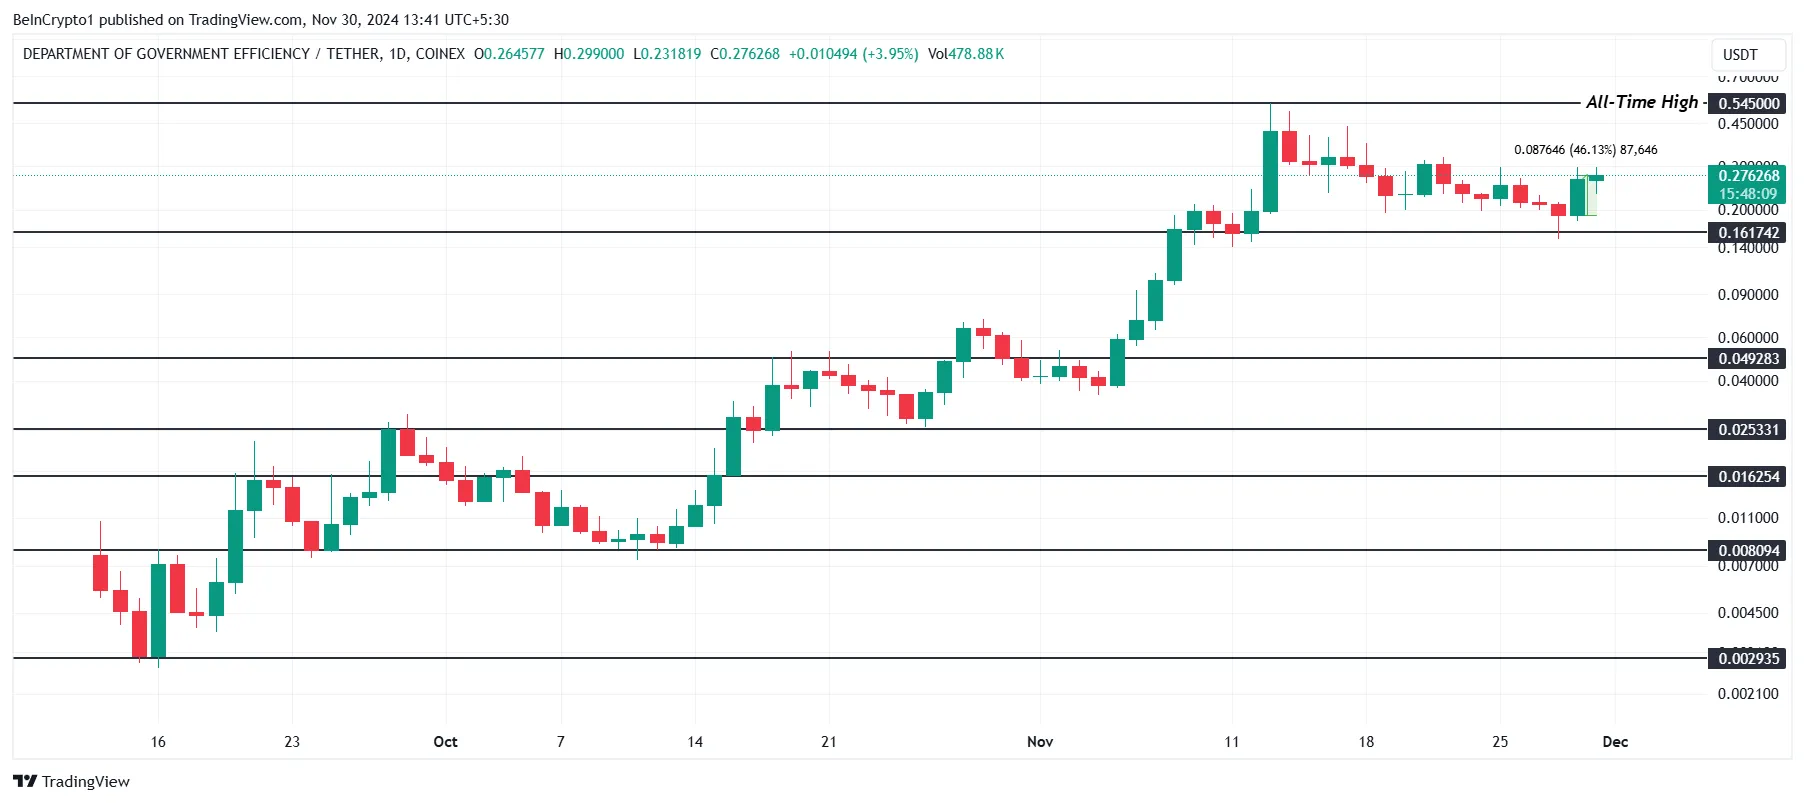
Given the rapid growth of DOGE(GOV) and a 46% increase in value over the past 24 hours, it’s likely that the cryptocurrency will reach a new ATH by December. If this momentum continues, a surge toward the $1 mark seems achievable.
Bonk (BONK)
BONK reached an all-time high (ATH) of $0.00006230 earlier this month before experiencing a drawdown to $0.00004607. This fluctuation is common for meme coins, reflecting high volatility in short periods. Despite the dip, BONK continues to hold significant potential as market conditions shift.
As a Solana-based meme coin, BONK stands to benefit from the hype surrounding Solana ETFs. Given its connection to the Solana ecosystem, any positive movement for SOL could trigger a price surge for BONK. Market sentiment surrounding Solana is expected to influence the future direction of BONK’s price in the coming days.
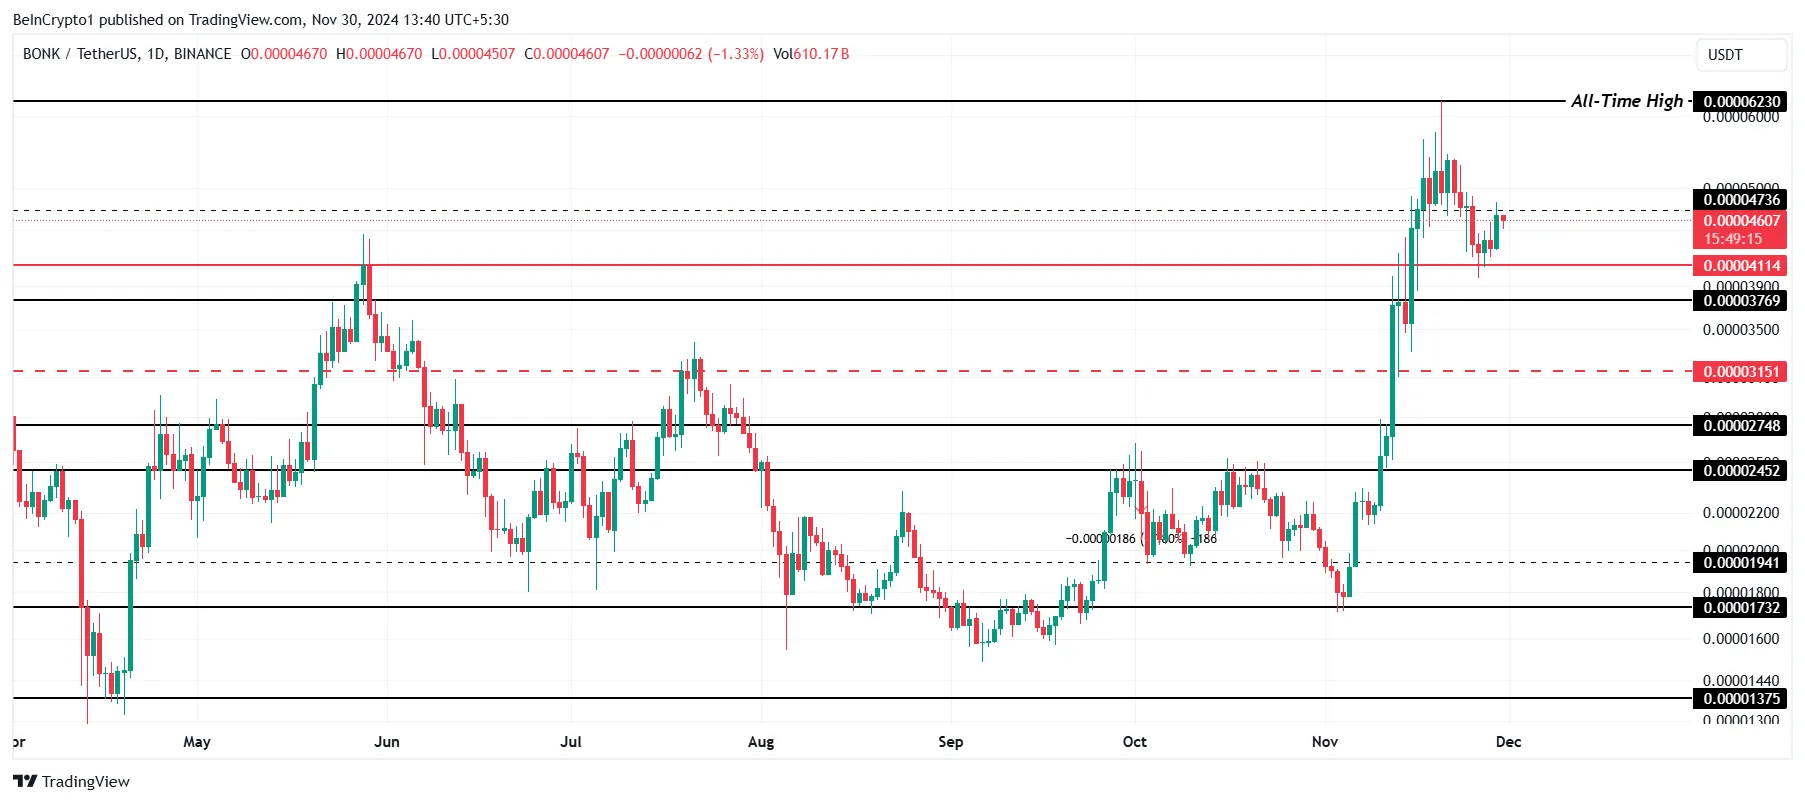
Currently, BONK faces resistance at $0.00004736. If it fails to break this barrier, it could trigger a price pullback, stalling any bullish momentum. A failure to breach this level could hinder its attempt to form a new ATH, with potential downside risks for the coin.
Peanut the Squirrel (PNUT)
PNUT has emerged as one of the best-performing crypto assets this month, rallying by an impressive 1,416% in just one week. The meme coin reached an all-time high (ATH) of $2.50, capturing significant investor attention. This rapid price surge highlights the volatile yet high-reward potential of meme coins.
At the time of writing, PNUT is trading at $1.24, holding above critical support at $1.06. This support level is essential to maintain the coin’s upward trajectory. As long as it stays above this threshold, PNUT is likely to avoid a significant decline, preserving its bullish momentum for the near future.
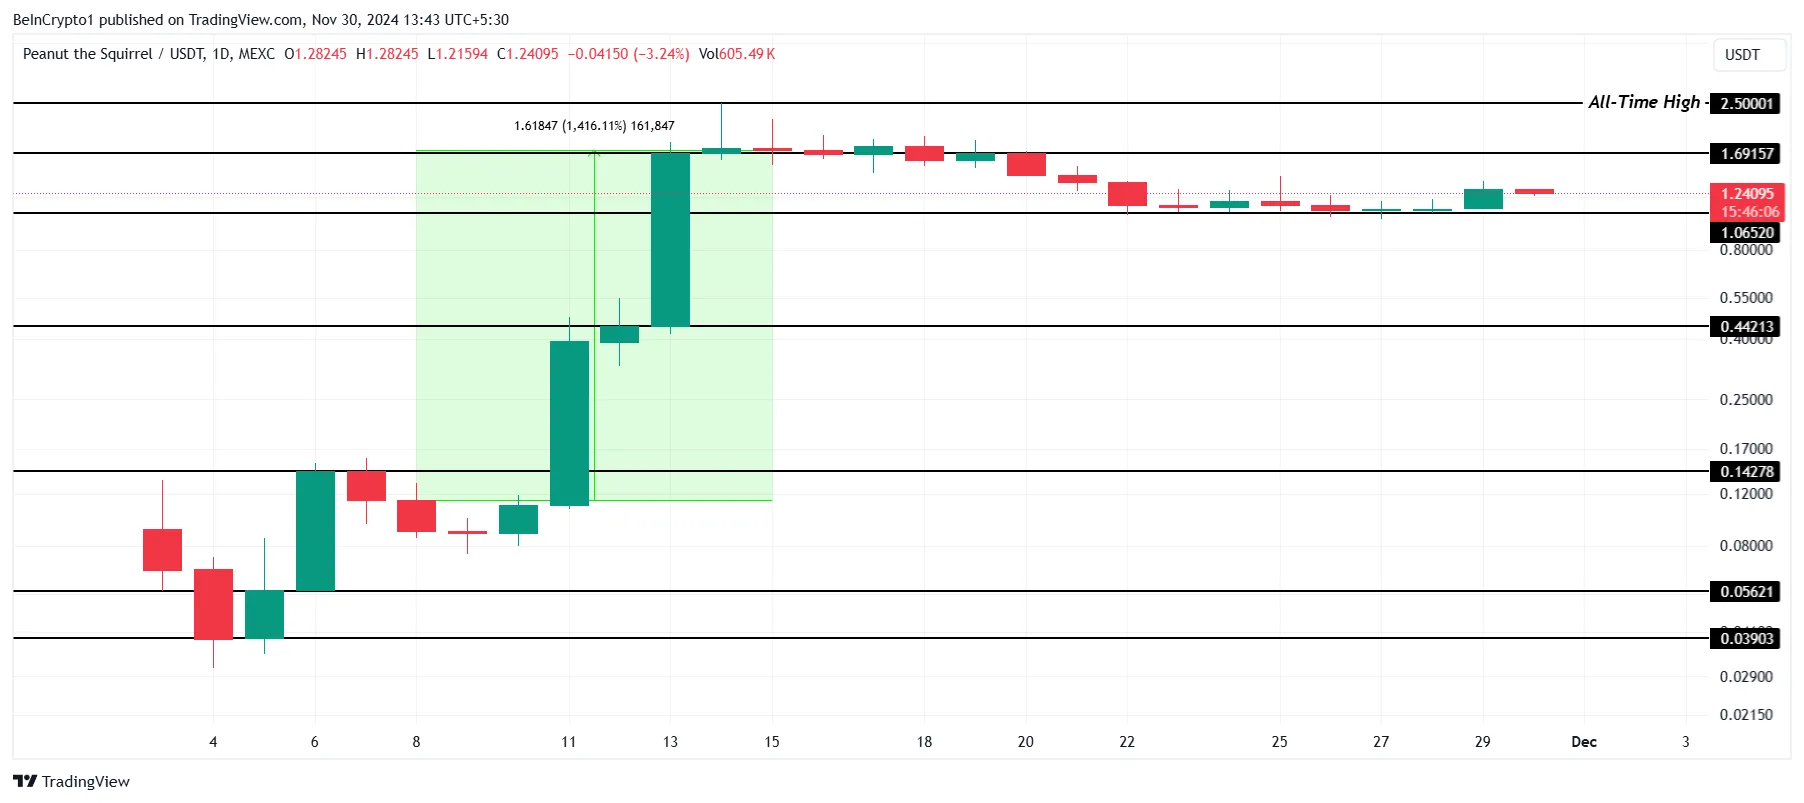
The continued strength of PNUT’s bullish trend in November suggests the price could rise further. However, if the support at $1.06 is lost, the outlook could turn bearish. In that case, the price might decline to $0.44, invalidating the current bullish scenario and shifting the market sentiment.
Act 1: The AI Prophecy (ACT)
ACT is positioned at the intersection of two booming sectors in the cryptocurrency market — Artificial Intelligence (AI) and meme coins. This unique combination gives ACT a distinct advantage, as it appeals to investors looking to capitalize on both technological innovation and the viral nature of meme-driven assets.
ACT’s performance has already demonstrated the potential of its dual-sector strategy. In early November, the altcoin surged by 3,044% within a week. Over the past 24 hours, ACT experienced a 66% increase in price, showcasing its volatility and the high reward potential that often accompanies meme coins tied to trending technologies like AI.
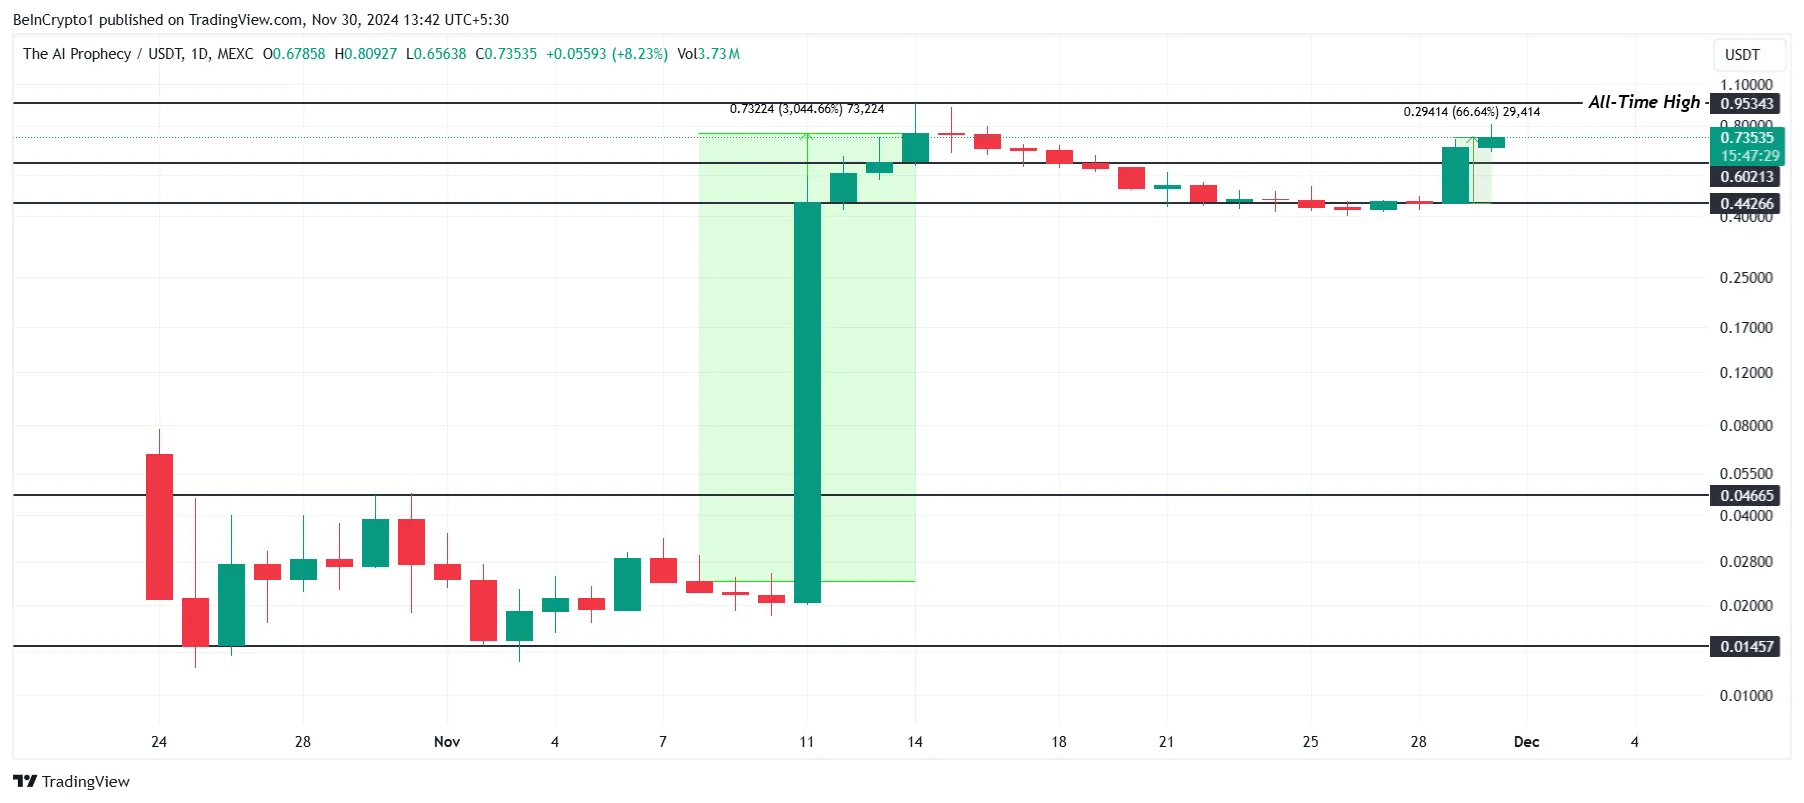
As ACT approaches its all-time high (ATH) of $0.95, the coin faces an important threshold. If it successfully breaches this resistance, ACT could surpass $1.00, driving further gains. However, if profit-taking begins to dominate, the price could drop below the critical support of $0.44, potentially invalidating the current bullish outlook.
Pepe (PEPE)
PEPE saw an unexpected surge in November, climbing nearly 84% within just 48 hours. This rapid increase helped the meme coin reach an all-time high (ATH) of $0.00002597, surprising investors and sparking renewed interest in the coin. Its performance highlights the volatile nature of meme coins in the crypto market.
Currently trading at $0.00002091, PEPE has found support above the level of $0.00001677. This support is crucial to maintaining its bullish momentum. If the price drops below this level, it could signal significant losses for investors, leading to a shift in market sentiment and potentially further declines.
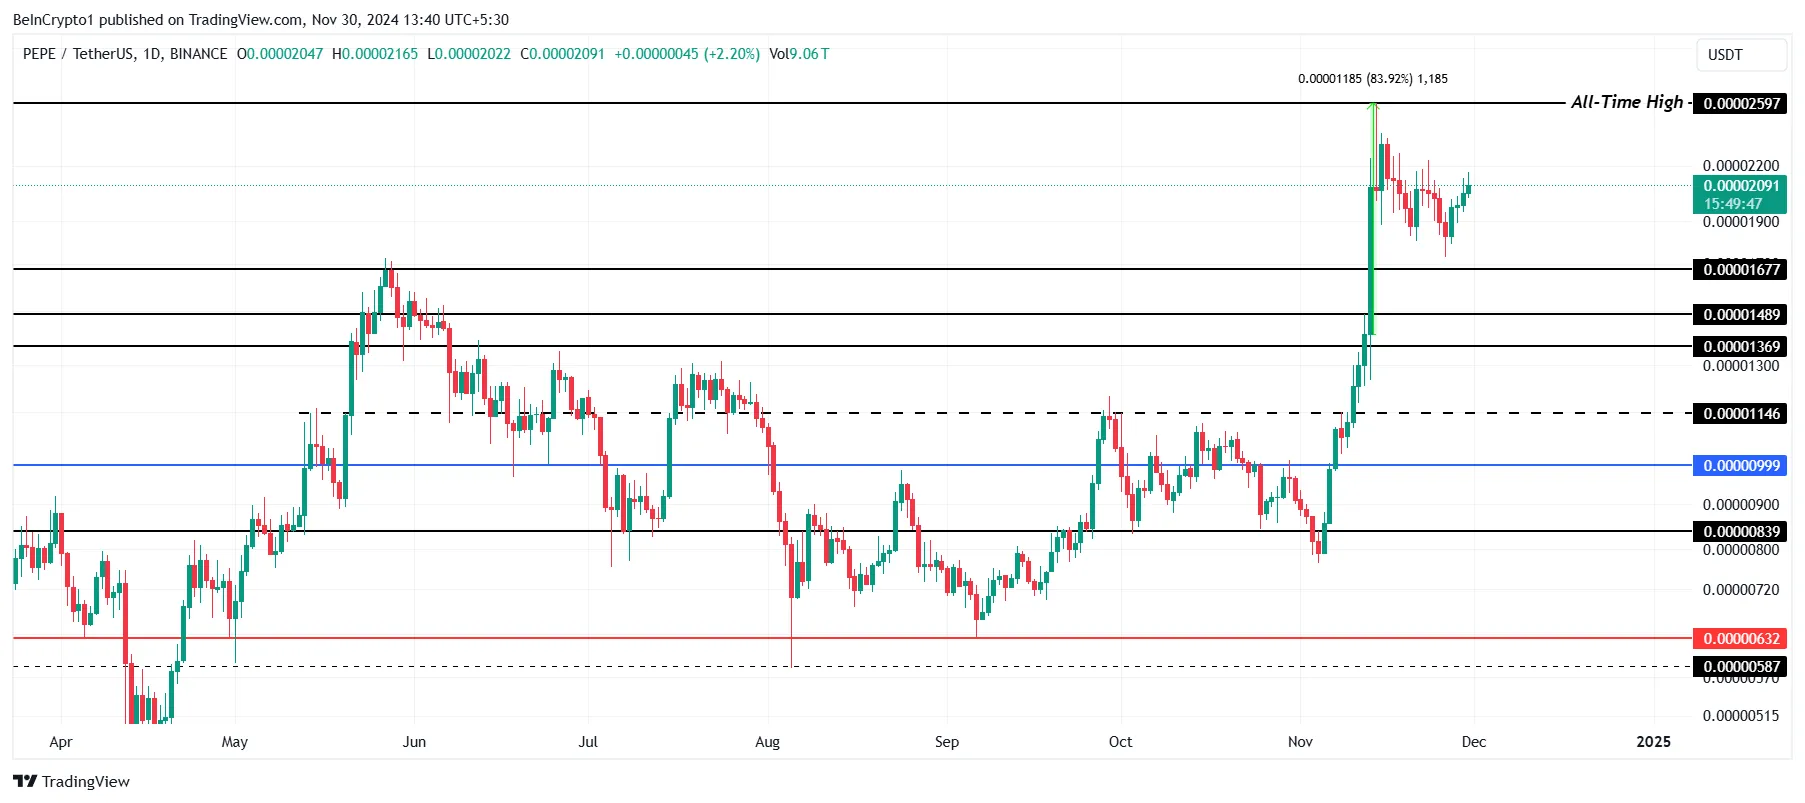
If PEPE remains a trending token, it could capitalize on the ongoing hype surrounding meme coins. This continued interest might drive the price back toward its ATH. As long as the coin holds above key support levels, there is potential for PEPE to revisit previous highs, benefiting from its meme-driven popularity.
Disclaimer
In line with the Trust Project guidelines, this price analysis article is for informational purposes only and should not be considered financial or investment advice. BeInCrypto is committed to accurate, unbiased reporting, but market conditions are subject to change without notice. Always conduct your own research and consult with a professional before making any financial decisions. Please note that our Terms and Conditions, Privacy Policy, and Disclaimers have been updated.


Reason to trust
![]()
Strict editorial policy that focuses on accuracy, relevance, and impartiality
Created by industry experts and meticulously reviewed
The highest standards in reporting and publishing
Strict editorial policy that focuses on accuracy, relevance, and impartiality
Morbi pretium leo et nisl aliquam mollis. Quisque arcu lorem, ultricies quis pellentesque nec, ullamcorper eu odio.
Ethereum price started a increase from the $1,550 zone. ETH is now rising and might attempt to recover above the $1,650 resistance.
- Ethereum started a fresh increase above the $1,580 and $1,600 levels.
- The price is trading above $1,600 and the 100-hourly Simple Moving Average.
- There was a break above a connecting bearish trend line with resistance at $1,590 on the hourly chart of ETH/USD (data feed via Kraken).
- The pair could start a fresh increase if it clears the $1,650 resistance zone.
Ethereum Price Eyes Upside Break
Ethereum price remained stable above the $1,500 level and started a fresh increase, like Bitcoin. ETH traded above the $1,550 and $1,600 levels to enter a short-term positive zone.
There was a break above a connecting bearish trend line with resistance at $1,590 on the hourly chart of ETH/USD. The pair even cleared the $1,620 resistance. A high was formed at $1,644 and the price is stable above the 23.6% Fib retracement level of the upward move from the $1,566 swing low to the $1,644 high.
Ethereum price is now trading above $1,600 and the 100-hourly Simple Moving Average. On the upside, the price seems to be facing hurdles near the $1,640 level. The next key resistance is near the $1,650 level. The first major resistance is near the $1,680 level.

A clear move above the $1,680 resistance might send the price toward the $1,720 resistance. An upside break above the $1,720 resistance might call for more gains in the coming sessions. In the stated case, Ether could rise toward the $1,800 resistance zone or even $1,840 in the near term.
Downside Correction In ETH?
If Ethereum fails to clear the $1,650 resistance, it could start a downside correction. Initial support on the downside is near the $1,620 level. The first major support sits near the $1,605 zone and the 50% Fib retracement level of the upward move from the $1,566 swing low to the $1,644 high.
A clear move below the $1,605 support might push the price toward the $1,580 support. Any more losses might send the price toward the $1,550 support level in the near term. The next key support sits at $1,500.
Technical Indicators
Hourly MACD – The MACD for ETH/USD is gaining momentum in the bullish zone.
Hourly RSI – The RSI for ETH/USD is now above the 50 zone.
Major Support Level – $1,600
Major Resistance Level – $1,650
Barry Silbert, CEO of Digital Currency Group, has stated that Bittensor (TAO) has the potential to outperform Bitcoin (BTC) as a global store of value.
His comments come amid notable growth in the Bittensor network, with its subnet ecosystem market capitalization and the TAO token’s price on the rise.
Will Bittensor’s Decentralized AI Model Outperform Bitcoin’s Legacy?
In a recent interview with Raoul Pal, Silbert highlighted the growing influence of artificial intelligence (AI) in the crypto sector. According to him, Bittensor is at the forefront of this revolution, representing the “next big era for crypto.”
“You had the Bitcoin and the Ethereum and the NFTs, and you had the layer 2s and DeFi. I think this is the next big investment theme for crypto,” Silbert stated.
He went on to explain that Bittensor shares the same pioneering spirit as early Bitcoin. Still, its purpose extends beyond financial sovereignty.
“The boldest prediction that I could make for Bittensor is it could be a better version of Bitcoin as a global store of value,” he claimed.
He argued that instead of the $10 to $12 billion spent annually to secure the Bitcoin network, that same amount could be redirected toward incentivizing a global network of individuals working to solve major world problems. He envisions this money fostering innovation on a massive scale, with the potential to grow into a multi-billion-dollar ecosystem.
While acknowledging the value of securing the Bitcoin network, Silbert emphasized that Bittensor’s potential lies in its ability to harness this vast financial backing to address real-world challenges.
He noted that Bittensor operates on a similar economic model to Bitcoin, with halving mechanisms and decentralization, positioning it as a powerful contender in the quest for a more impactful and value-driven global network.
Silbert also noted that while plenty of decentralized AI projects have emerged, Bittensor has set itself apart. He referred to it as having reached “escape velocity.” This term is used to convey a project’s rapid growth and increasing market influence.
“99.9% of crypto tokens that are out there have no reason to exist and are worthless,” he added.
Market data reflects the growing enthusiasm for Bittensor. Notably, amid the ongoing volatility, TAO has fared well in comparison to the broader market, rising 32.1% in the last week. At press time, the altcoin was trading at $328, up 7.2% over the past day.

Additionally, TAO is currently the top trending cryptocurrency on CoinGecko, underlining its rising popularity among investors. Google Trends data further proves the growing interest in Bittensor. The search volume peaked at 100 at the time of writing.
Meanwhile, the Bittensor ecosystem is also seeing notable progress. The latest data indicated that the market capitalization of Bittensor’s subnet tokens more than doubled in April 2025.

It increased by 166%, rising from $181 million at the beginning of April to $481 million at press time. As reported by BeInCrypto, this growth follows a tripling of active subnets over the past year.
Disclaimer
In adherence to the Trust Project guidelines, BeInCrypto is committed to unbiased, transparent reporting. This news article aims to provide accurate, timely information. However, readers are advised to verify facts independently and consult with a professional before making any decisions based on this content. Please note that our Terms and Conditions, Privacy Policy, and Disclaimers have been updated.

Aayush Jindal, a luminary in the world of financial markets, whose expertise spans over 15 illustrious years in the realms of Forex and cryptocurrency trading. Renowned for his unparalleled proficiency in providing technical analysis, Aayush is a trusted advisor and senior market expert to investors worldwide, guiding them through the intricate landscapes of modern finance with his keen insights and astute chart analysis.
From a young age, Aayush exhibited a natural aptitude for deciphering complex systems and unraveling patterns. Fueled by an insatiable curiosity for understanding market dynamics, he embarked on a journey that would lead him to become one of the foremost authorities in the fields of Forex and crypto trading. With a meticulous eye for detail and an unwavering commitment to excellence, Aayush honed his craft over the years, mastering the art of technical analysis and chart interpretation.
As a software engineer, Aayush harnesses the power of technology to optimize trading strategies and develop innovative solutions for navigating the volatile waters of financial markets. His background in software engineering has equipped him with a unique skill set, enabling him to leverage cutting-edge tools and algorithms to gain a competitive edge in an ever-evolving landscape.
In addition to his roles in finance and technology, Aayush serves as the director of a prestigious IT company, where he spearheads initiatives aimed at driving digital innovation and transformation. Under his visionary leadership, the company has flourished, cementing its position as a leader in the tech industry and paving the way for groundbreaking advancements in software development and IT solutions.
Despite his demanding professional commitments, Aayush is a firm believer in the importance of work-life balance. An avid traveler and adventurer, he finds solace in exploring new destinations, immersing himself in different cultures, and forging lasting memories along the way. Whether he’s trekking through the Himalayas, diving in the azure waters of the Maldives, or experiencing the vibrant energy of bustling metropolises, Aayush embraces every opportunity to broaden his horizons and create unforgettable experiences.
Aayush’s journey to success is marked by a relentless pursuit of excellence and a steadfast commitment to continuous learning and growth. His academic achievements are a testament to his dedication and passion for excellence, having completed his software engineering with honors and excelling in every department.
At his core, Aayush is driven by a profound passion for analyzing markets and uncovering profitable opportunities amidst volatility. Whether he’s poring over price charts, identifying key support and resistance levels, or providing insightful analysis to his clients and followers, Aayush’s unwavering dedication to his craft sets him apart as a true industry leader and a beacon of inspiration to aspiring traders around the globe.
In a world where uncertainty reigns supreme, Aayush Jindal stands as a guiding light, illuminating the path to financial success with his unparalleled expertise, unwavering integrity, and boundless enthusiasm for the markets.

Dollar Dips While Bitcoin Hits New Heights

Ethereum Price Clings to Support—Upside Break Could Trigger Rally

Expert Reveals Why BlackRock Hasn’t Pushed for an XRP ETF
Will Bittensor Surpass Bitcoin as a Store of Value? Expert Predicts

Solana, Bitcoin in Texas, and Initia

XRP Bulls Defend $2.00—Is a Fresh Price Surge Loading?

2.52 Million Altcoins Are Ruining Crypto’s Future

Animoca Brands Valuation Tanks 75% In Two Years, Here’s Why

Crypto exchange BingX hacked for $43 million

Are The Big Players Losing Interest?

Hong Kong’s Securities Association Tips Authorities On Crypto Self-Regulation

Coinbase cbBTC Set to go Live on Solana
2.52 Million Altcoins Are Ruining Crypto’s Future
Animoca Brands Valuation Tanks 75% In Two Years, Here’s Why
Crypto exchange BingX hacked for $43 million
Are The Big Players Losing Interest?
Hong Kong’s Securities Association Tips Authorities On Crypto Self-Regulation
Coinbase cbBTC Set to go Live on Solana
-
 Market18 hours ago
1 Year After Bitcoin Halving: What’s Different This Time?
-

 Market19 hours ago
VOXEL Climbs 200% After Suspected Bitget Bot Glitch
-

 Market22 hours ago
MELANIA Crashes to All-Time Low Amid Insiders Continued Sales
-

 Market17 hours ago
Tokens Big Players Are Buying
-

 Market23 hours ago
Charles Schwab Plans Spot Crypto Trading Rollout in 2026
-
 Altcoin20 hours ago
Binance Traders Go Big On Dogecoin—Majority Holding Long Positions
-

 Market16 hours ago
Dogecoin Defies Bullish Bets During Dogeday Celebration
-

 Ethereum24 hours ago
Ethereum Enters Historic Buy Zone As Price Dips Below Key Level – Insights