
Market
$30.8 Million PEPE Meme Coin Purchase Fuels 81% Rally Hopes

PEPE price is following the broader market cues which are keeping the meme coin from breaking out of a bullish pattern.
However, PEPE holders are optimistic about a rise and are also capitalizing on the low prices despite no similar sentiment being noted from new investors.
PEPE Finds Support
PEPE’s price recovery could be driven by its investors if not by the broader market. The existing holders are actively seeking a bounce back in price, buying over 4 trillion tokens (approximately worth $30.8 million) from exchanges in just three days.
In some cases, supply moving out of exchanges and into investors’ wallets is also considered a sign of concern. However, since there is no instability with any crypto exchange at the moment, this accumulation at a low price signals bullish sentiment among current holders.
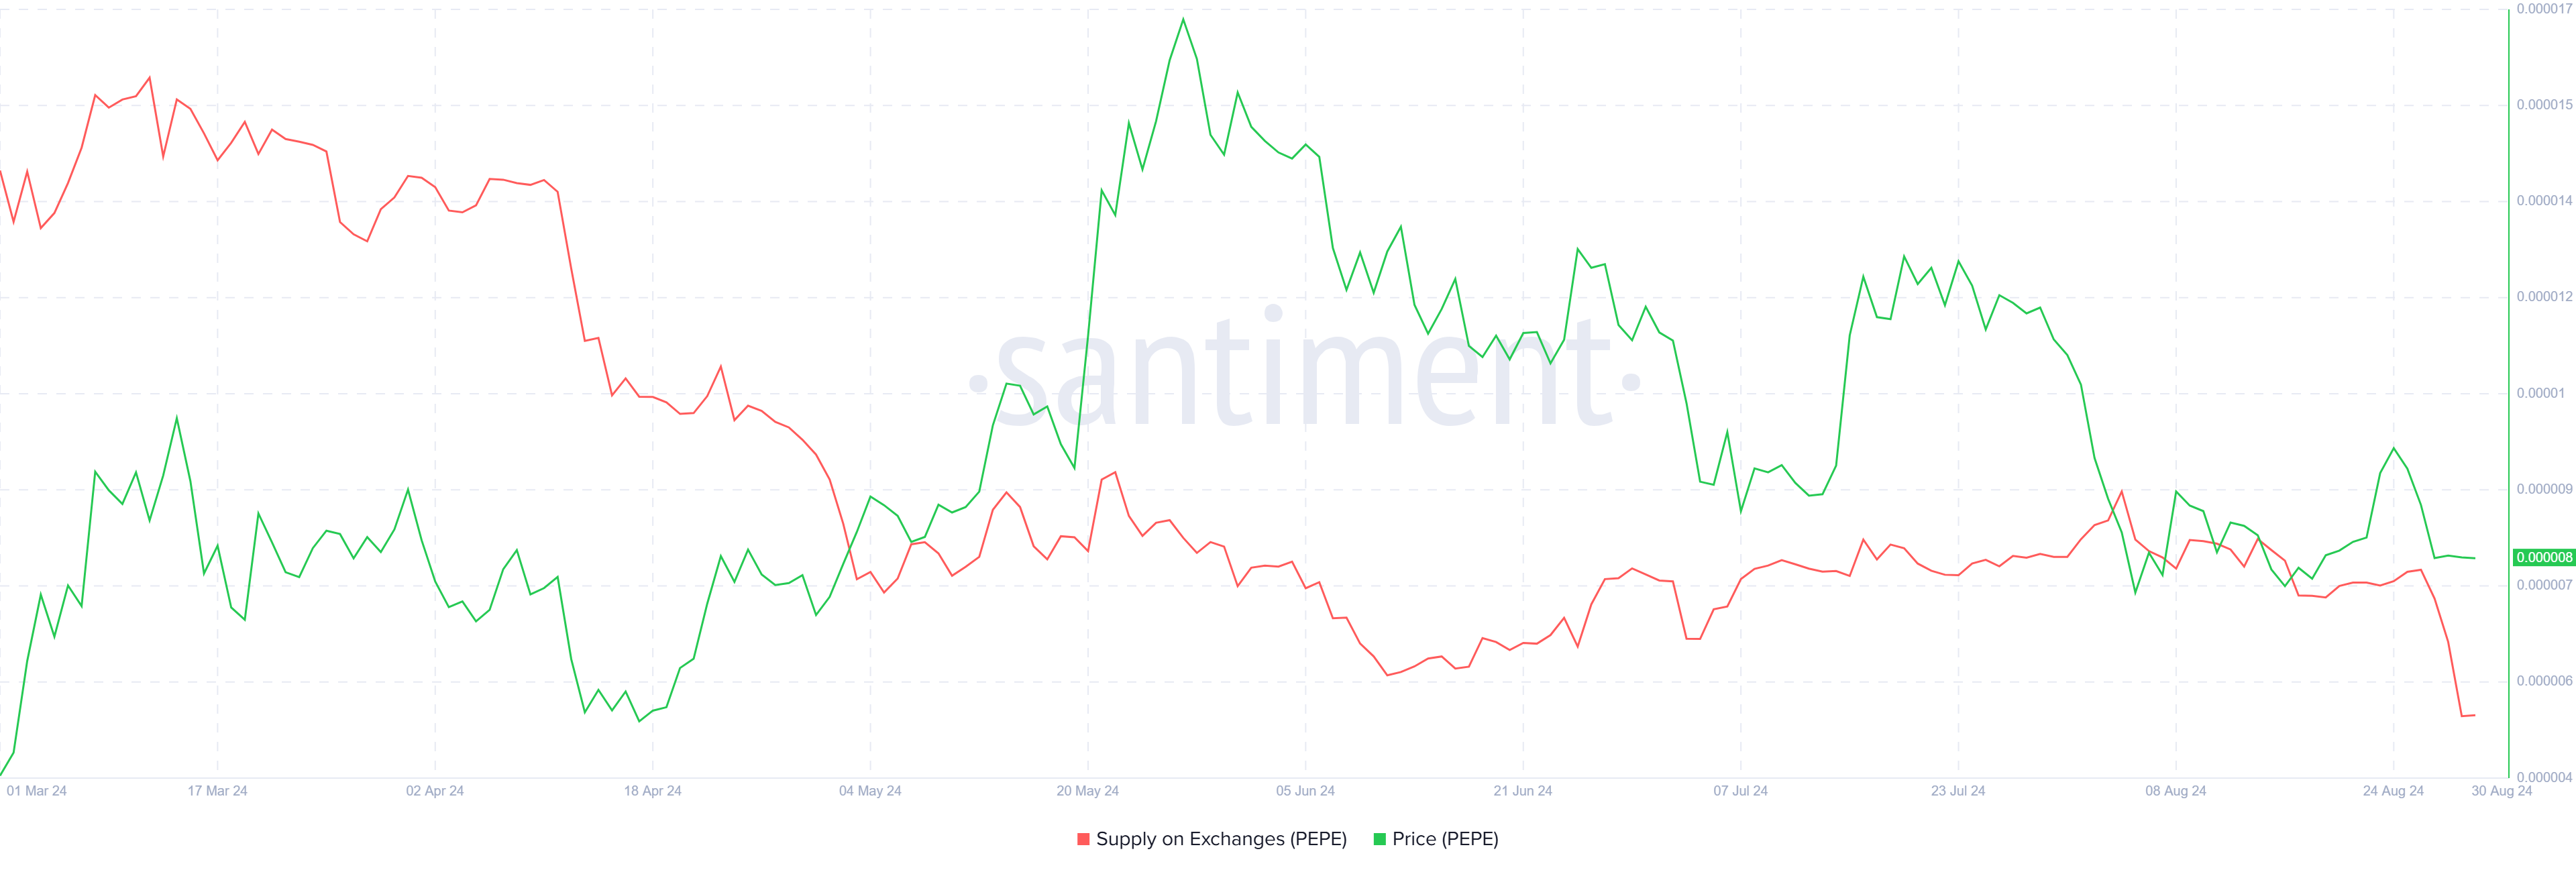
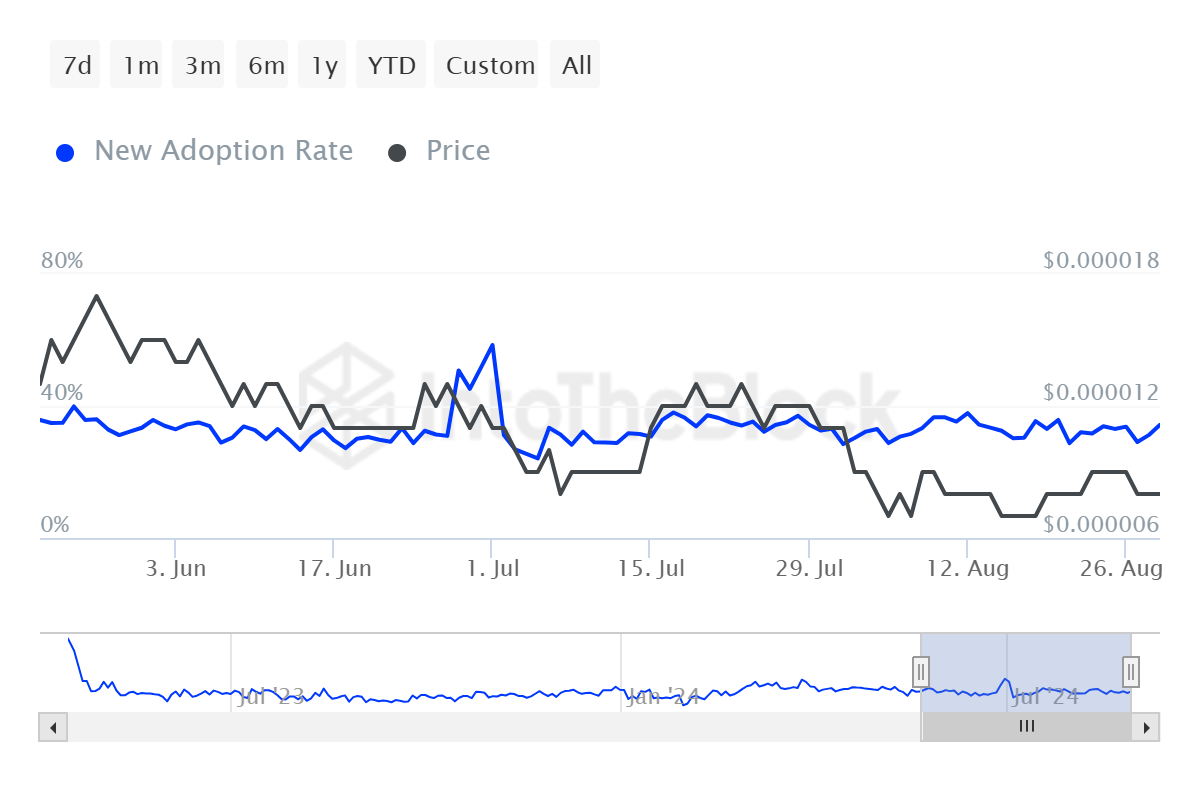
While this buying activity could stabilize PEPE’s price and indicate confidence in its future, there are concerns regarding its traction among new investors. Despite the existing holders’ accumulation, PEPE’s adoption rate remains stagnant, which shows little interest from outside its current investor base.
The lack of new investor interest is troubling, as it suggests that PEPE may struggle to sustain long-term growth. Without fresh capital, the altcoin’s broader market appeal is limited, posing a risk to its future viability.
If PEPE continues to struggle to attract new investors, its momentum could falter, potentially leading to a price collapse.
Read more: Pepe: A Comprehensive Guide to What It Is and How It Works
PEPE Price Prediction: Preventing a Decline
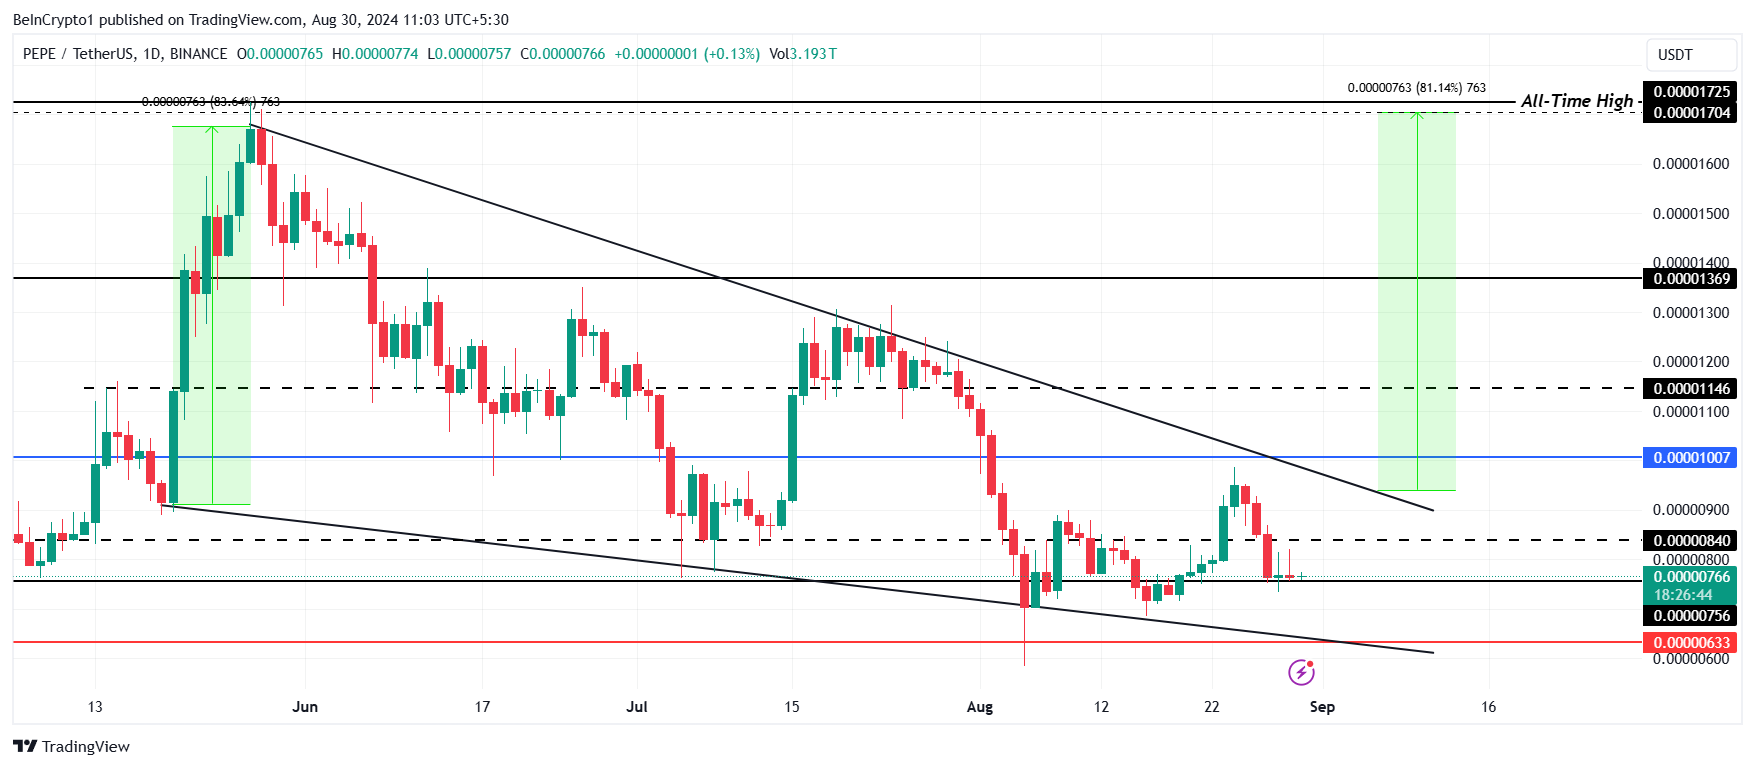
PEPE price is currently only focused on bouncing off the support at $0.00000756. Trading at $0.00000766 at the time of writing, the meme coin has been holding above this support level for the last 72 hours.
The mixed sentiments coming from investors could extend this effort, and the meme coin could continue moving sideways. But a jump from this point could help PEPE rise and breach the upper trend line of the descending wedge. This bullish pattern suggests an 81% rally is likely upon breakout, which could bring it closer to the all-time high of $0.00001725.
Read more: Pepe (PEPE) Price Prediction 2024/2025/2030
On the other hand, there is a chance that demand among PEPE holders will eventually decline. The eventual combination of low traction and low demand could tip the scales in favor of the bears.
As a result, the meme coin will end up falling to test the critical support of $0.00000633. Losing this level would invalidate the bullish thesis completely.
Disclaimer
In line with the Trust Project guidelines, this price analysis article is for informational purposes only and should not be considered financial or investment advice. BeInCrypto is committed to accurate, unbiased reporting, but market conditions are subject to change without notice. Always conduct your own research and consult with a professional before making any financial decisions. Please note that our Terms and Conditions, Privacy Policy, and Disclaimers have been updated.


My name is Godspower Owie, and I was born and brought up in Edo State, Nigeria. I grew up with my three siblings who have always been my idols and mentors, helping me to grow and understand the way of life.
My parents are literally the backbone of my story. They’ve always supported me in good and bad times and never for once left my side whenever I feel lost in this world. Honestly, having such amazing parents makes you feel safe and secure, and I won’t trade them for anything else in this world.
I was exposed to the cryptocurrency world 3 years ago and got so interested in knowing so much about it. It all started when a friend of mine invested in a crypto asset, which he yielded massive gains from his investments.
When I confronted him about cryptocurrency he explained his journey so far in the field. It was impressive getting to know about his consistency and dedication in the space despite the risks involved, and these are the major reasons why I got so interested in cryptocurrency.
Trust me, I’ve had my share of experience with the ups and downs in the market but I never for once lost the passion to grow in the field. This is because I believe growth leads to excellence and that’s my goal in the field. And today, I am an employee of Bitcoinnist and NewsBTC news outlets.
My Bosses and co-workers are the best kinds of people I have ever worked with, in and outside the crypto landscape. I intend to give my all working alongside my amazing colleagues for the growth of these companies.
Sometimes I like to picture myself as an explorer, this is because I like visiting new places, I like learning new things (useful things to be precise), I like meeting new people – people who make an impact in my life no matter how little it is.
One of the things I love and enjoy doing the most is football. It will remain my favorite outdoor activity, probably because I’m so good at it. I am also very good at singing, dancing, acting, fashion and others.
I cherish my time, work, family, and loved ones. I mean, those are probably the most important things in anyone’s life. I don’t chase illusions, I chase dreams.
I know there is still a lot about myself that I need to figure out as I strive to become successful in life. I’m certain I will get there because I know I am not a quitter, and I will give my all till the very end to see myself at the top.
I aspire to be a boss someday, having people work under me just as I’ve worked under great people. This is one of my biggest dreams professionally, and one I do not take lightly. Everyone knows the road ahead is not as easy as it looks, but with God Almighty, my family, and shared passion friends, there is no stopping me.
Over the past week, XRP’s price has remained range-bound amid the broader market’s recovery attempt.
However, with a growing bullish bias toward the altcoin, XRP may be on the brink of breaking free from this range and trending upward. This analysis explains why.
XRP Futures Traders Bet on Upside as Long Positions
The momentum shift towards the bulls has become evident, particularly within the futures market, where long bets on XRP are now surpassing short positions. This is reflected by the token’s XRP’s long/short ratio, which is currently at 1.07.

The long/short ratio measures the proportion of long positions (bets on price increases) to short positions (bets on price declines) in the market.
When its value is below one, it indicates that the number of short positions outweighs long positions in the market, suggesting bearish sentiment or a lack of confidence in the token’s future price performance.
As with XRP, when an asset’s long/short ratio is above one, it means there are more long positions than short ones. It indicates that traders are predominantly bullish on XRP and hints at a higher likelihood of an upward breach of its narrow range.
In addition, XRP’s relative strength index (RSI) has climbed steadily, indicating a gradual rise in demand for the token. The key momentum indicator, at 50.77, currently rests above the neutral line and is in an uptrend.
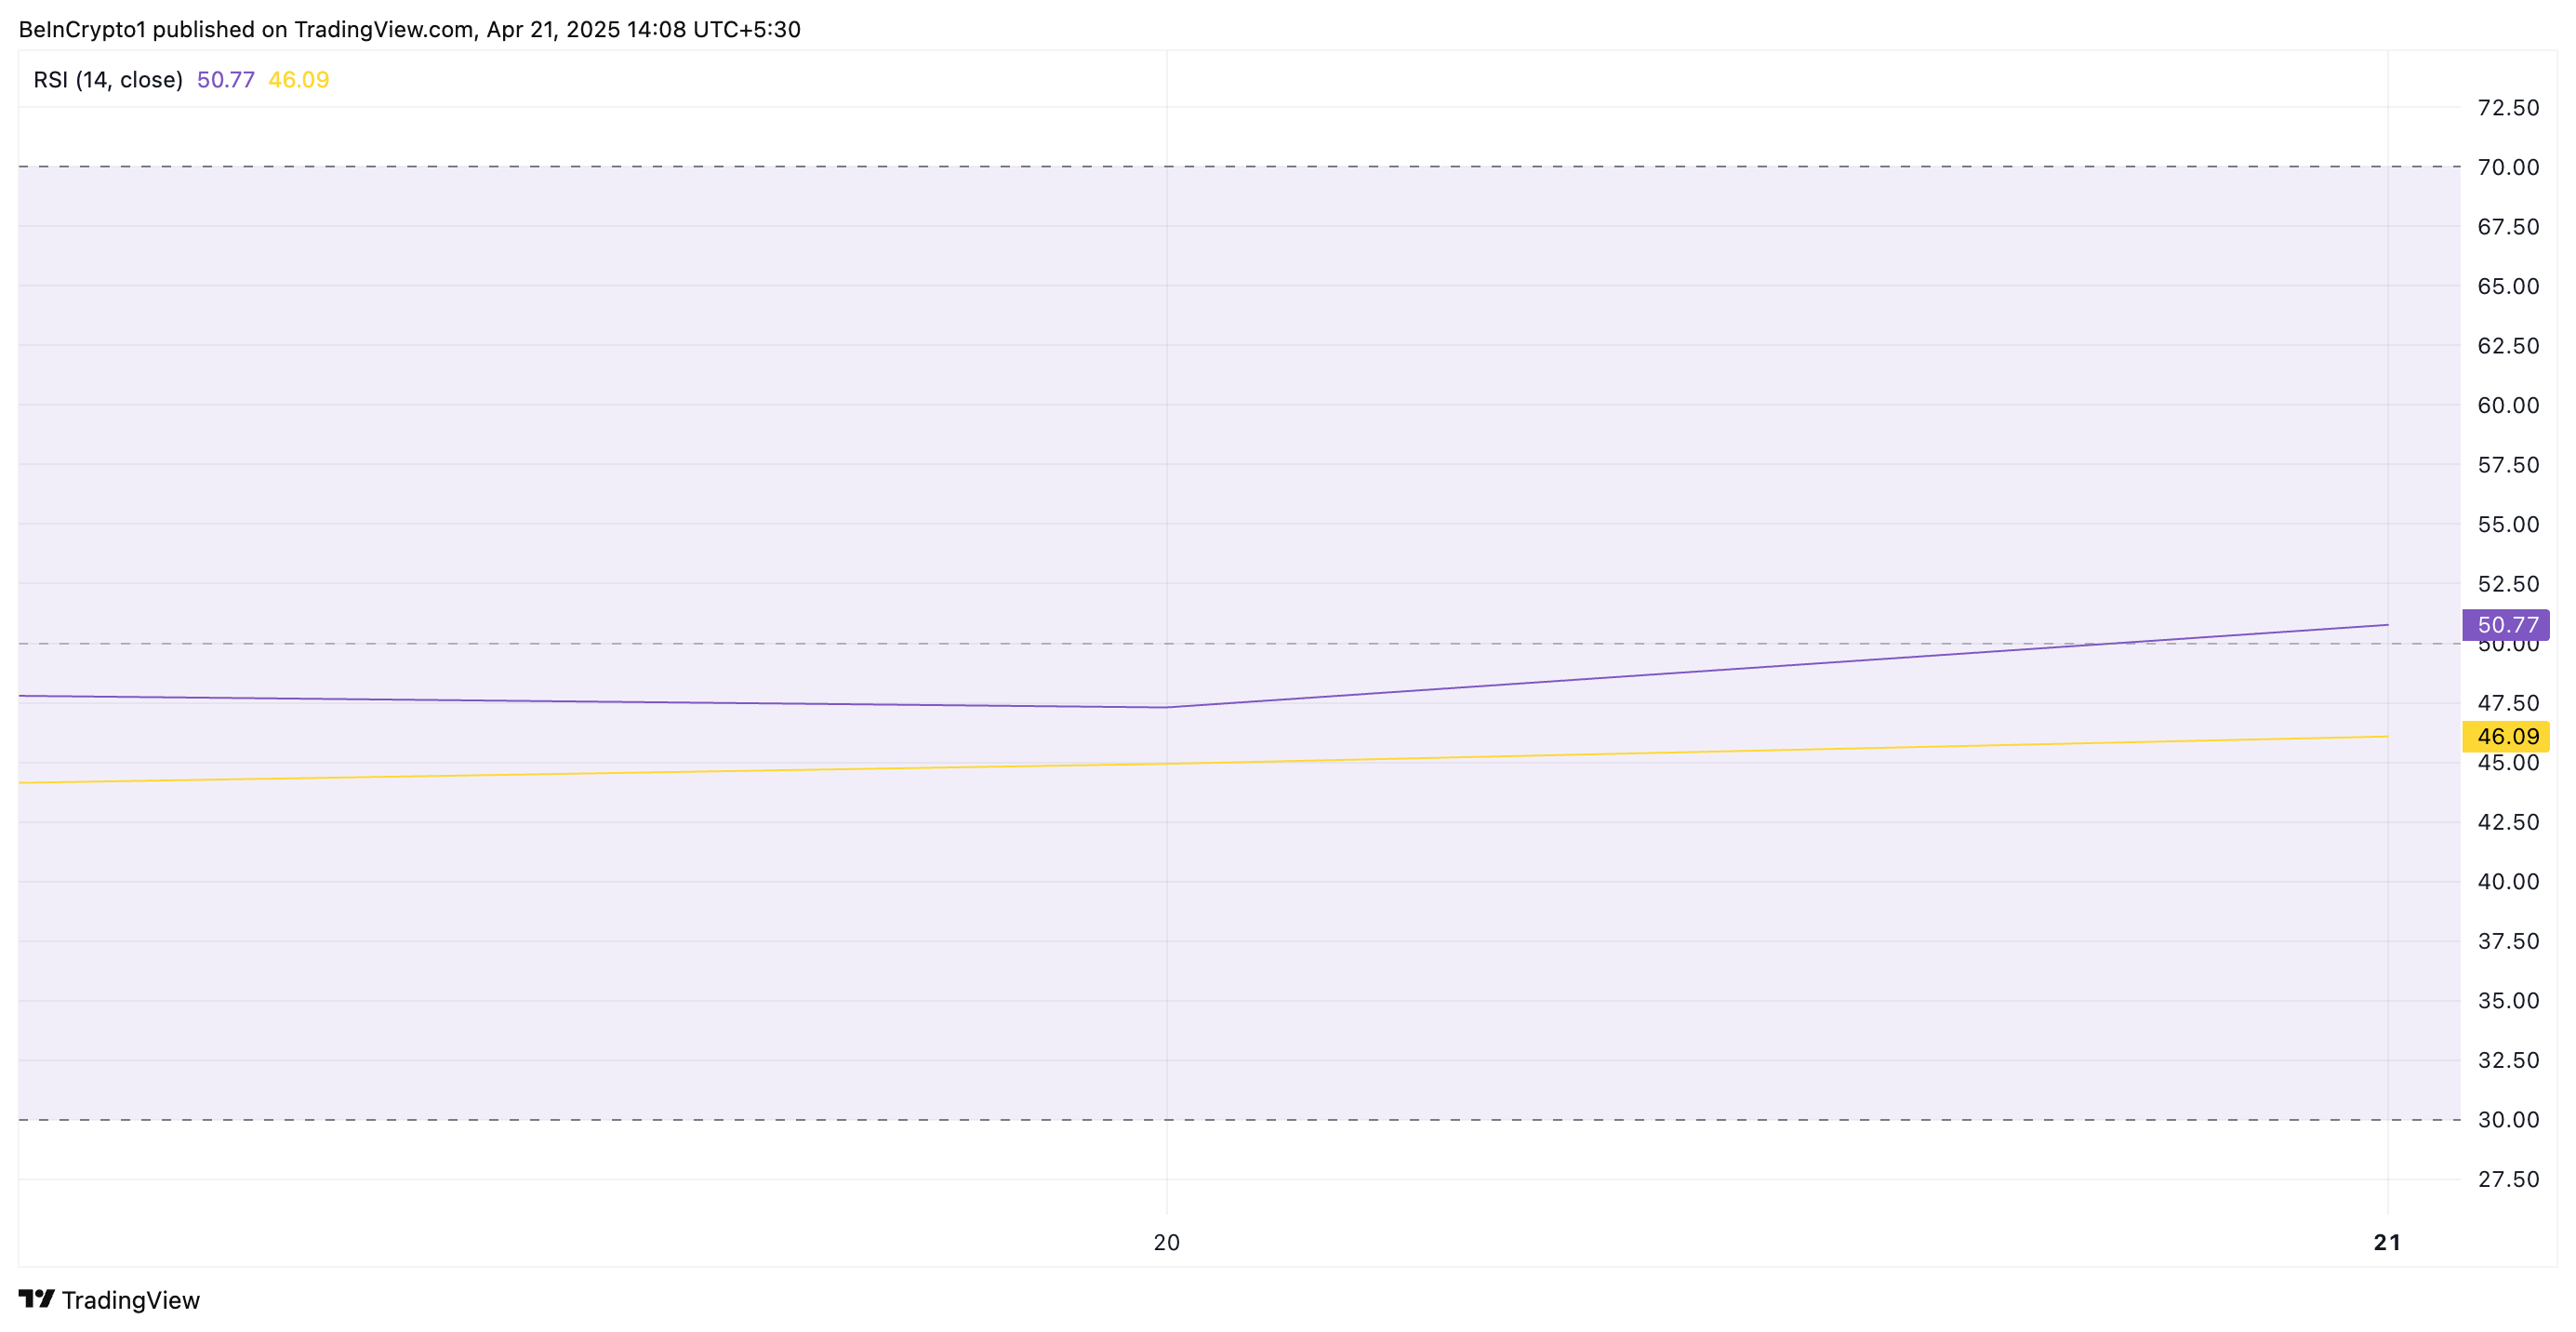
The RSI indicator measures an asset’s overbought and oversold market conditions. It ranges between 0 and 100. Values above 70 suggest that the asset is overbought and due for a price decline, while values under 30 indicate that the asset is oversold and may witness a rebound.
At 50.77, XRP’s RSI signals a shift toward bullish momentum. It indicates that buying pressure is starting to outweigh selling pressure, and the asset may be poised for further price increases.
XRP Eyes $2.18 Resistance as Bulls Look to Push for $2.29
XRP currently trades at $2.13, just 3% away from its next significant resistance level, $2.18. If buying pressure intensifies and the altcoin successfully flips this price point into a support floor, it could trigger further price growth. In this scenario, XRP could potentially climb to $2.29.
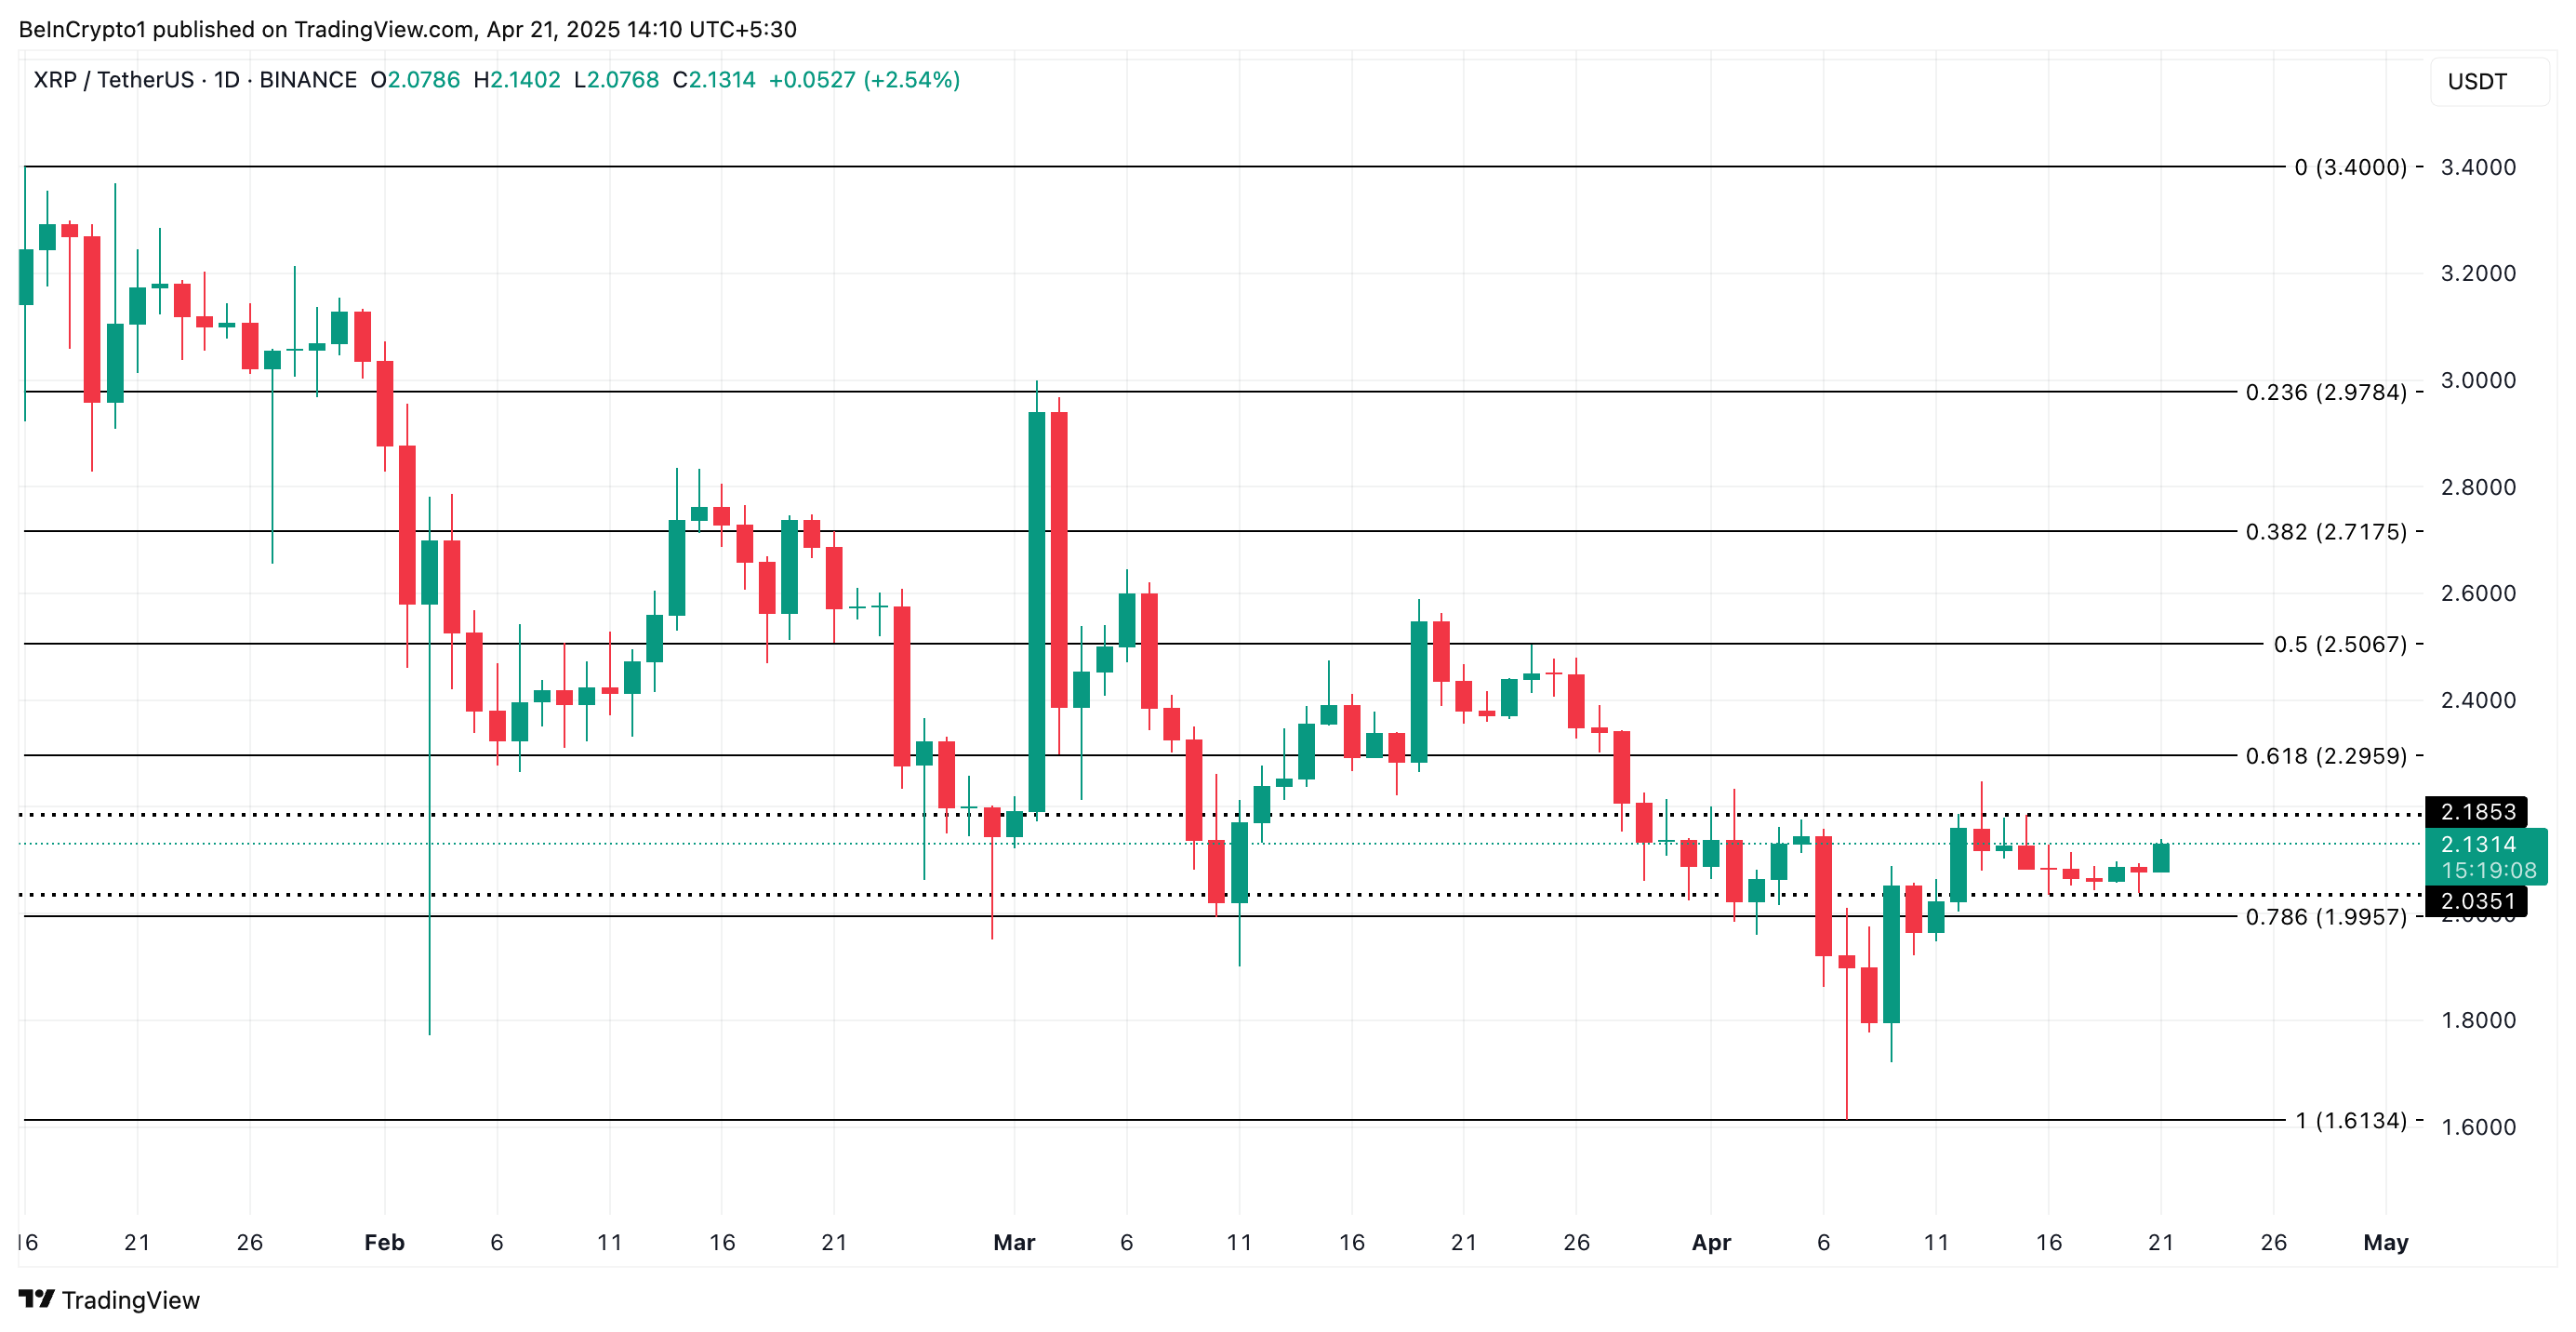
However, if demand weakens and the bears regain control, XRP may remain range-bound. It could even break below the $2.03 support and fall to $1.99.
Disclaimer
In line with the Trust Project guidelines, this price analysis article is for informational purposes only and should not be considered financial or investment advice. BeInCrypto is committed to accurate, unbiased reporting, but market conditions are subject to change without notice. Always conduct your own research and consult with a professional before making any financial decisions. Please note that our Terms and Conditions, Privacy Policy, and Disclaimers have been updated.


The crypto market is attempting a recovery, with Bitcoin (BTC) nearing the $90,000 milestone. Amidst improving sentiment, several startups are launching enticing airdrops, providing crypto enthusiasts with opportunities to engage with budding platforms without initial financial input.
This week, we discuss airdrop participation opportunities from three projects with financial backing from renowned investors.
Optimism
Layer-2 blockchain Optimism is one of the top three crypto airdrops this week. The Optimism crypto airdrop comes after the network raised $267.50 million from key investors such as Andreessen Horowitz, Coinbase Ventures, Paradigm, and IDEO CoLab Ventures, among others.
The airdrop concerns a SuperStacks Campaign, which opened on April 16 and will remain until June 30.
“With many chains building as one, a new network structure is emerging to solve fragmentation in Ethereum. This network is modular, interoperable, and composable by default. We call it the Superchain: and it changes everything,” Optimism explained.
Rewards are in the form of points, awarded for interacting with the projects. Airdrop farmers also get rewarded for providing liquidity to superchains, scalable blockchains combined into a single ecosystem to solve Ethereum fragmentation.
Actual tasks bring 10 EXP (experience points) per $1 of daily liquidity. In the past, Optimism held five airdrops, giving away over 265 million tokens.
“You may be eligible for the 6th airdrop without realizing it. In the system, we collect badges as you perform operations on Optimism. However, since it counts your previous operations when you log in, you may have opened many badges.,” one airdrop farmer explained.
This means even minimal effort could yield rewards. However, participating in the Optimism airdrop does not guarantee future rewards. Instead, it only provides an opportunity to earn points.
Aztec
Another top crypto airdrop to watch this week is Aztec, bringing forth a privacy-focused Layer-2 zero-knowledge (ZK) rollup on Ethereum.
Aztec is backed by $119.1 million in funding from investors such as Andreessen Horowitz (a16z), Paradigm, Consensys, and Coinbase Ventures.
The project has garnered significant attention, following talks of a native AZTEC token and a confirmed retroactive airdrop for early users.
On April 17, the network announced the Aztec Sequencer Form, front-running a public testnet. Interested participants were asked to fill out the form to gain early access to the testnet.
Historically, blockchain projects reward testnet participants with tokens. Based on this, Aztec’s funding and investor backing increase the probability of an airdrop.
Huma Finance
This week, the watchlist also includes Huma Finance, the first PayFi (Payment Finance) network built on Solana. The project focuses on transforming global payment settlements using blockchain technology.
Huma Finance launched the second version of point farming, which is available only on the Solana network. Participants can deposit USDC tokens and earn Feathers (points). Notably, no KYC is needed in this version, and more pools are available.
Recently, the project announced social and deposit quests on Galxe, allowing users to complete these quests and try to win a share of $2,000. Notably, participants should have at least lvl 2 of Web3 Passport.
“Huma 2.0 is The Next Wave! Now anyone can earn real yield and stack rewards, exclusively on Solana. New quest is LIVE on Galxe Quest. Join the PayFi movement for a chance to grab a share of $2000 USDC,” the network shared.
The project also launched a point farming program, in which participants can deposit USDC tokens into one of the pools. For this activity, users must pass KYC.
Meanwhile, Huma Finance boasts up to $46.3 million in funds raised from backers such as HashKey Capital, Circle, ParaFi Capital, and Distributed Global.
Disclaimer
In adherence to the Trust Project guidelines, BeInCrypto is committed to unbiased, transparent reporting. This news article aims to provide accurate, timely information. However, readers are advised to verify facts independently and consult with a professional before making any decisions based on this content. Please note that our Terms and Conditions, Privacy Policy, and Disclaimers have been updated.
Will Cardano Price Break Out Soon? Triangle Pattern Hints at 27% ADA Surge

BNB Springs Back From $531 With Unshaken Bullish Conviction

XRP Futures Traders Increase Bets on Upside

Optimism, Aztec, and Huma Finance

Solana Staking Cap Surpasses Ethereum, But Is This Sustainable?

Dollar Dips While Bitcoin Hits New Heights

2.52 Million Altcoins Are Ruining Crypto’s Future

Animoca Brands Valuation Tanks 75% In Two Years, Here’s Why

Crypto exchange BingX hacked for $43 million

Are The Big Players Losing Interest?

Hong Kong’s Securities Association Tips Authorities On Crypto Self-Regulation

Coinbase cbBTC Set to go Live on Solana
2.52 Million Altcoins Are Ruining Crypto’s Future
Animoca Brands Valuation Tanks 75% In Two Years, Here’s Why
Crypto exchange BingX hacked for $43 million
Are The Big Players Losing Interest?
Hong Kong’s Securities Association Tips Authorities On Crypto Self-Regulation
Coinbase cbBTC Set to go Live on Solana
-
 Market22 hours ago
1 Year After Bitcoin Halving: What’s Different This Time?
-

 Market21 hours ago
Tokens Big Players Are Buying
-

 Market23 hours ago
VOXEL Climbs 200% After Suspected Bitget Bot Glitch
-

 Market20 hours ago
Dogecoin Defies Bullish Bets During Dogeday Celebration
-

 Market18 hours ago
Will XRP Break Support and Drop Below $2?
-

 Market11 hours ago
Bitcoin Price Breakout In Progress—Momentum Builds Above Resistance
-
 Bitcoin8 hours ago
US Economic Indicators to Watch & Potential Impact on Bitcoin
-

 Market8 hours ago
Vitalik Buterin Proposes to Replace EVM with RISC-V