
Market
3 Crypto Smart Money Wallets Are Dumping Fast This March

Smart Money wallets have been aggressively offloading TRUMP, BNKR, and PWEASE in the last seven days, raising red flags for these trending tokens. TRUMP has faced the heaviest pressure, with over $380,000 in net outflows, as its price remains stuck in a sharp downtrend.
BNKR, despite posting strong weekly gains, has also seen large traders liquidating their positions, signaling potential profit-taking. Meanwhile, PWEASE is experiencing similar bearish flows as larger wallets continue to trim exposure despite the recent buzz around the meme coin.
TRUMP
TRUMP has been under significant selling pressure, trading below $18 for the past 30 days, with its price declining by nearly 43% over that period.
This steep correction has coincided with notable smart money activity, as key wallets have been heavily exiting their positions. In the last seven days alone, smart money wallets sold $382,660 worth of TRUMP while only buying $1,240, resulting in a sharp net outflow of $381,420.
This imbalance suggests that larger, more informed investors are losing confidence in TRUMP’s short-term prospects, contributing to the downward momentum.
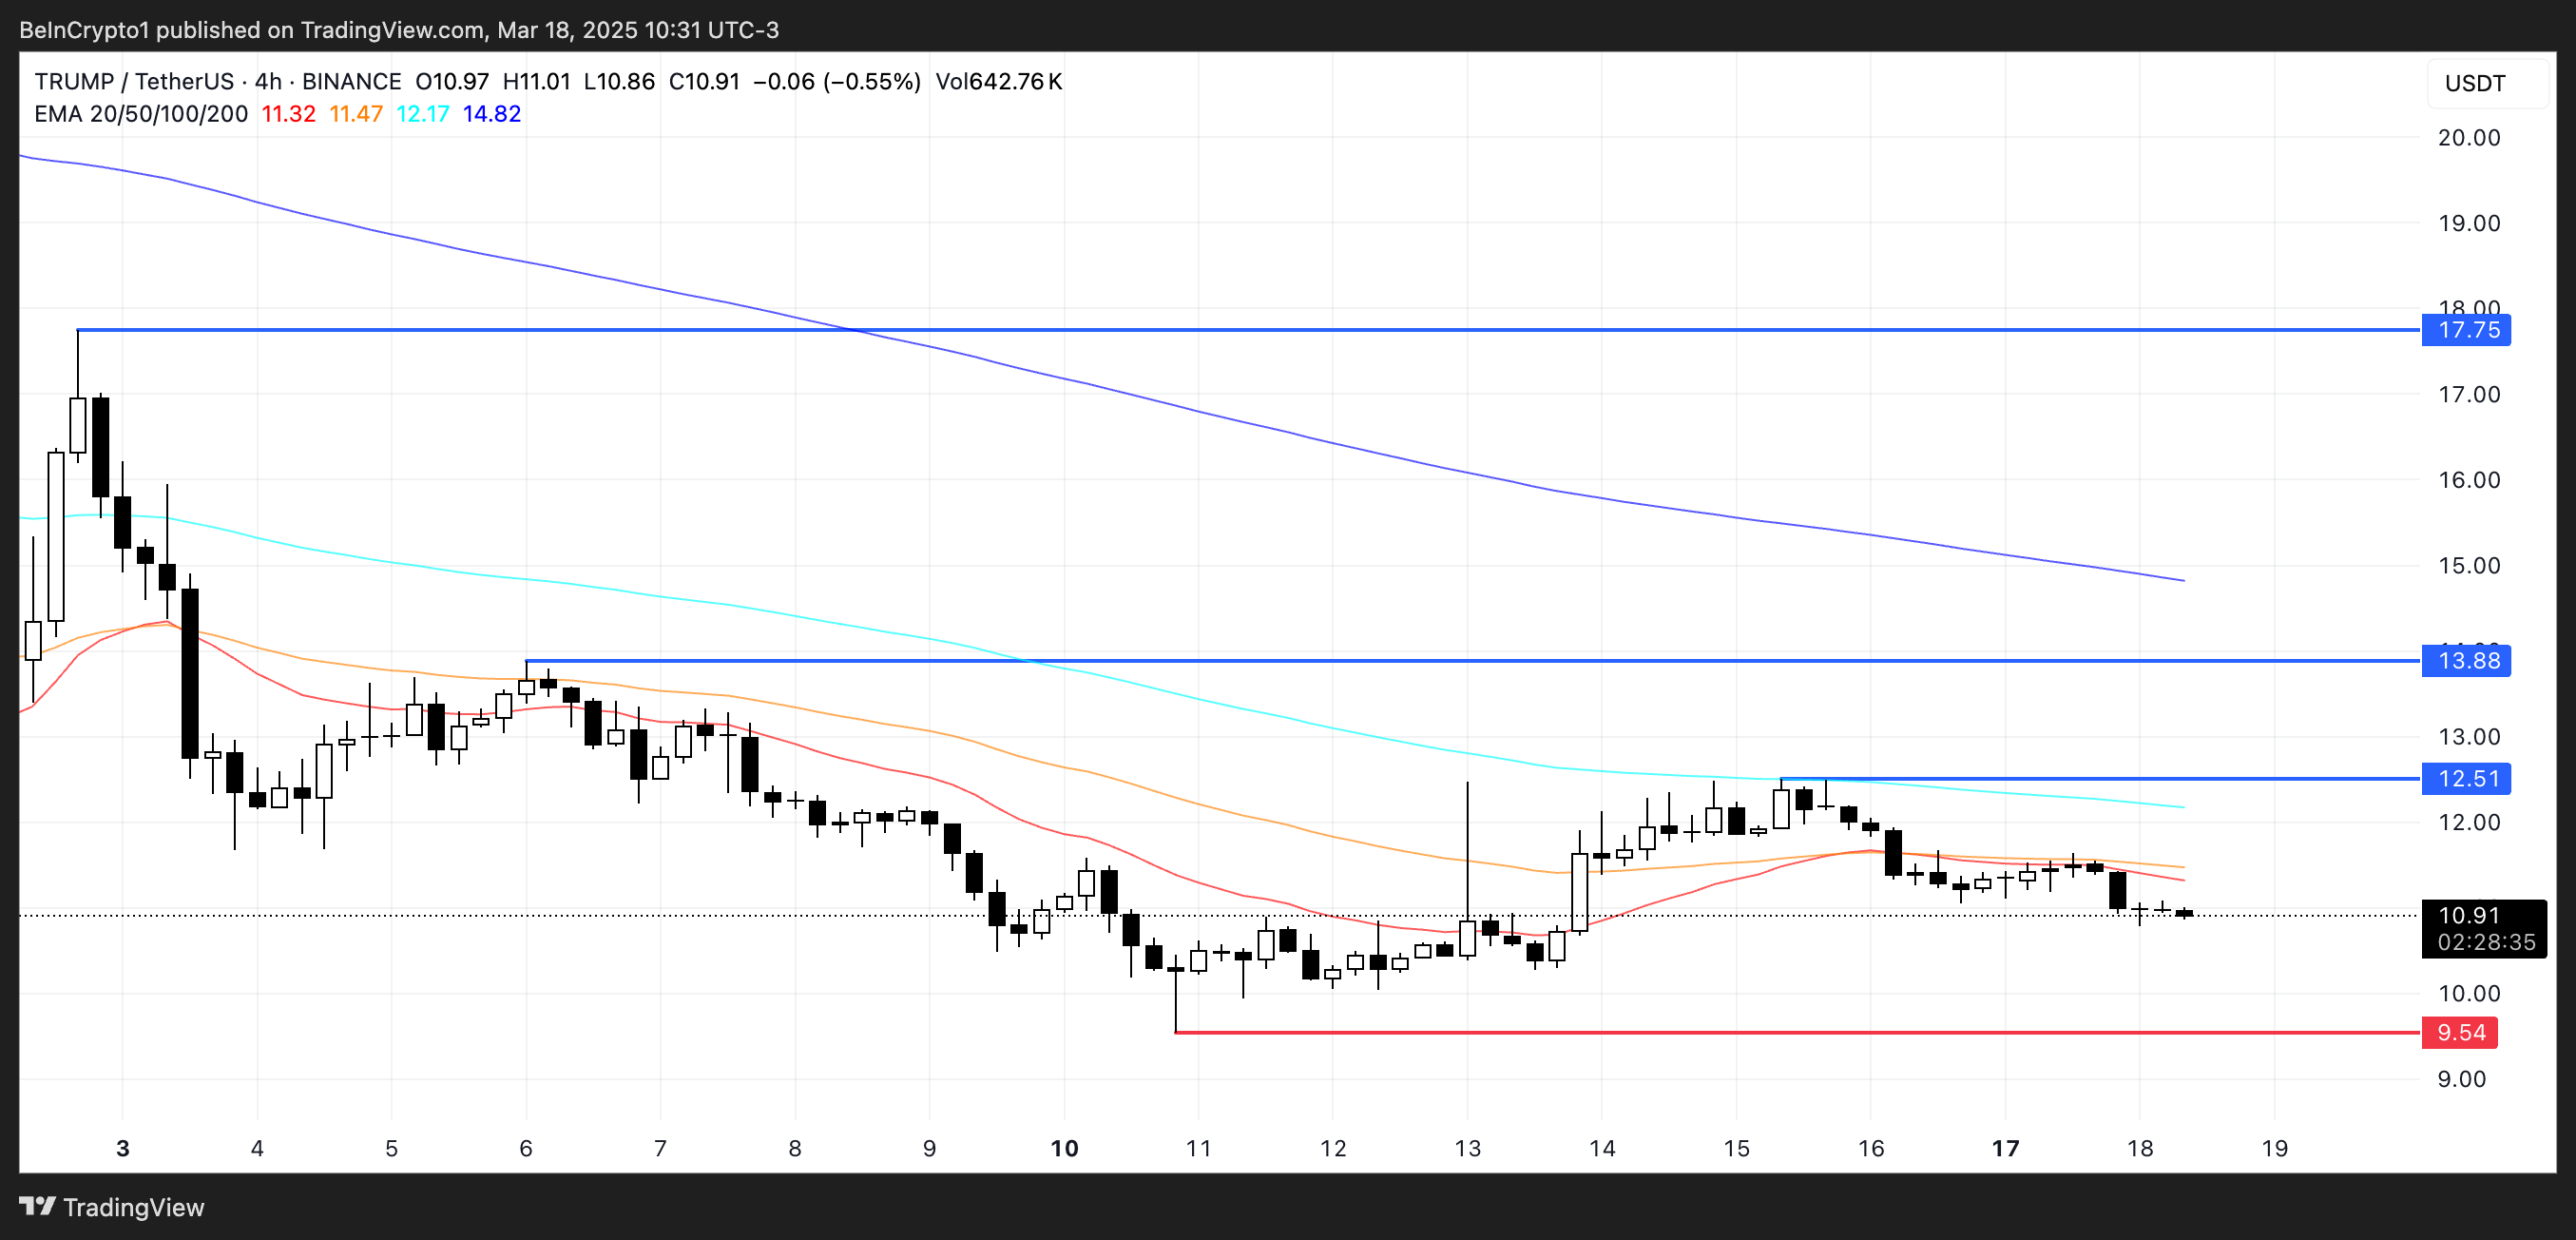
If this corrective trend persists, TRUMP could fall further and retest its next key support level, $9.54. Failure to hold this level may expose the asset to deeper losses.
However, if TRUMP manages to reverse its current bearish trend and regain bullish momentum, it could attempt to challenge resistance at $12.51.
A successful breakout above this level may open the door for a move towards $13.88. If buying pressure strengthens further, TRUMP could rally back up to $17.75, reclaiming levels closer to where it was trading before the recent downturn.
BankrCoin (BNKR)
BNKR has surged by 19% over the past week, positioning itself as one of the top-performing AI coins and one of the most talked-about assets on the Base chain.
This recent rally has drawn significant attention, helping BNKR stand out in a competitive market. However, despite the price increase, smart money wallets have shown mixed behavior—while they purchased $75,700 worth of BNKR in the last seven days, they also offloaded $213,730, resulting in a net outflow of $138,000.
This suggests that although BNKR is trending, larger investors may be capitalizing on the recent rally to secure profits.
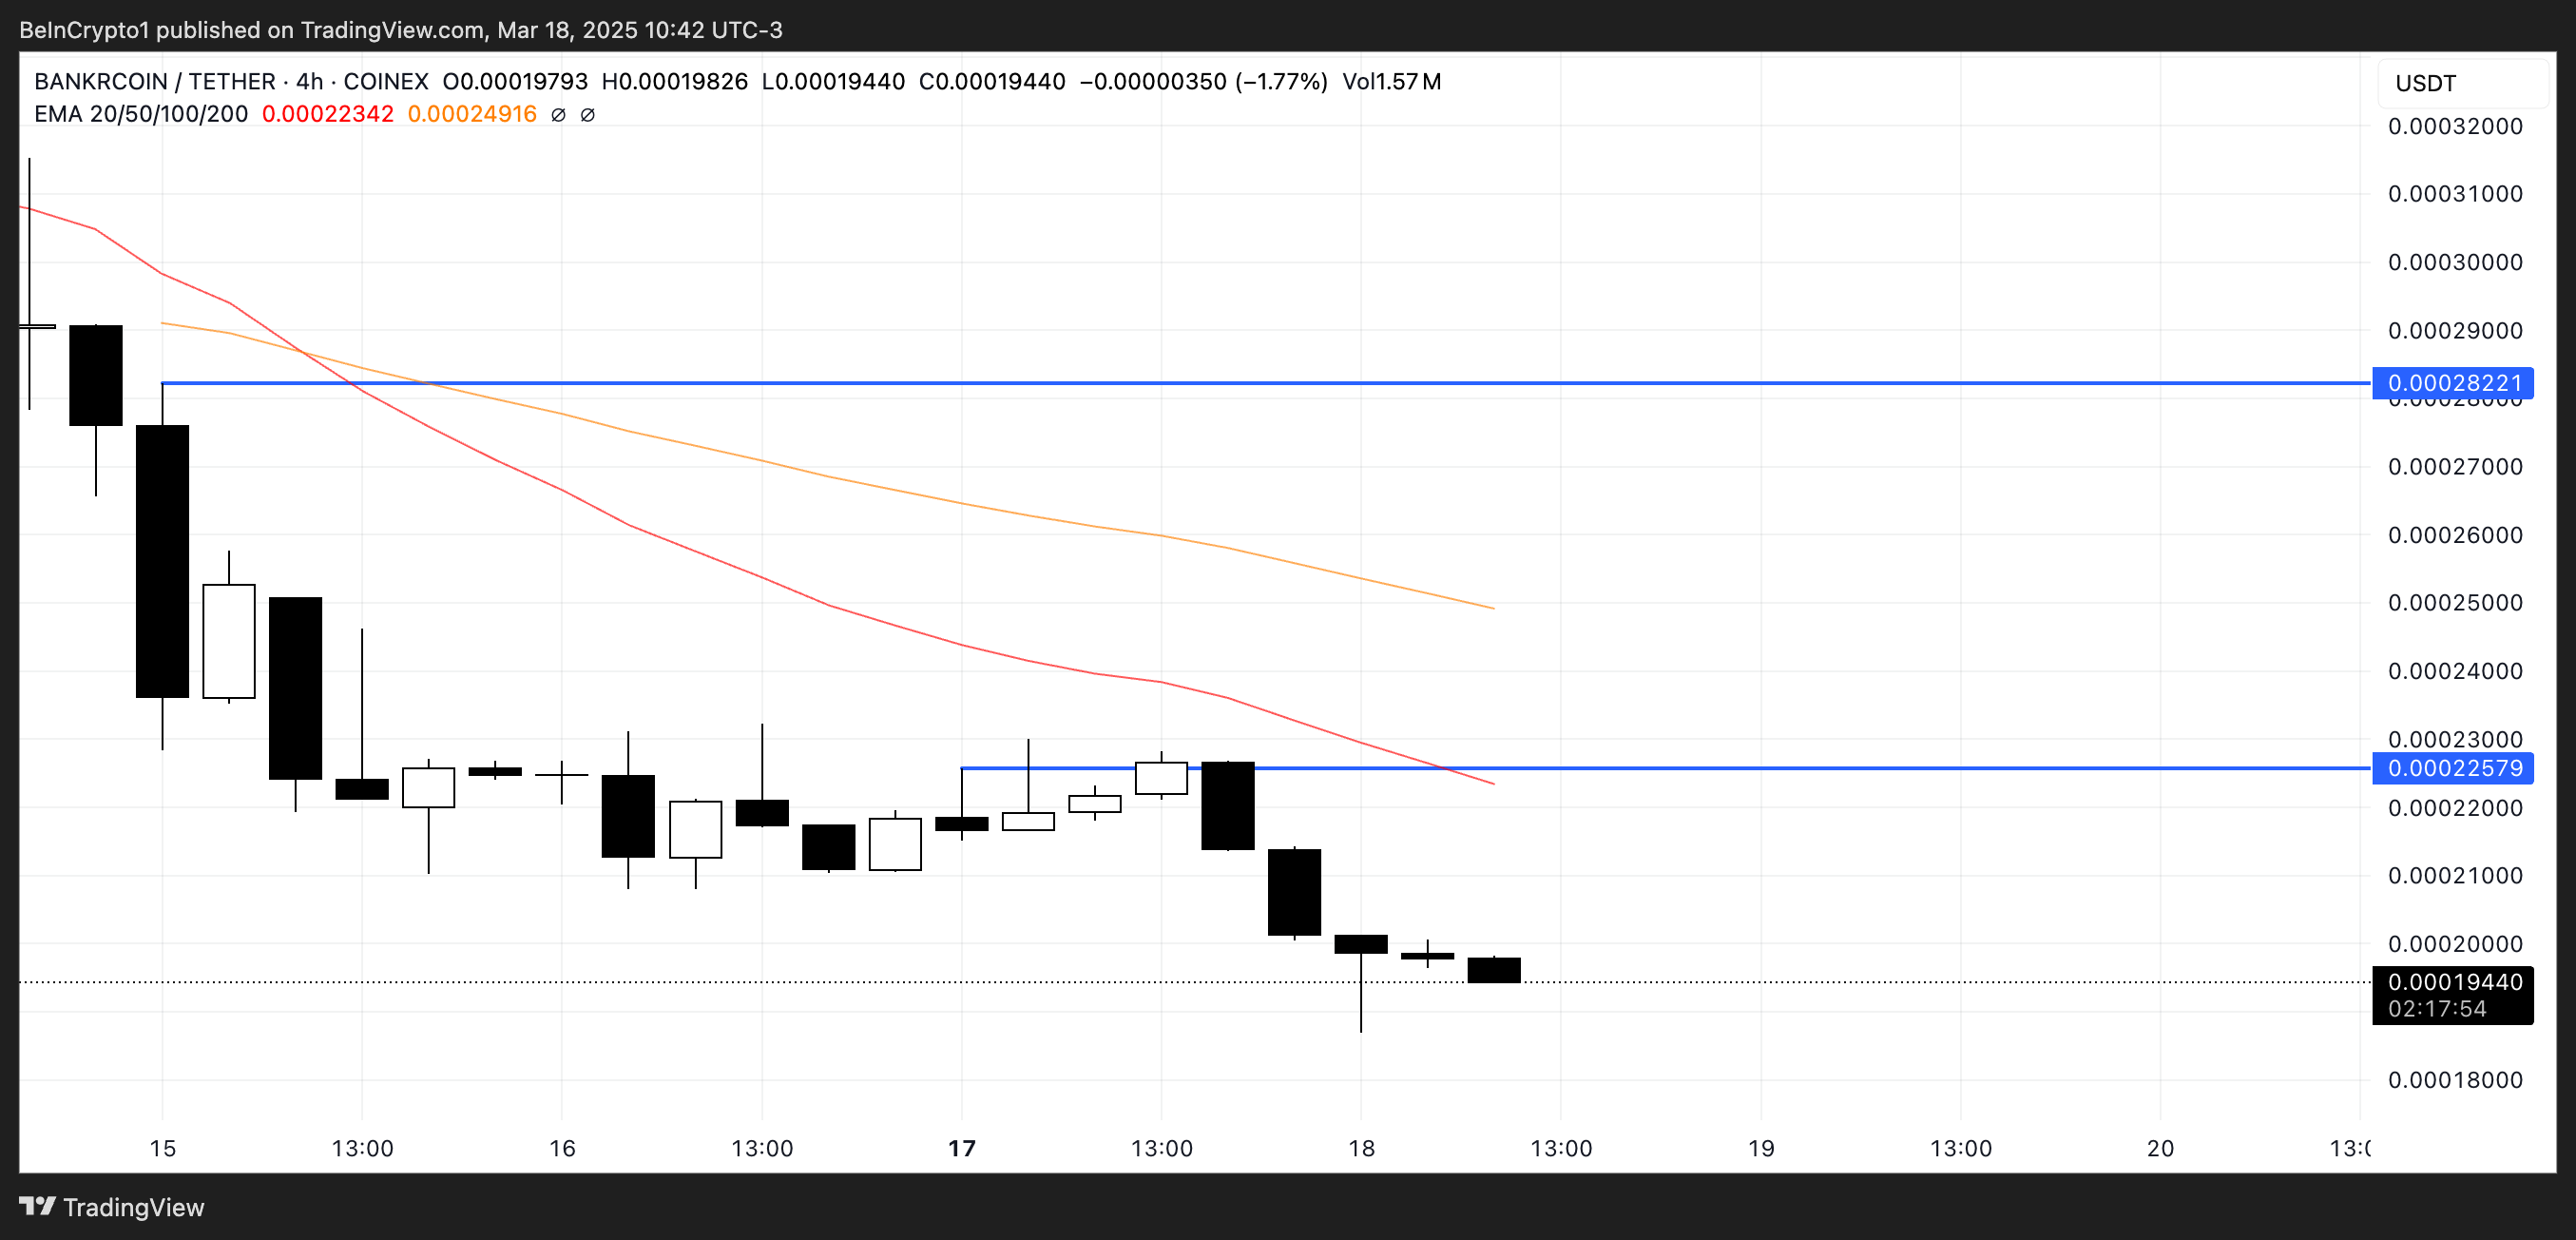
If this selling pressure persists, BNKR could lose its recent momentum and slip below key support levels at $0.00019 or even $0.00018, marking its lowest levels since mid-February.
On the other hand, if BNKR manages to reignite the bullish sentiment that fueled last week’s gains, it could retest resistance at $0.000225.
A breakout above this level could pave the way for a further move toward $0.000282, signaling a strong continuation of its upward trend.
PWEASE
PWEASE, a Solana meme coin satirizing US Vice President JD Vance, has been drawing attention amid volatile market conditions.
Over the past seven days, smart money wallets have shown a bearish stance. They purchased $166,720 worth of PWEASE but sold $291,000 in the same period, resulting in a net outflow of $124,320.
This suggests that while the token has gained some traction, larger investors are currently leaning towards reducing their exposure, adding selling pressure to the coin.
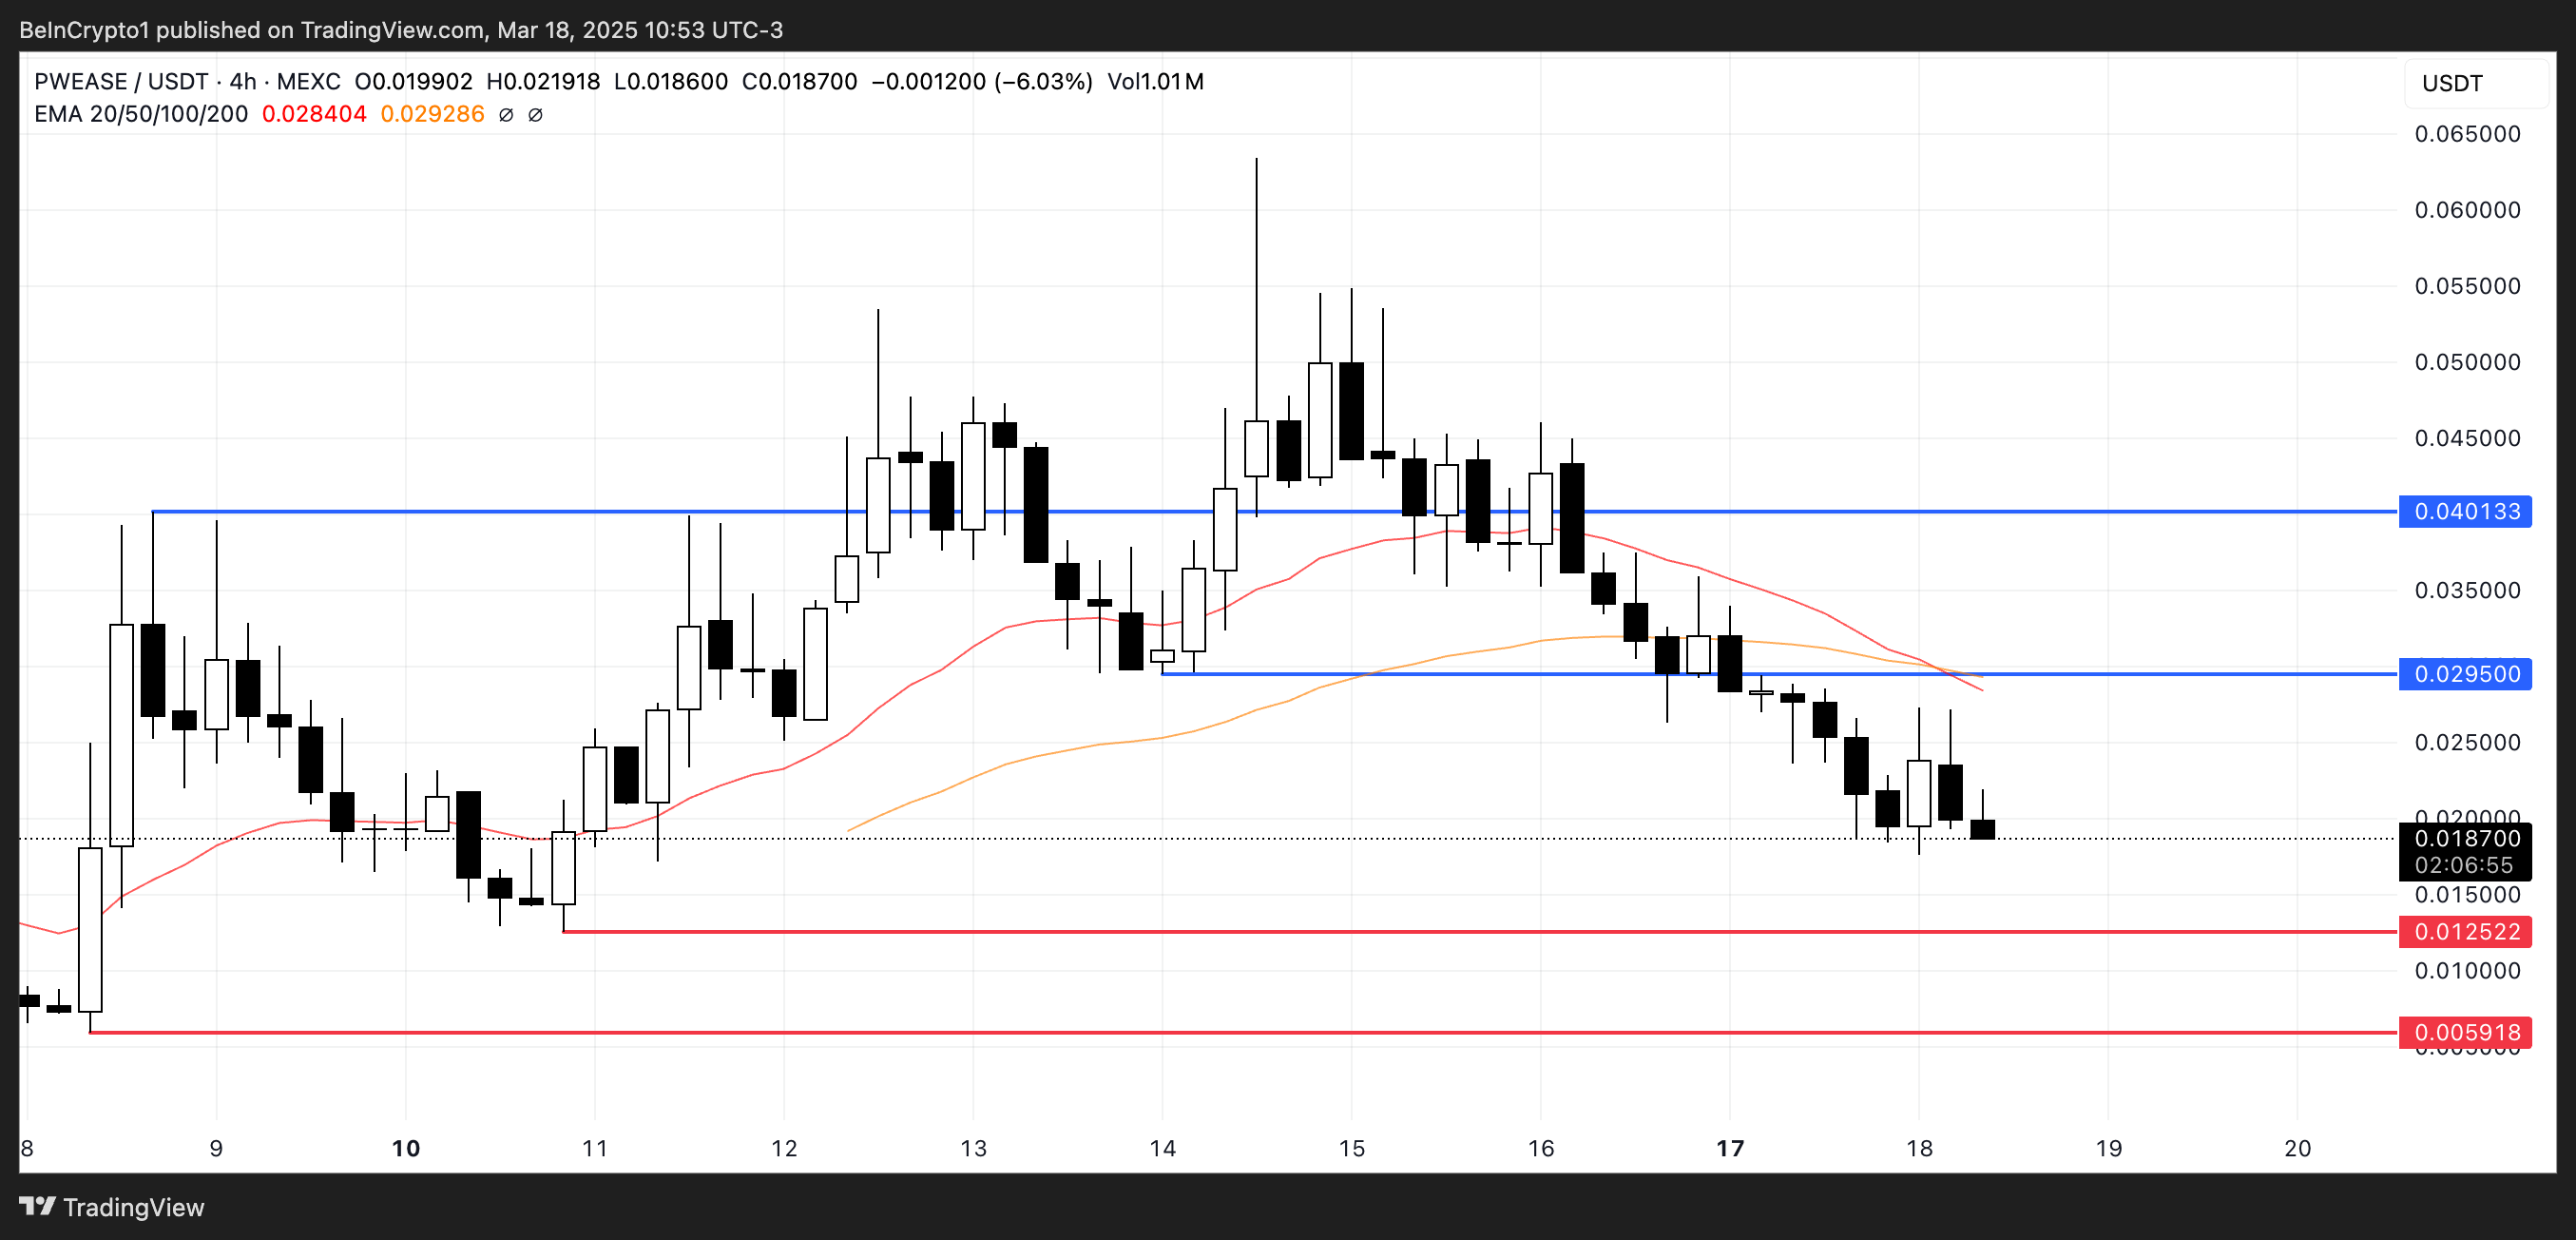
If this corrective trend continues, PWEASE could move lower and test the key support at $0.0125. If that level fails to hold, a deeper decline toward $0.0059 may follow.
However, should PWEASE manage to attract renewed buying interest and reverse the downtrend, it could push up to challenge resistance at $0.0295.
A breakout above this level could open the door for further upside toward $0.040, signaling a potential shift back to bullish momentum for the meme coin.
Disclaimer
In line with the Trust Project guidelines, this price analysis article is for informational purposes only and should not be considered financial or investment advice. BeInCrypto is committed to accurate, unbiased reporting, but market conditions are subject to change without notice. Always conduct your own research and consult with a professional before making any financial decisions. Please note that our Terms and Conditions, Privacy Policy, and Disclaimers have been updated.


Solana (SOL) is up 20% over the past seven days, supported by strong technical indicators and rising on-chain activity. Its Ichimoku Cloud and BBTrend charts both point to bullish momentum, with trend strength and volatility on the rise.
At the same time, Solana is reclaiming the top spot in DEX volume and dominating protocol fee rankings across major DeFi apps. With a recent golden cross on the EMA lines, SOL now looks set to test key resistance levels if momentum holds.
Solana Indicators Paint A Bullish Picture
Solana Ichimoku Cloud chart shows a clear bullish structure, with price trading above both the Tenkan-sen and Kijun-sen. This alignment indicates strong short- and medium-term momentum, with buyers maintaining control.
The Kumo ahead is green and steadily expanding, which supports the continuation of the current uptrend. The distance between the price and the cloud also gives the trend some room before any potential weakness sets in.
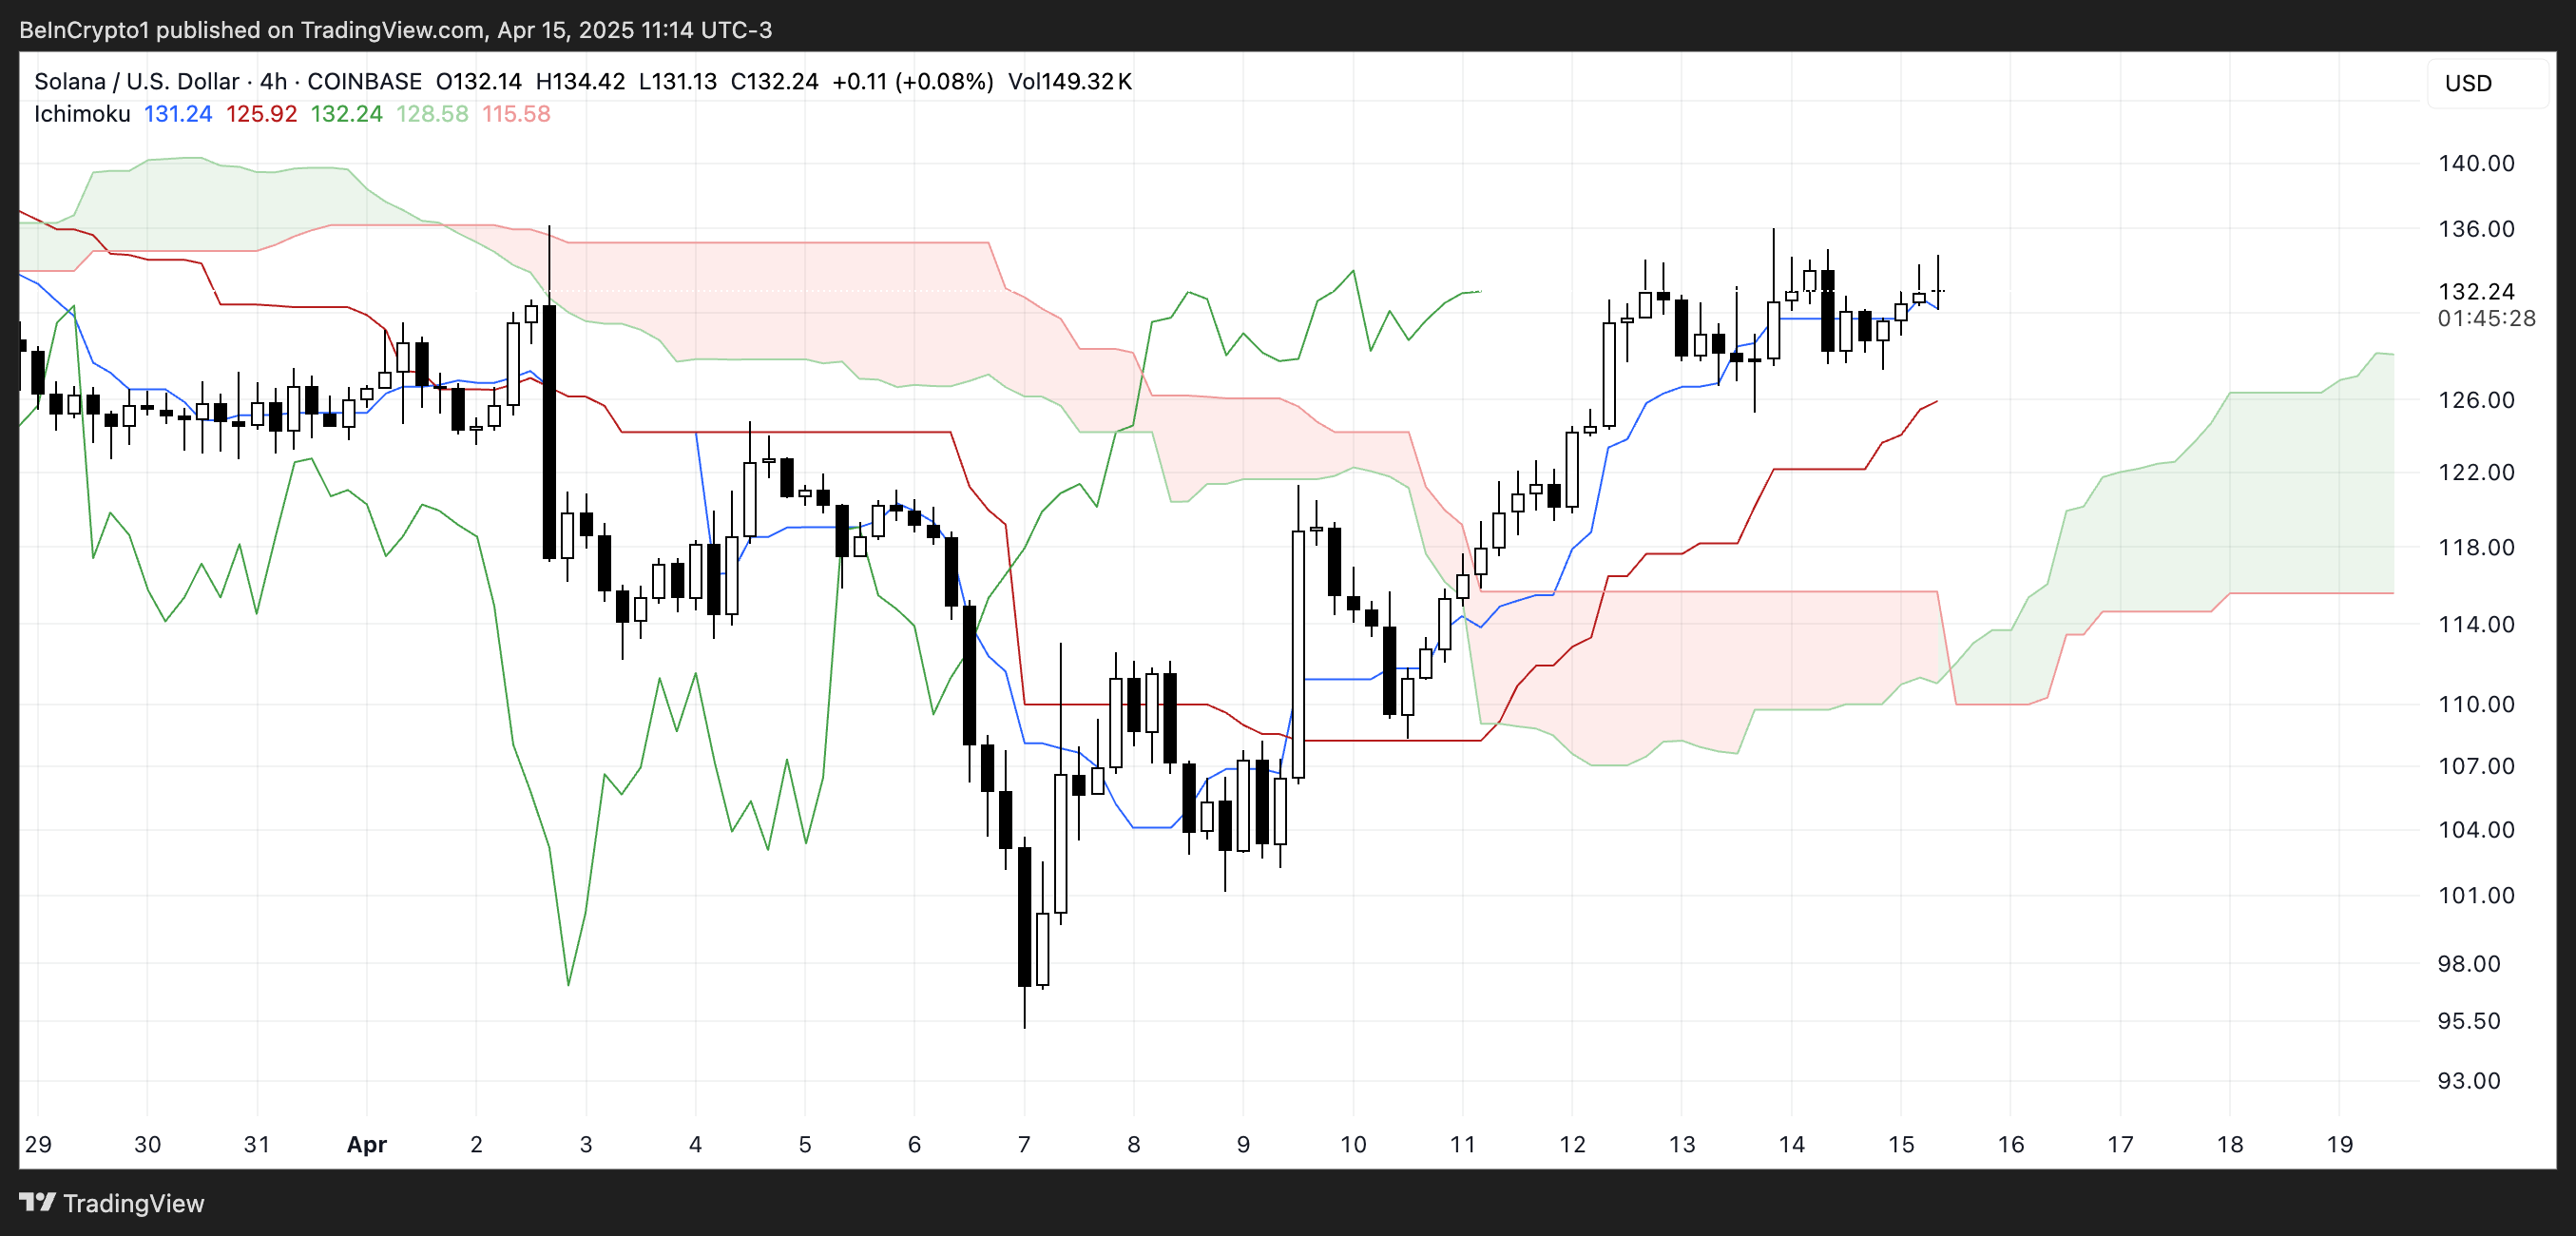
The Chikou Span is positioned above the cloud and candles, confirming bullish confirmation from past price action. As long as Solana stays above the Kijun-sen and the cloud remains supportive, the trend bias remains upward.
Solana’s BBTrend is currently at 16.89, showing a strong increase from 1.88 two days ago, though slightly down from 17.54 yesterday. This sharp rise indicates that volatility and trend strength have recently expanded significantly.
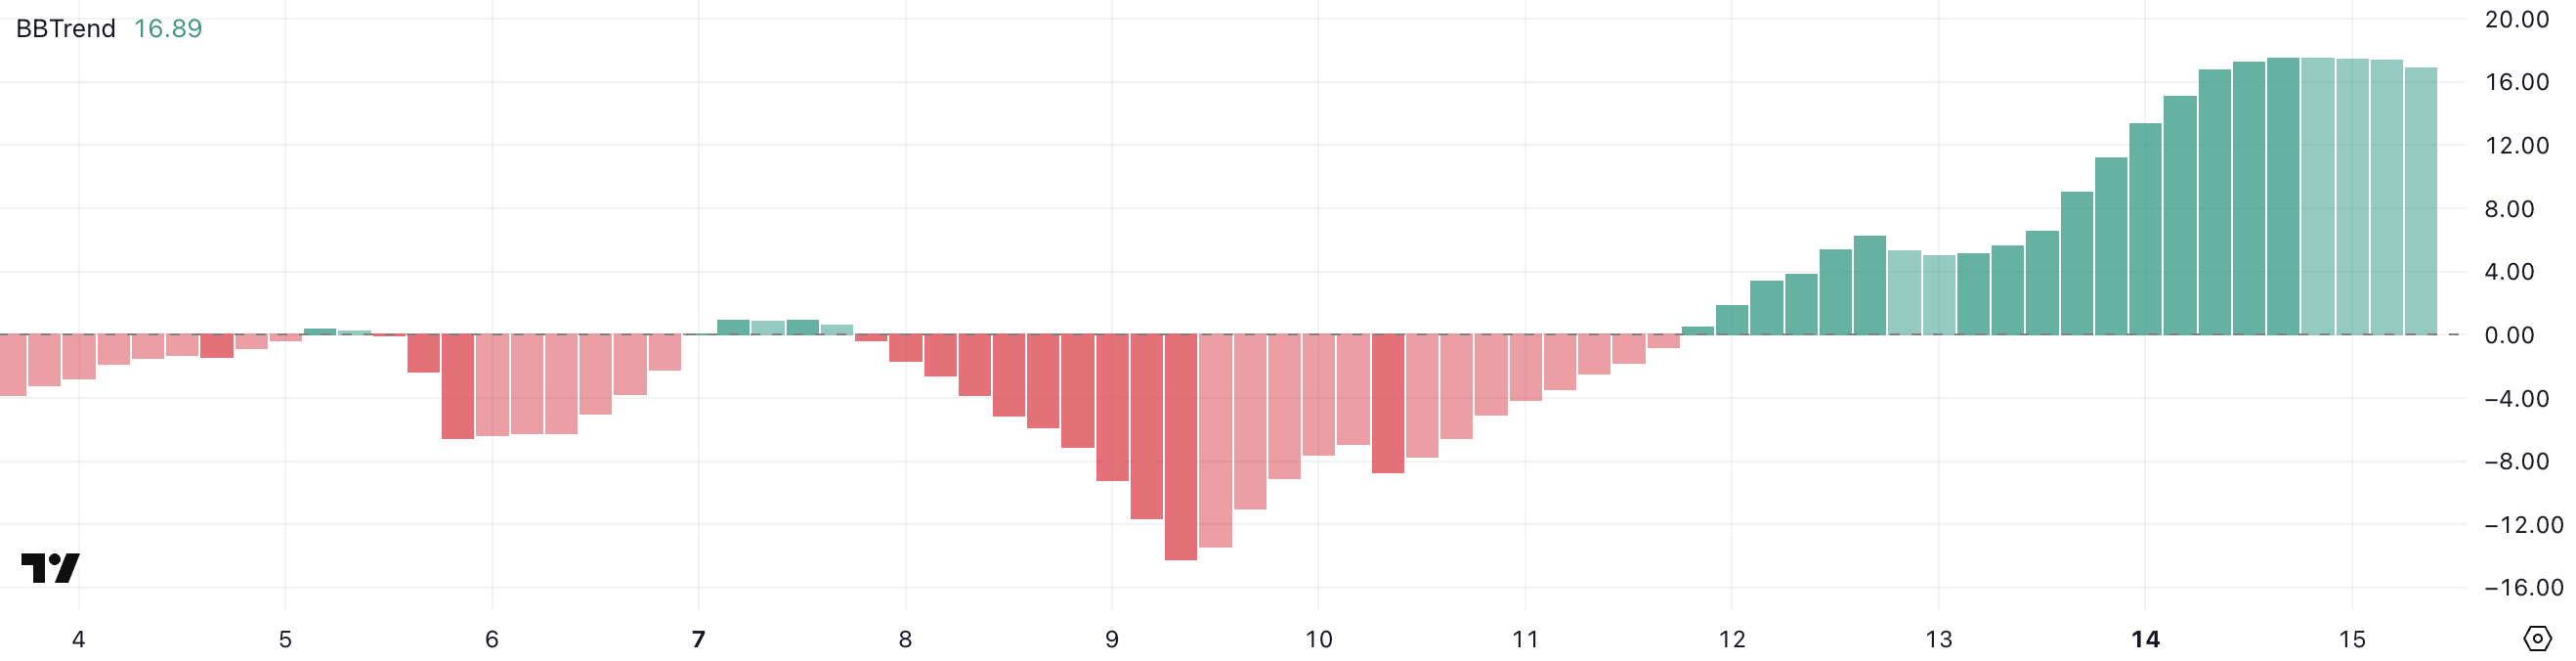
The BBTrend, or Bollinger Band Trend indicator, measures the strength of a trend based on how far price moves away from its average range. Readings above 10 generally signal a strong trend in motion, while lower values reflect a range-bound or weak market.
With SOL’s BBTrend holding near elevated levels, it suggests the asset is still in a strong trending phase. If it remains high or rises again, it could support further upward movement—but a steady decline might hint at a slowing trend or consolidation ahead.
SOL Volumes and Apps Are On The Rise
Solana is firmly reestablishing its dominance in the decentralized exchange (DEX) space, pulling ahead of Ethereum and BNB in daily volume.
Over the past 24 hours, Solana recorded $2.5 billion in DEX activity, marking a 14% increase over the last seven days. That growth outpaces Base’s 10% and contrasts sharply with the declines seen on Ethereum (-3%) and BNB (-9%).

More impressively, Solana’s seven-day DEX volume has surpassed the combined volume of Base, BNB, and Arbitrum.

Beyond trading volume, Solana is also leading in protocol revenue generation. Among the top eight non-stablecoin protocols ranked by fees, five are directly built on Solana: Pump, Axiom, Jupiter, Jito, and Meteora.
Pump stands out in particular, generating $2.73 million in fees in just the past 24 hours and $15 million across the past week.
Can Solana Break Above $150 In The Next Weeks?
Solana’s EMA lines recently formed a golden cross, a bullish signal that often marks the start of a new uptrend.
This crossover suggests momentum is shifting in favor of buyers, with the potential for Solana price to soon test key resistance levels.
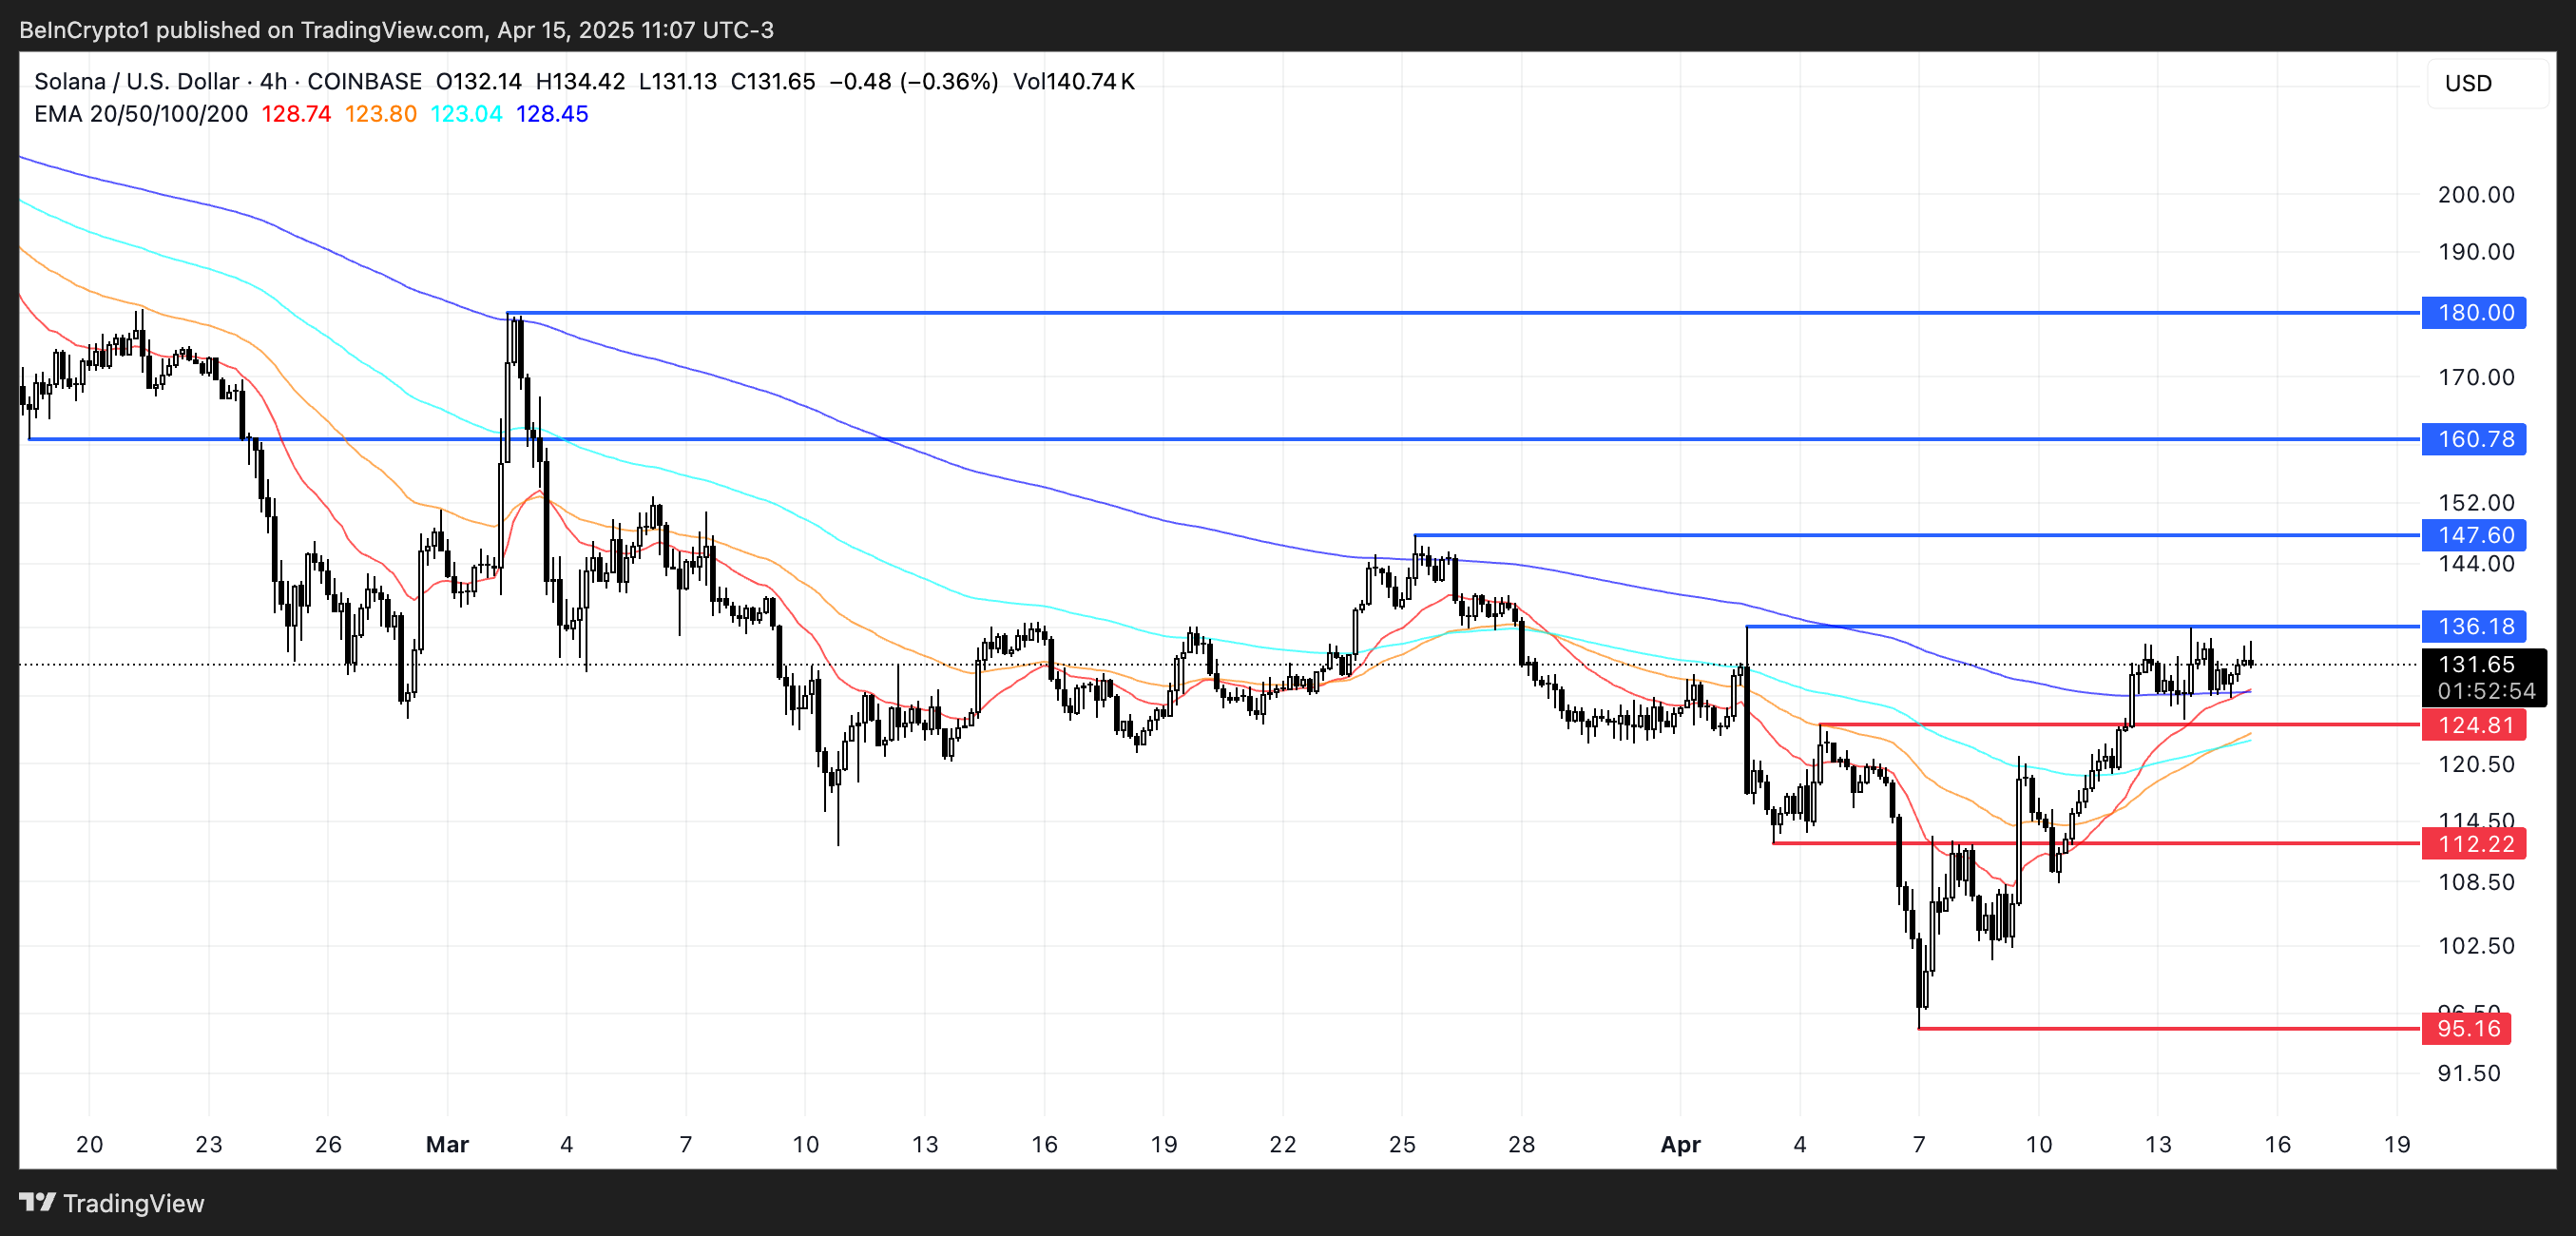
If the current trend holds, Solana could challenge resistance around the $136 zone. A breakout there may open the path toward higher levels such as $147, $160, and even $180 if bullish pressure intensifies.
However, if momentum fades, Solana may face a pullback toward the $124 support zone. A break below that could trigger deeper downside moves, potentially revisiting $112 or even $95 if selling pressure accelerates.
Disclaimer
In line with the Trust Project guidelines, this price analysis article is for informational purposes only and should not be considered financial or investment advice. BeInCrypto is committed to accurate, unbiased reporting, but market conditions are subject to change without notice. Always conduct your own research and consult with a professional before making any financial decisions. Please note that our Terms and Conditions, Privacy Policy, and Disclaimers have been updated.
After months of decline, Solana meme coins are regaining bullish momentum. Daily trade volumes are increasing dramatically, and most of the leading tokens are posting notable price gains.
The increasing network activity is also helping Solana to recover after a 12-month low. Most recently, pump-and-dump schemes and tariff chaos rocked the meme coin sector, but speculative assets are regaining momentum as macroeconomic fears start to cool down.
Are Solana Meme Coins On the Rise Again?
Solana meme coins have been a popular sector of the crypto ecosystem, but a few controversies have taken bites out of the market in recent months.
In addition to pump-and-dumps and the Argentinian LIBRA scandal damaging these assets’ reputations, tariff-related chaos helped draw investors away from these meme assets. Despite this, however, volume is picking back up:
“Meme trading platform Axiom’s daily trading volume exceeded $100 million for the first time on April 14, accounting for about 50% of the market share of Solana Meme trading platform. The number of trading users reached 26,800, a record high,” claimed Colin Wu.
Axiom may represent half of the trading for these assets, but it isn’t the only site with heightened volumes. Pump.fun recently launched Pumpswap, a new decentralized exchange that quickly captured 14% of Solana’s DEX market.
Trading volumes are spiking on PumpSwap, with daily trading volume surging by 50% on Tuesday, April 15.
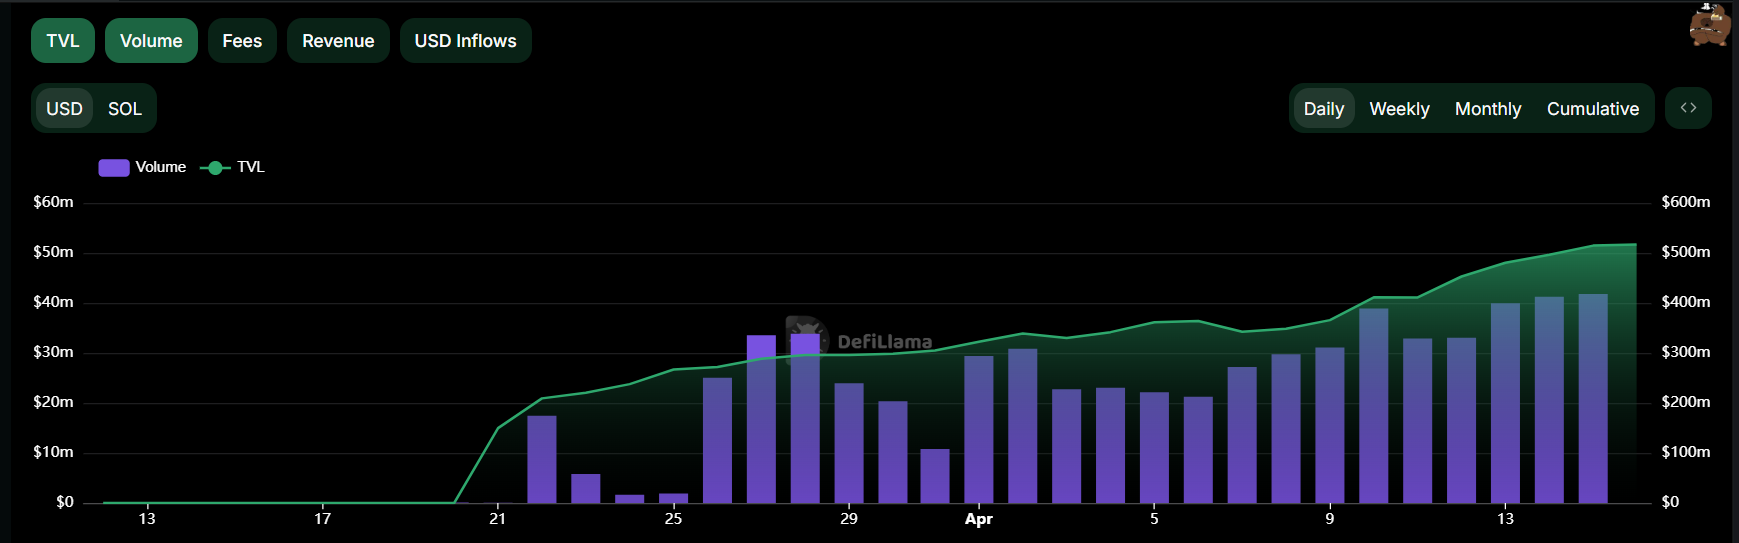
Data from DefiLlama shows that DEX trading on Solana is starting to recover after a massive drop in March. In other words, Solana meme coins’ growth isn’t isolated to either of these platforms either.
These stats have a long way to go before they recover their all-time high from January, but these signs of regrowth are still very promising.
Additionally, individual Solana meme coins are making huge strides in price performance. In the last week, eight of the ten largest assets in this category posted double-digit gains.
One of the two losers this week was TRUMP, which has been adversely impacted by tariff chaos and the latest token unlock. Nonetheless, it managed to achieve a 4.5% price jump. Most of the top ten had gains of over 20% during this period.

This increased network activity is also reflected in Solana’s price. Last week, it began recovering from a 12-month low and has since rocketed up with 20% price gains.
For now, it seems like Solana meme coins are eyeing a real comeback, at least for the short term. However, another macroeconomic shock could see these risk assets reacting more severely than the wider market.
Disclaimer
In adherence to the Trust Project guidelines, BeInCrypto is committed to unbiased, transparent reporting. This news article aims to provide accurate, timely information. However, readers are advised to verify facts independently and consult with a professional before making any decisions based on this content. Please note that our Terms and Conditions, Privacy Policy, and Disclaimers have been updated.
China’s recent directive for its state-owned banks to decrease reliance on the US dollar has amplified a growing trend among countries seeking alternatives to the dominant reserve assets. In some instances, Bitcoin has emerged as a viable competitor.
BeInCrypto spoke with experts from VanEck, CoinGecko, Gate.io, HashKey Research, and Humanity Protocol to understand Bitcoin’s rise as an alternative to the US dollar and its potential for greater influence in global geopolitics.
The Push for De-Dollarization
Since the 2008 global financial crisis, China has gradually reduced its reliance on the US dollar. The People’s Bank of China (PBOC) has now instructed state-owned banks to reduce dollar purchases amid the heightened trade war with US President Donald Trump.
China is among many nations seeking to lessen its dependence on the dollar. Russia, like its southern neighbor, has received an increasing number of Western sanctions– especially following its invasion of Ukraine.
The United States, the European Union, the United Kingdom, and other allies imposed unprecedented international sanctions on Russia, targeting its central bank and major financial institutions and restricting access to the Society for Worldwide Interbank Financial Telecommunication (SWIFT) for some financial institutions.
In response, Russia halted trading of US dollars and euros on the Moscow Stock Exchange (MOEX). Recently, BeInCrypto also reported that Russia has been quietly using Bitcoin for international trade to bypass sanctions.
Furthermore, Rosneft, a major Russian commodities producer, has issued RMB-denominated bonds, indicating a shift towards RBM, the Chinese currency, and a move away from Western currencies due to sanctions.
This global shift away from predominant reserve currencies is not limited to countries affected by Western sanctions. Aiming to increase the Rupee’s international use, India has secured agreements for oil purchases in Indian Rupee (INR) and trade with Malaysia in INR.
The country has also pursued creating a local currency settlement system with nine other central banks.
As more nations consider alternatives to the US dollar’s dominance, Bitcoin has emerged as a functional monetary tool that can serve as an alternative reserve asset.
Why Nations Are Turning to Bitcoin for Trade Independence
Interest in using cryptocurrency for purposes beyond international trade has also grown. In a notable development, China and Russia have reportedly settled some energy transactions using Bitcoin and other digital assets.
“Sovereign adoption of Bitcoin is accelerating this year as demand grows for neutral payments rails that can circumvent USD sanctions,” Matthew Sigel, Head of Digital Assets Research at VanEck, told BeInCrypto.
Two weeks ago, France’s Minister of Digital Affairs proposed using the surplus production of EDF, the country’s state-owned energy giant, to mine Bitcoin.
Last week, Pakistan announced similar plans to allocate part of its surplus electricity to Bitcoin mining and AI data centers.
Meanwhile, on April 10, New Hampshire’s House passed HB302, a Bitcoin reserve bill, by a 192-179 vote, sending it to the Senate. This development makes New Hampshire the fourth state, after Arizona, Texas, and Oklahoma, to have such a bill pass a legislative chamber.
If HB302 is approved by the Senate and signed into law, the state treasurer could invest up to 10% of the general fund and other authorized funds in precious metals and specific digital assets like Bitcoin.
According to industry experts, this is only the beginning.
VanEck Predicts Bitcoin to Become a Future Reserve Asset
Sigel predicts Bitcoin will become a key medium of exchange by 2025 and, ultimately, one of the world’s reserve currencies.
His forecasts suggest Bitcoin could settle 10% of global international trade and 5% of global domestic trade. This scenario would lead to central banks holding 2.5% of their assets in BTC.
According to him, China’s recent de-dollarization will prompt other nations to follow suit and lessen their reliance on the US dollar.
“China’s de-dollarization efforts are already having second- and third-order effects that create opportunities for alternative assets like Bitcoin. When the world’s second-largest economy actively reduces its exposure to US Treasuries and promotes cross-border trade in yuan or through mechanisms like the mBridge project, it signals to other nations—especially those with strained ties to the West—that the dollar is no longer the only game in town,” Sigel said.
For Zhong Yang Chan, Head of Research at CoinGecko, these efforts could prove catastrophic for the United States’ dominance.
“Broader de-dollarization efforts by China, or other major economies, will threaten the status of the dollar’s global reserve currency status. This could have [a] profound impact on the US and its economy, as this would lead to nations reducing their holdings of US treasuries, which the US relies on to finance its national debt,” he told BeInCrypto.
However, the strength of the US dollar and other dominant currencies has already shown signs of weakening.
A General Wave of Currency Decline
Sigel’s research shows that the four strongest global currencies—the US dollar, Japanese yen, British pound, and European euro—have lost value over time, particularly in cross-border payments.
The decline of these currencies creates a void where Bitcoin can gain traction as a key alternative for international trade settlements.
“This shift isn’t purely about promoting the yuan. It’s also about minimizing vulnerability to US sanctions and the politicization of payment rails like SWIFT. That opens the door for neutral, non-sovereign assets—especially those that are digitally native, decentralized, and liquid,” Sigel added.
This lack of national allegiance also sets Bitcoin apart from traditional currencies.
Bitcoin’s Appeal: A Non-Sovereign Alternative
Unlike fiat money or central bank digital currencies (CBDCs), Bitcoin doesn’t respond to any one nation, which makes it appealing to some countries.
For Terence Kwok, CEO and Founder of Humanity Protocol, recent geopolitical tensions have heightened this belief.
“Trust in traditional financial infrastructure is eroded during geopolitical standoffs. Bitcoin, with its transparent ledger and decentralized governance, offers a compelling alternative for value storage and peer-to-peer settlement, especially where neutral, non-sovereign options are preferable. In that sense, geopolitical tension can inadvertently catalyze innovation and adoption in decentralized finance,” Kwok told BeInCrypto.
Because Bitcoin’s supply is limited, it provides a more secure option for nations whose local currency loses value through inflation.
“Bitcoin, due to its scarcity and decentralized nature, is completely different from the centralized fiat currency system and is not affected by changes in monetary policy. Therefore, it can be used as a hedging tool to cope with the depreciation of fiat currencies or geopolitical risks. Especially in the context of rising inflation or challenges to the dominance of the US dollar, allocating some Bitcoin can help diversify investment risks and provide investors with more robust asset protection,” Kevin Guo, Director of HashKey Research, added to the conversation.
For these same reasons, experts don’t expect Bitcoin to replace fiat currencies fully but rather provide a vital alternative for certain cases.
A Replacement or an Alternative?
While Bitcoin offers several advantages over traditional currencies, Gate.io’s Kevin Lee doesn’t foresee its eventual adoption causing a complete overhaul of the currency reserve system.
“Bitcoin is increasingly being recognized for its unique technological characteristics, such as fixed supply, decentralized governance, and borderless accessibility. However, I don’t believe it is meant to replace [the] traditional fiat system, but rather an alternative to it for various business use cases, particularly for diversification and long-term value preservation strategies,” Lee told BeInCrypto.
Guo agreed with this last point, adding that Bitcoin will be more appealing case-by-case.
“Countries may selectively adopt Bitcoin based on their own economic needs, but its application areas are mainly concentrated in niche markets such as cross-border remittances, circumventing sanctions, and hedging inflation,” he said.
Bitcoin must first address several of its shortcomings before it can become truly competitive in the long run.
What Challenges Still Face Bitcoin’s Wider Adoption?
Due to its relatively new status and lack of full development, Bitcoin suffers from shortcomings that prevent mass adoption.
“As with any emerging asset class, Bitcoin faces inherent challenges, including market volatility, evolving regulatory frameworks, infrastructure maturity, and cyclical hypes. These factors may impact its short-term adoption pace,” Lee explained.
To that point, Kwok added:
“Bitcoin’s price swings make it less viable for day-to-day transactions or as a primary reserve asset today. Furthermore, if major powers enforce strict capital controls or implement hostile crypto policies, it could slow down adoption despite broader macro trends in its favor.”
Meanwhile, there’s the competitive advantage of stablecoins, which currently dominate cross-border payments.
“Crypto assets represented by US dollar stablecoins (such as USDT and USDC) are rapidly occupying the main market of cross-border payments and blockchain transactions. Stablecoins have low volatility due to their peg (mostly to the US dollar), making them the preferred tool for international transactions and fund transfers, while Bitcoin is more often used as a store of value or speculative asset,” Guo, Director of HashKey Research told BeInCrypto.
The Bitcoin network has also experienced problems that have exacerbated global demand.
Bitcoin Network Under Strain
Since the beginning of the year, Bitcoin has experienced a significant slowdown in network activity, despite the asset’s bullish performance.
“The usage rate of the Bitcoin network is declining, and its on-chain transaction fees have dropped to the lowest point since 2012, indicating that network activity is gradually decreasing,” Guo said.
Recent data confirms this. The number of Bitcoin transactions has fallen significantly since the last quarter of 2024. Bitcoin registered over 610,684 transactions in November, but that number dropped to 376,369 in April, according to Glassnode data.

The number of Bitcoin active addresses paints a similar picture. In December, the network had nearly 891,623 addresses. Today, that number stands at 609,614.

This decline suggests reduced demand for its blockchain in terms of transactions, usage, and adoption, meaning fewer people are actively using it for transfers, business, or Bitcoin-based applications.
Meanwhile, the Bitcoin network must also ensure its infrastructure is efficient enough to meet global demand.
Can Bitcoin Scale for Global Use?
In 2018, Lightning Labs launched the Lightning Network to reduce the cost and time required for cryptocurrency transactions. Currently, the Bitcoin network can only handle around seven transactions per second, while Visa, for example, handles around 65,000.
“If expansion solutions (such as the Lightning Network) fail to become popular, Bitcoin’s ability to process only about 7 transactions per second will be difficult to support global demand. At the same time, as Bitcoin block rewards are gradually halved, the decline in miners’ income may threaten the long-term security of the network,” Guo, Director of HashKey Research explained.
While the confluence of geopolitical shifts and Bitcoin’s inherent characteristics undeniably create a space for its increased adoption as an alternative to the US dollar and even a potential reserve asset, significant hurdles remain.
Achieving mainstream Bitcoin adoption hinges on overcoming scalability, volatility, regulatory hurdles, stablecoin competition, and ensuring network security.
The unfolding panorama suggests Bitcoin will carve out an important role in the global financial system, though a complete overhaul of established norms seems unlikely in the immediate future.
Disclaimer
Following the Trust Project guidelines, this feature article presents opinions and perspectives from industry experts or individuals. BeInCrypto is dedicated to transparent reporting, but the views expressed in this article do not necessarily reflect those of BeInCrypto or its staff. Readers should verify information independently and consult with a professional before making decisions based on this content. Please note that our Terms and Conditions, Privacy Policy, and Disclaimers have been updated.

Solana (SOL) Jumps 20% as DEX Volume and Fees Soar

Ethereum Metrics Reveal Critical Support Level – Can Buyers Step In?

Solana Meme Coins Resurge with Rising Trade Volume

China’s De-Dollarization Boosts Bitcoin’s Global Role in 2025

New USDi Stablecoin Pegged to US Inflation Metrics

Bitcoin Adoption Grows As Public Firms Raise Holdings In Q1

2.52 Million Altcoins Are Ruining Crypto’s Future

Animoca Brands Valuation Tanks 75% In Two Years, Here’s Why

Crypto exchange BingX hacked for $43 million

Are The Big Players Losing Interest?

Hong Kong’s Securities Association Tips Authorities On Crypto Self-Regulation

Coinbase cbBTC Set to go Live on Solana
2.52 Million Altcoins Are Ruining Crypto’s Future
Animoca Brands Valuation Tanks 75% In Two Years, Here’s Why
Crypto exchange BingX hacked for $43 million
Are The Big Players Losing Interest?
Hong Kong’s Securities Association Tips Authorities On Crypto Self-Regulation
Coinbase cbBTC Set to go Live on Solana
-
 Market24 hours ago
Is The XRP Price Mirroring Bitcoin’s Macro Action? Analyst Maps Out How It Could Get To $71
-
 Market21 hours ago
Bitcoin Price Eyes Bullish Continuation—Is $90K Within Reach?
-
 Altcoin21 hours ago
Expert Urges Pi Network To Learn From The OM Crash Ahead Of Open Mainnet Transition
-

 Market13 hours ago
Can Pi Network Avoid a Similar Fate?
-

 Market23 hours ago
MANTRA (OM) Charts Look Worse than LUNA – No Buying Activity
-

 Market16 hours ago
XRP Price Could Regain Momentum—Is a Bullish Reversal in Sight?
-

 Market22 hours ago
$7 Million Hack Hits Binance-Backed Project
-

 Market19 hours ago
Trump’s Tariffs Spark Search for Jerome Powell’s Successor
