
Market
3 Bullish Cryptos Predicted to Outshine Bitcoin (BTC) in June

Bitcoin currently holds over 50% of the market dominance in the cryptocurrency sector and is generally considered less volatile than other cryptocurrencies.
Let’s explore which altcoins might perform well in June if Bitcoin surges to its all-time high of $73,000.
Bitcoin Nears ATH at $68,000, But Some Altcoins Remain Undervalued
After experiencing a correction to $56,000 earlier in May, Bitcoin is closing the month positively and is currently trading at $68,000, approaching its all-time high. Some altcoins have not experienced a similar recovery due to the deep correction they underwent during Bitcoin’s dip to $56,000.
Analysts have noted that some altcoins are still considered undervalued compared to Bitcoin and have not yet experienced a sustained breakout above key resistance levels. These three coins were selected for analysis based on their past performance in early 2024.
Arbitrum (ARB) May Increase 20-45% in Value Next Month
The ARB/BTC chart showcases a significant downtrend, with the price action consistently below the daily Ichimoku Cloud and 100D EMA. The current consolidation near support levels suggests a critical juncture.
This chart mirrors the BTC pair, highlighting a consolidation phase beneath key resistance levels marked by the daily Ichimoku Cloud and 100D EMA.
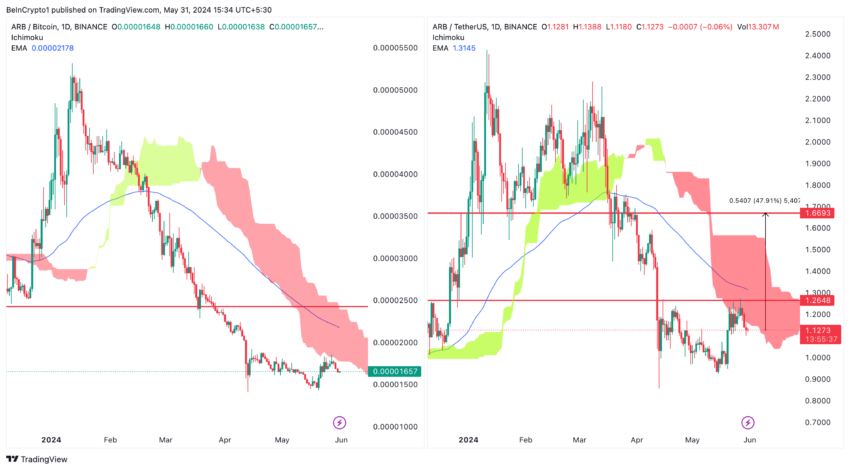
ARB/BTC: A breakout above the 0.00002178 BTC level (100D EMA) would signal a strong trend reversal, potentially triggering bullish momentum.
ARB/USDT: Breaching the $1.265 and, subsequently, the $1.667 levels would confirm a bullish trend, enticing more traders.
Read More: Arbitrum (ARB) Price Prediction 2024/2025/2035
Why ARB Might Outperform BTC in June
Market Sentiment Shift: Overcoming key resistance levels would transform market sentiment from bearish to bullish, drawing in more investors.
Ecosystem Expansion: Arbitrum’s ongoing development and increasing adoption could significantly boost ARB demand, leading to superior performance against Bitcoin.
Injective (INJ) Could See 20-45% Surge in June With Rising Bitcoin
The INJ/BTC chart reveals a prolonged downtrend, with repeated failures to surpass the daily Ichimoku Cloud and 100D EMA. The price currently tests the support level, indicating the potential for a breakout.
This chart shows consolidation with identified resistance levels. The price action below the daily Ichimoku Cloud and 100D EMA suggests a critical point for potential upward movement.
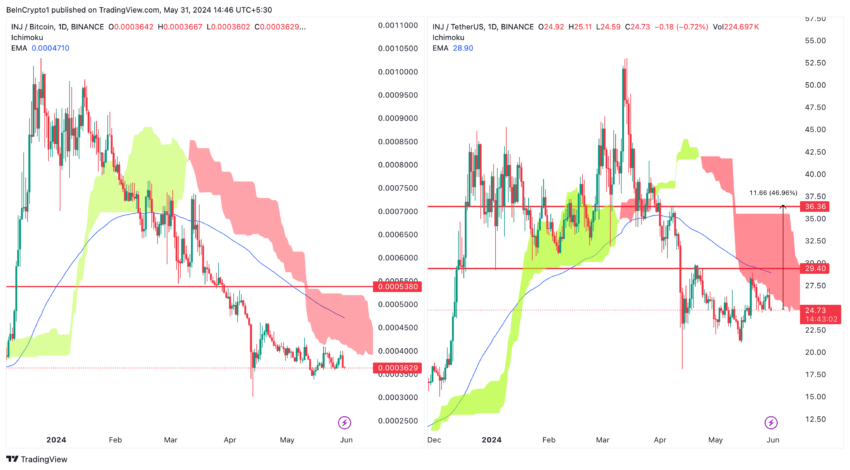
INJ/BTC: Surpassing the 0.0005380 BTC level would indicate a trend reversal and bullish momentum.
INJ/USDT: Breaking above the $29.40 and then the $36.36 levels would signal a robust bullish trend.
Why INJ Could Outperform BTC Performance in June
Injective Protocol’s DeFi offerings are unique, potentially driving significant interest and investment, especially as the DeFi sector expands.
INJ’s higher volatility than Bitcoin presents greater potential returns during BTC’s bullish moves.
ORDI Investors Eye 10-30% Gains on Positive Breakout
The ORDI/BTC chart illustrates a downtrend with consolidation below the daily Ichimoku Cloud and 100D EMA. The price is near a support level, suggesting potential for a breakout.
This chart shows consolidation with key resistance levels identified. The price action below the daily Ichimoku Cloud and 100D EMA indicates a possible bullish breakout.
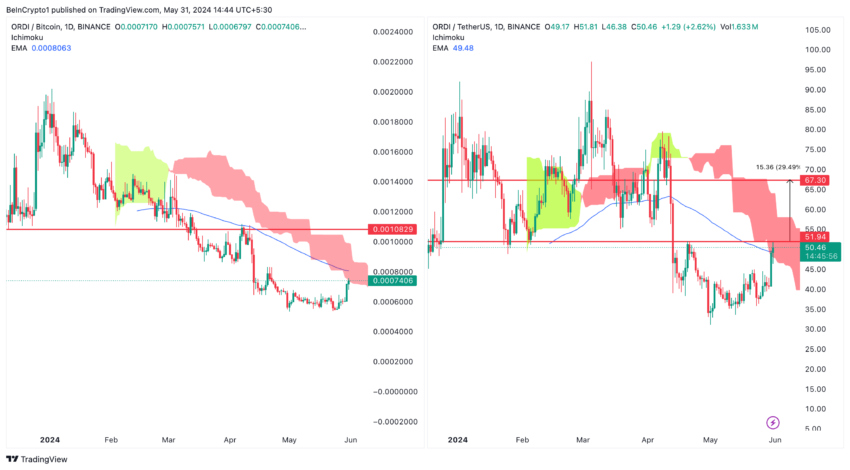
ORDI/BTC: A breakout above the 0.000829 BTC level would signal a trend reversal and bullish momentum.
ORDI/USDT: Surpassing the $51.94 level and then the $67.30 level would confirm a strong bullish trend.
Why ORDI Could Outperform BTC in June
As a cryptocurrency project utilizing Bitcoin’s blockchain, Ordinals (ORDI) can gain significant momentum if Bitcoin rises, lifting the entire Bitcoin ecosystem.
Read More: 10 Best Altcoin Exchanges In 2024
Due to its higher volatility than Bitcoin, ORDI can offer greater potential returns during bullish market phases.
General Market Dynamics
Altcoins like ARB, INJ, and ORDI exhibit higher volatility and could offer greater potential returns than Bitcoin during bullish market conditions, especially if Bitcoin returns to its all-time highs.
Breakouts above significant resistance levels are psychological triggers. They indicate a shift from bearish to bullish sentiment, encouraging more buying activity.
Bitcoin’s market upward trends often lift altcoin prices. However, unique value propositions and ecosystem growth of altcoins like ARB, INJ, and ORDI can result in even more significant price movements once Bitcoin consolidates at higher levels.
Disclaimer
In line with the Trust Project guidelines, this price analysis article is for informational purposes only and should not be considered financial or investment advice. BeInCrypto is committed to accurate, unbiased reporting, but market conditions are subject to change without notice. Always conduct your own research and consult with a professional before making any financial decisions. Please note that our Terms and Conditions, Privacy Policy, and Disclaimers have been updated.


Ethereum (ETH) co-founder Vitalik Buterin has proposed overhauling the blockchain’s smart contract infrastructure by replacing the Ethereum Virtual Machine (EVM) with RISC-V, a widely adopted open-source instruction set architecture.
This shift aims to address one of Ethereum’s key scaling bottlenecks by dramatically improving the efficiency and simplicity of smart contract execution.
Buterin Proposes Ditching EVM for RISC-V
The proposal was detailed in a post on the Ethereum Magicians forum. In it, Buterin suggested that smart contracts could eventually be compiled to RISC-V rather than EVM bytecode.
According to Buterin, this shift addresses long-term scalability challenges. This particularly includes keeping block production competitive and improving zero-knowledge (ZK) EVM-proof efficiency.
“It aims to greatly improve the efficiency of the Ethereum execution layer, resolving one of the primary scaling bottlenecks, and can also greatly improve the execution layer’s simplicity – in fact, it is perhaps the only way to do so,” he wrote.
Current ZK-EVM implementations spend around half of their proving cycles on EVM execution. By switching to a native RISC-V VM, Ethereum could potentially achieve up to 100x efficiency gains.
Importantly, many fundamental aspects of Ethereum’s architecture would remain unchanged, preserving continuity for developers and users. Core abstractions such as accounts, smart contract storage, ETH balances, and cross-contract calls would function exactly as they do today.
Developers would still write contracts in familiar languages like Solidity or Vyper. These would simply be compiled to RISC-V rather than EVM bytecode. Tooling and workflows would remain largely intact, ensuring a smooth transition.
Crucially, the proposal ensures backward compatibility. Existing EVM contracts will remain fully operational and interoperable with new RISC-V contracts.
Buterin outlines several potential implementation paths forward. The first would support both EVM and RISC-V smart contracts natively. The second suggests wrapping EVM contracts to run via an interpreter written in RISC-V. Thus, it would enable a full transition without breaking compatibility.
The third, more modular approach, builds on the second by formally enshrining interpreters as part of the Ethereum protocol. This would allow the EVM and the future virtual machines to be supported in a standardized way.
Buterin stated that the idea is “equally as ambitious as the beam chain effort.”
“The beam chain effort holds great promise for greatly simplifying the consensus layer of Ethereum. But for the execution layer to see similar gains, this kind of radical change may be the only viable path,” Buterin added.
For context, the Ethereum Beam Chain is a redesign of Ethereum’s consensus layer (Beacon Chain). It focuses on faster block times, faster finality, chain snarkification, and quantum resistance. The development will likely begin in 2026.
This proposal fits into Ethereum’s broader vision of modularity, simplicity, and long-term scalability. Previously, BeInCrypto reported on Buterin’s privacy-centric plans for the blockchain.
The proposal focused on integrating privacy-preserving technologies. Moreover, the Pectra upgrade is also nearing, with the launch expected on May 7.
Meanwhile, ETH continues to face market headwinds, trading at March 2023 lows. This year has been quite hard for the altcoin, as it saw a decline of 50.8%. In fact, Ethereum dominance hit a 5-year low last week.

Nonetheless, BeInCrypto data showed a slight recovery over the last 14 days. ETH rose by 6.1%. Over the past day alone, it saw modest gains of 1.7%. At the time of writing, ETH was trading at $1,639.
Disclaimer
In adherence to the Trust Project guidelines, BeInCrypto is committed to unbiased, transparent reporting. This news article aims to provide accurate, timely information. However, readers are advised to verify facts independently and consult with a professional before making any decisions based on this content. Please note that our Terms and Conditions, Privacy Policy, and Disclaimers have been updated.

Solana started a fresh increase from the $120 support zone. SOL price is now consolidating and might climb further above the $142 resistance zone.
- SOL price started a fresh increase above the $125 and $132 levels against the US Dollar.
- The price is now trading above $130 and the 100-hourly simple moving average.
- There is a connecting bullish trend line forming with support at $137 on the hourly chart of the SOL/USD pair (data source from Kraken).
- The pair could start a fresh increase if it clears the $142 resistance zone.
Solana Price Gains Over 5%
Solana price formed a base above the $120 support and started a fresh increase, like Bitcoin and Ethereum. SOL gained pace for a move above the $125 and $132 resistance levels.
The pair even spiked toward the $145 resistance zone. A high was formed at $143.06 and the price is now retreating lower. There was a move below the 23.6% Fib retracement level of the upward move from the $135 swing low to the $143 high.
Solana is now trading above $130 and the 100-hourly simple moving average. There is also a connecting bullish trend line forming with support at $137 on the hourly chart of the SOL/USD pair. The trend line is close to the 76.4% Fib retracement level of the upward move from the $135 swing low to the $143 high.

On the upside, the price is facing resistance near the $142 level. The next major resistance is near the $145 level. The main resistance could be $150. A successful close above the $150 resistance zone could set the pace for another steady increase. The next key resistance is $155. Any more gains might send the price toward the $165 level.
Pullback in SOL?
If SOL fails to rise above the $142 resistance, it could start another decline. Initial support on the downside is near the $138.50 zone. The first major support is near the $137 level and the trend line.
A break below the $137 level might send the price toward the $132 zone. If there is a close below the $132 support, the price could decline toward the $125 support in the near term.
Technical Indicators
Hourly MACD – The MACD for SOL/USD is gaining pace in the bullish zone.
Hourly Hours RSI (Relative Strength Index) – The RSI for SOL/USD is above the 50 level.
Major Support Levels – $137 and $132.
Major Resistance Levels – $142 and $145.

Reason to trust
![]()
Strict editorial policy that focuses on accuracy, relevance, and impartiality
Created by industry experts and meticulously reviewed
The highest standards in reporting and publishing
Strict editorial policy that focuses on accuracy, relevance, and impartiality
Morbi pretium leo et nisl aliquam mollis. Quisque arcu lorem, ultricies quis pellentesque nec, ullamcorper eu odio.
Bitcoin price is slowly moving higher above the $86,500 zone. BTC is gaining pace and might continue higher in the near term.
- Bitcoin found support at $84,200 and started a recovery wave.
- The price is trading above $85,500 and the 100 hourly Simple moving average.
- There was a break above a connecting bearish trend line with resistance at $85,000 on the hourly chart of the BTC/USD pair (data feed from Kraken).
- The pair could start another increase if it clears the $88,000 zone.
Bitcoin Price Eyes Steady Increase
Bitcoin price remained stable above the $83,200 level and started a fresh increase. BTC was able to climb above the $84,200 and $85,000 resistance levels.
There was a break above a connecting bearish trend line with resistance at $85,000 on the hourly chart of the BTC/USD pair. The bulls were able to pump the price above the $86,500 resistance. It even spiked above $87,000. A high is formed near $87,562 and the price might continue to rise unless there is a move below the 23.6% Fib retracement level of the upward move from the $84,007 swing low to the $87,562 high.
Bitcoin price is now trading above $86,500 and the 100 hourly Simple moving average. On the upside, immediate resistance is near the $87,500 level. The first key resistance is near the $88,000 level.

The next key resistance could be $88,800. A close above the $88,800 resistance might send the price further higher. In the stated case, the price could rise and test the $89,500 resistance level. Any more gains might send the price toward the $90,000 level.
Downside Correction In BTC?
If Bitcoin fails to rise above the $88,000 resistance zone, it could start a downside correction. Immediate support on the downside is near the $87,000 level. The first major support is near the $86,750 level.
The next support is now near the $86,000 zone. Any more losses might send the price toward the $85,750 support or the 50% Fib retracement level of the upward move from the $84,007 swing low to the $87,562 high in the near term. The main support sits at $84,850.
Technical indicators:
Hourly MACD – The MACD is now gaining pace in the bullish zone.
Hourly RSI (Relative Strength Index) – The RSI for BTC/USD is now above the 50 level.
Major Support Levels – $86,750, followed by $86,000.
Major Resistance Levels – $87,500 and $88,000.

Vitalik Buterin Proposes to Replace EVM with RISC-V
US Economic Indicators to Watch & Potential Impact on Bitcoin

Solana Rallies Past Bitcoin—Momentum Tilts In Favor of SOL

Expert Says Solana Price To $2,000 Is Within Reach, Here’s How

Bitcoin Price Breakout In Progress—Momentum Builds Above Resistance

Here Are The Bitcoin Levels To Watch For The Short Term

2.52 Million Altcoins Are Ruining Crypto’s Future

Animoca Brands Valuation Tanks 75% In Two Years, Here’s Why

Crypto exchange BingX hacked for $43 million

Are The Big Players Losing Interest?

Hong Kong’s Securities Association Tips Authorities On Crypto Self-Regulation

Coinbase cbBTC Set to go Live on Solana
2.52 Million Altcoins Are Ruining Crypto’s Future
Animoca Brands Valuation Tanks 75% In Two Years, Here’s Why
Crypto exchange BingX hacked for $43 million
Are The Big Players Losing Interest?
Hong Kong’s Securities Association Tips Authorities On Crypto Self-Regulation
Coinbase cbBTC Set to go Live on Solana
-
 Market15 hours ago
1 Year After Bitcoin Halving: What’s Different This Time?
-

 Ethereum21 hours ago
Ethereum Consolidates In Symmetrical Triangle: Expert Predicts 17% Price Move
-

 Market19 hours ago
MELANIA Crashes to All-Time Low Amid Insiders Continued Sales
-

 Market21 hours ago
Today’s $1K XRP Bag May Become Tomorrow’s Jackpot, Crypto Founder Says
-
 Altcoin24 hours ago
What’s Up With BTC, XRP, ETH?
-

 Market20 hours ago
Charles Schwab Plans Spot Crypto Trading Rollout in 2026
-

 Ethereum20 hours ago
Ethereum Enters Historic Buy Zone As Price Dips Below Key Level – Insights
-

 Market16 hours ago
VOXEL Climbs 200% After Suspected Bitget Bot Glitch