
Market
3 AI Coins Smart Wallets Are Buying: VIRTUAL, GROKCOIN, ARC

AI coins have been struggling in recent weeks, but smart money wallets are quietly accumulating Virtuals Protocol (VIRTUAL), GrokCoin (GROKCOIN), and AI Rig Complex (ARC). Despite sharp corrections, these three projects have seen notable inflows from experienced traders, suggesting potential rebounds.
VIRTUAL is down 53% in the last 30 days, ARC has dropped 68%, and GROKCOIN fell 33% in the past 24 hours. Yet, on-chain data reveals increasing accumulation. If momentum returns, these AI coins could recover key resistance levels, but further downside remains a risk if the sector fails to regain strength.
Virtuals Protocol (VIRTUAL)
VIRTUAL, once the biggest AI coin in the market, has been in a steep correction, with its price dropping over 53% in the last 30 days. The prolonged decline has weakened market sentiment, as AI-related tokens have lost momentum after their previous hype cycle.
However, despite this heavy sell-off, recent on-chain data suggests that smart money wallets are accumulating, which could indicate that some investors believe the bottom may be near.
If buying pressure continues to increase, VIRTUAL could stabilize and attempt a recovery.
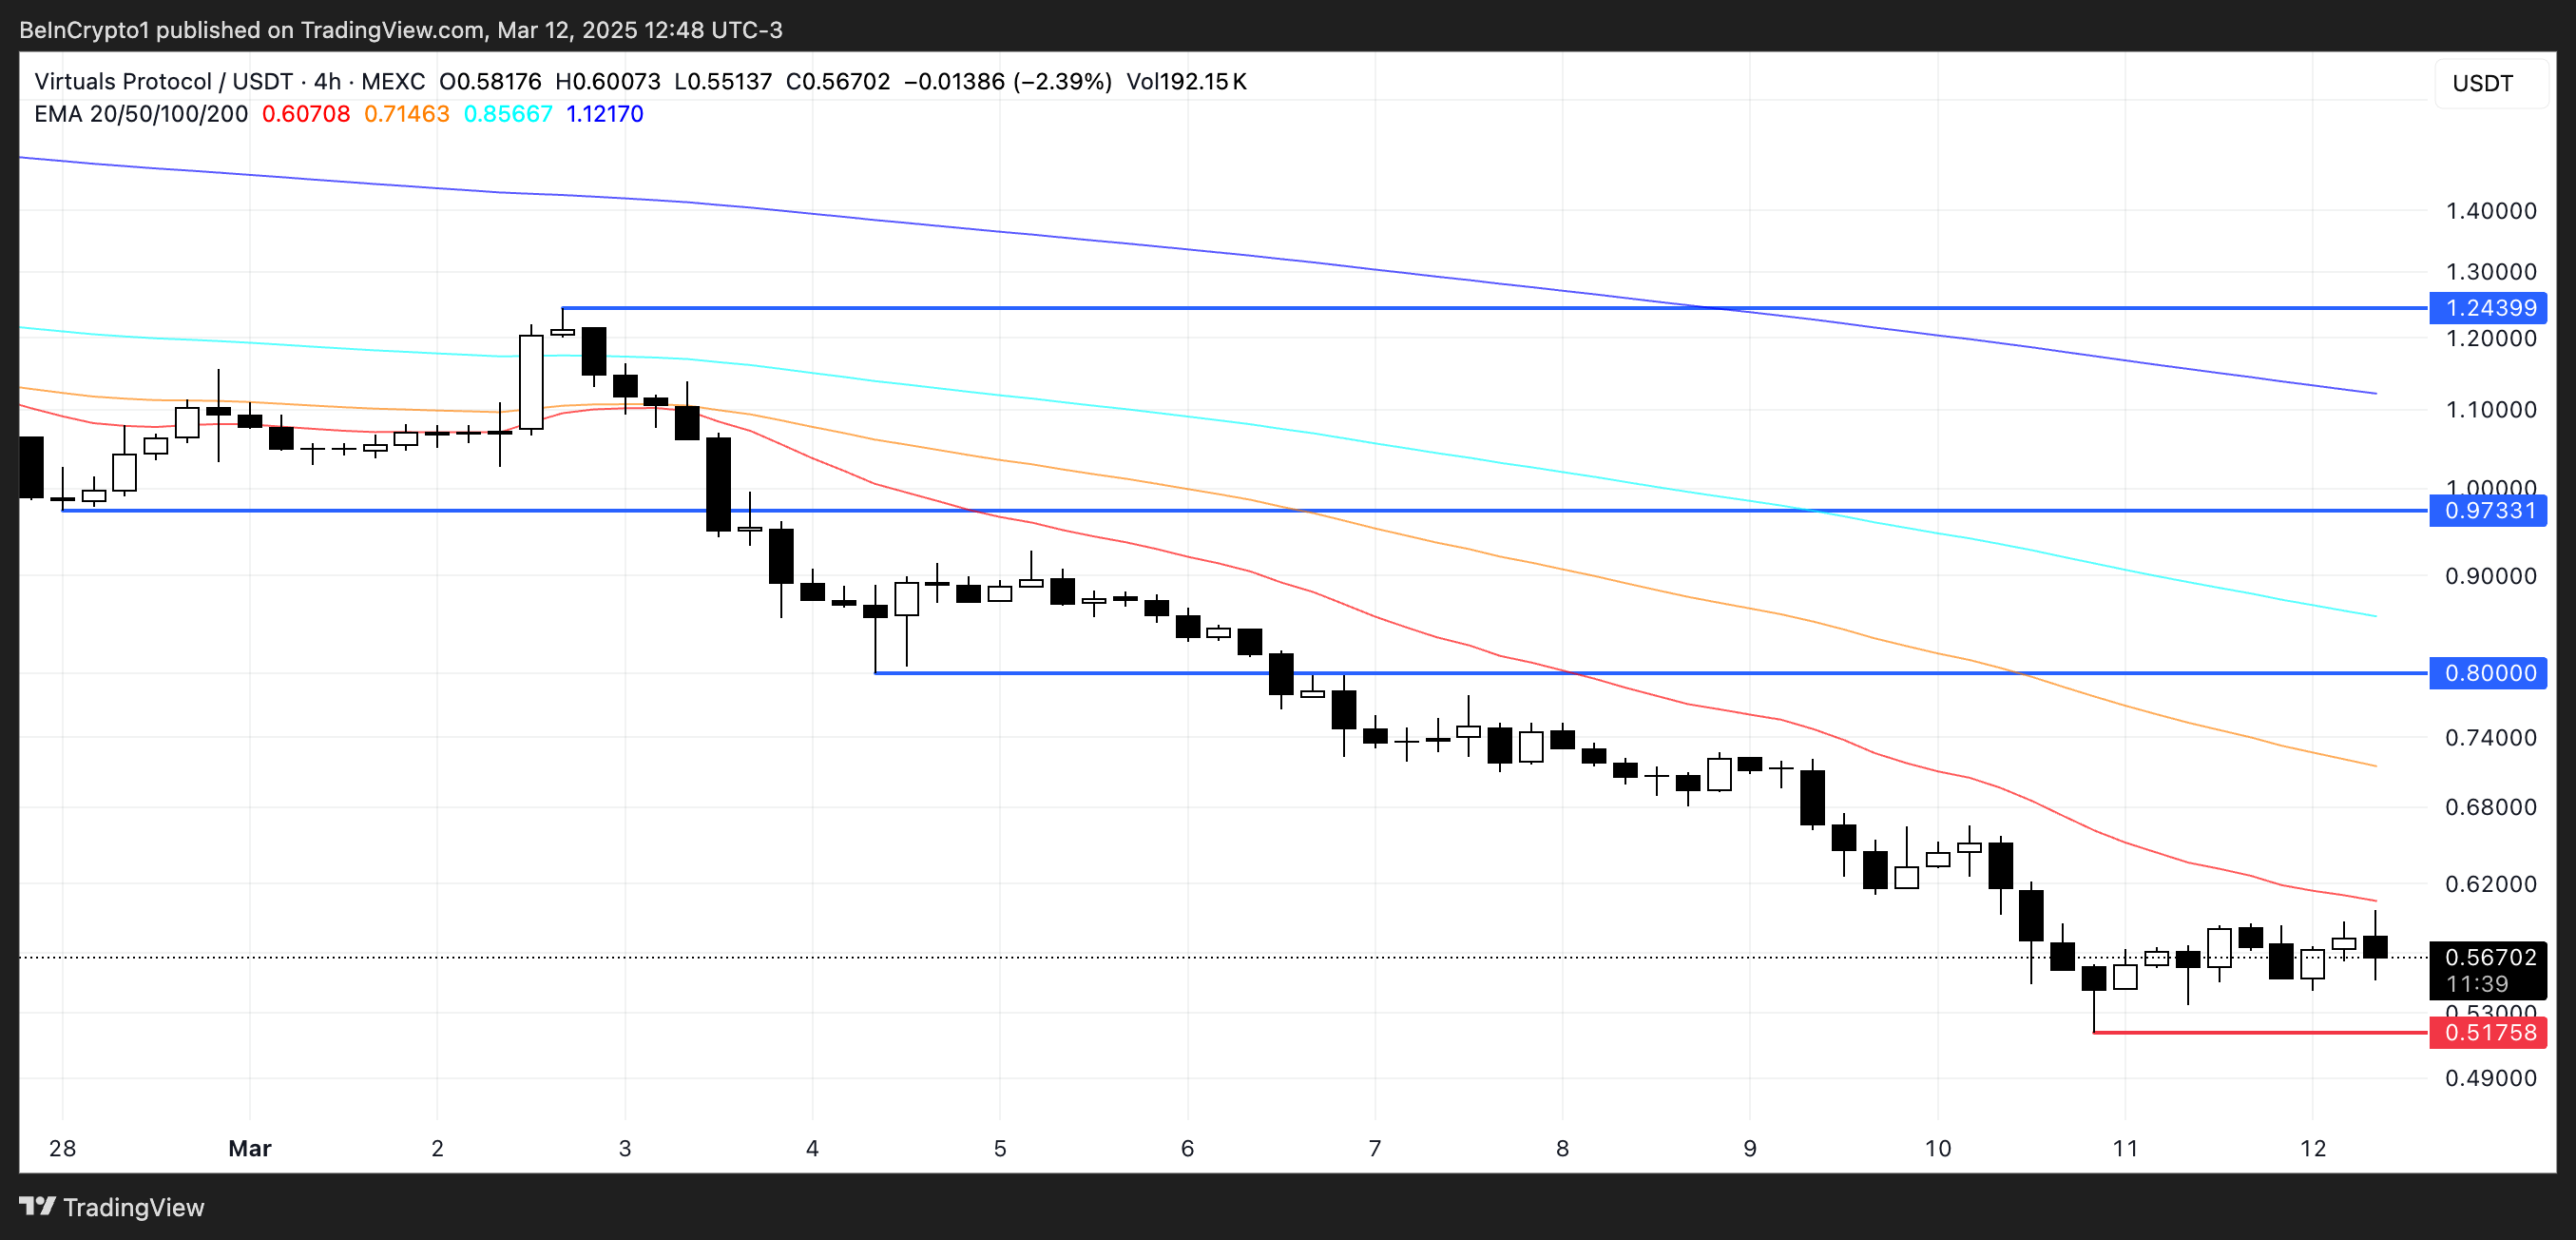
In the last seven days, 21 crypto smart money wallets had a net inflow of $213,430 into VIRTUAL, suggesting renewed confidence from experienced traders.
This accumulation could be the first sign of a potential trend shift, but the price still needs to reclaim key resistance levels to confirm a reversal.
If VIRTUAL regains momentum, it could test $0.80 and $0.97, with a breakout above those levels opening the door for a move toward $1.24. However, for a sustained rally, AI coins need to regain market attention, as recent trends have shifted focus away from this sector.
GrokCoin (GROKCOIN)
GrokCoin (GROKCOIN) is a meme coin that gained rapid popularity due to its origins tied to Elon Musk’s AI, Grok.
The token was initially introduced as a joke following a tweet from Musk but quickly caught the attention of the crypto community.
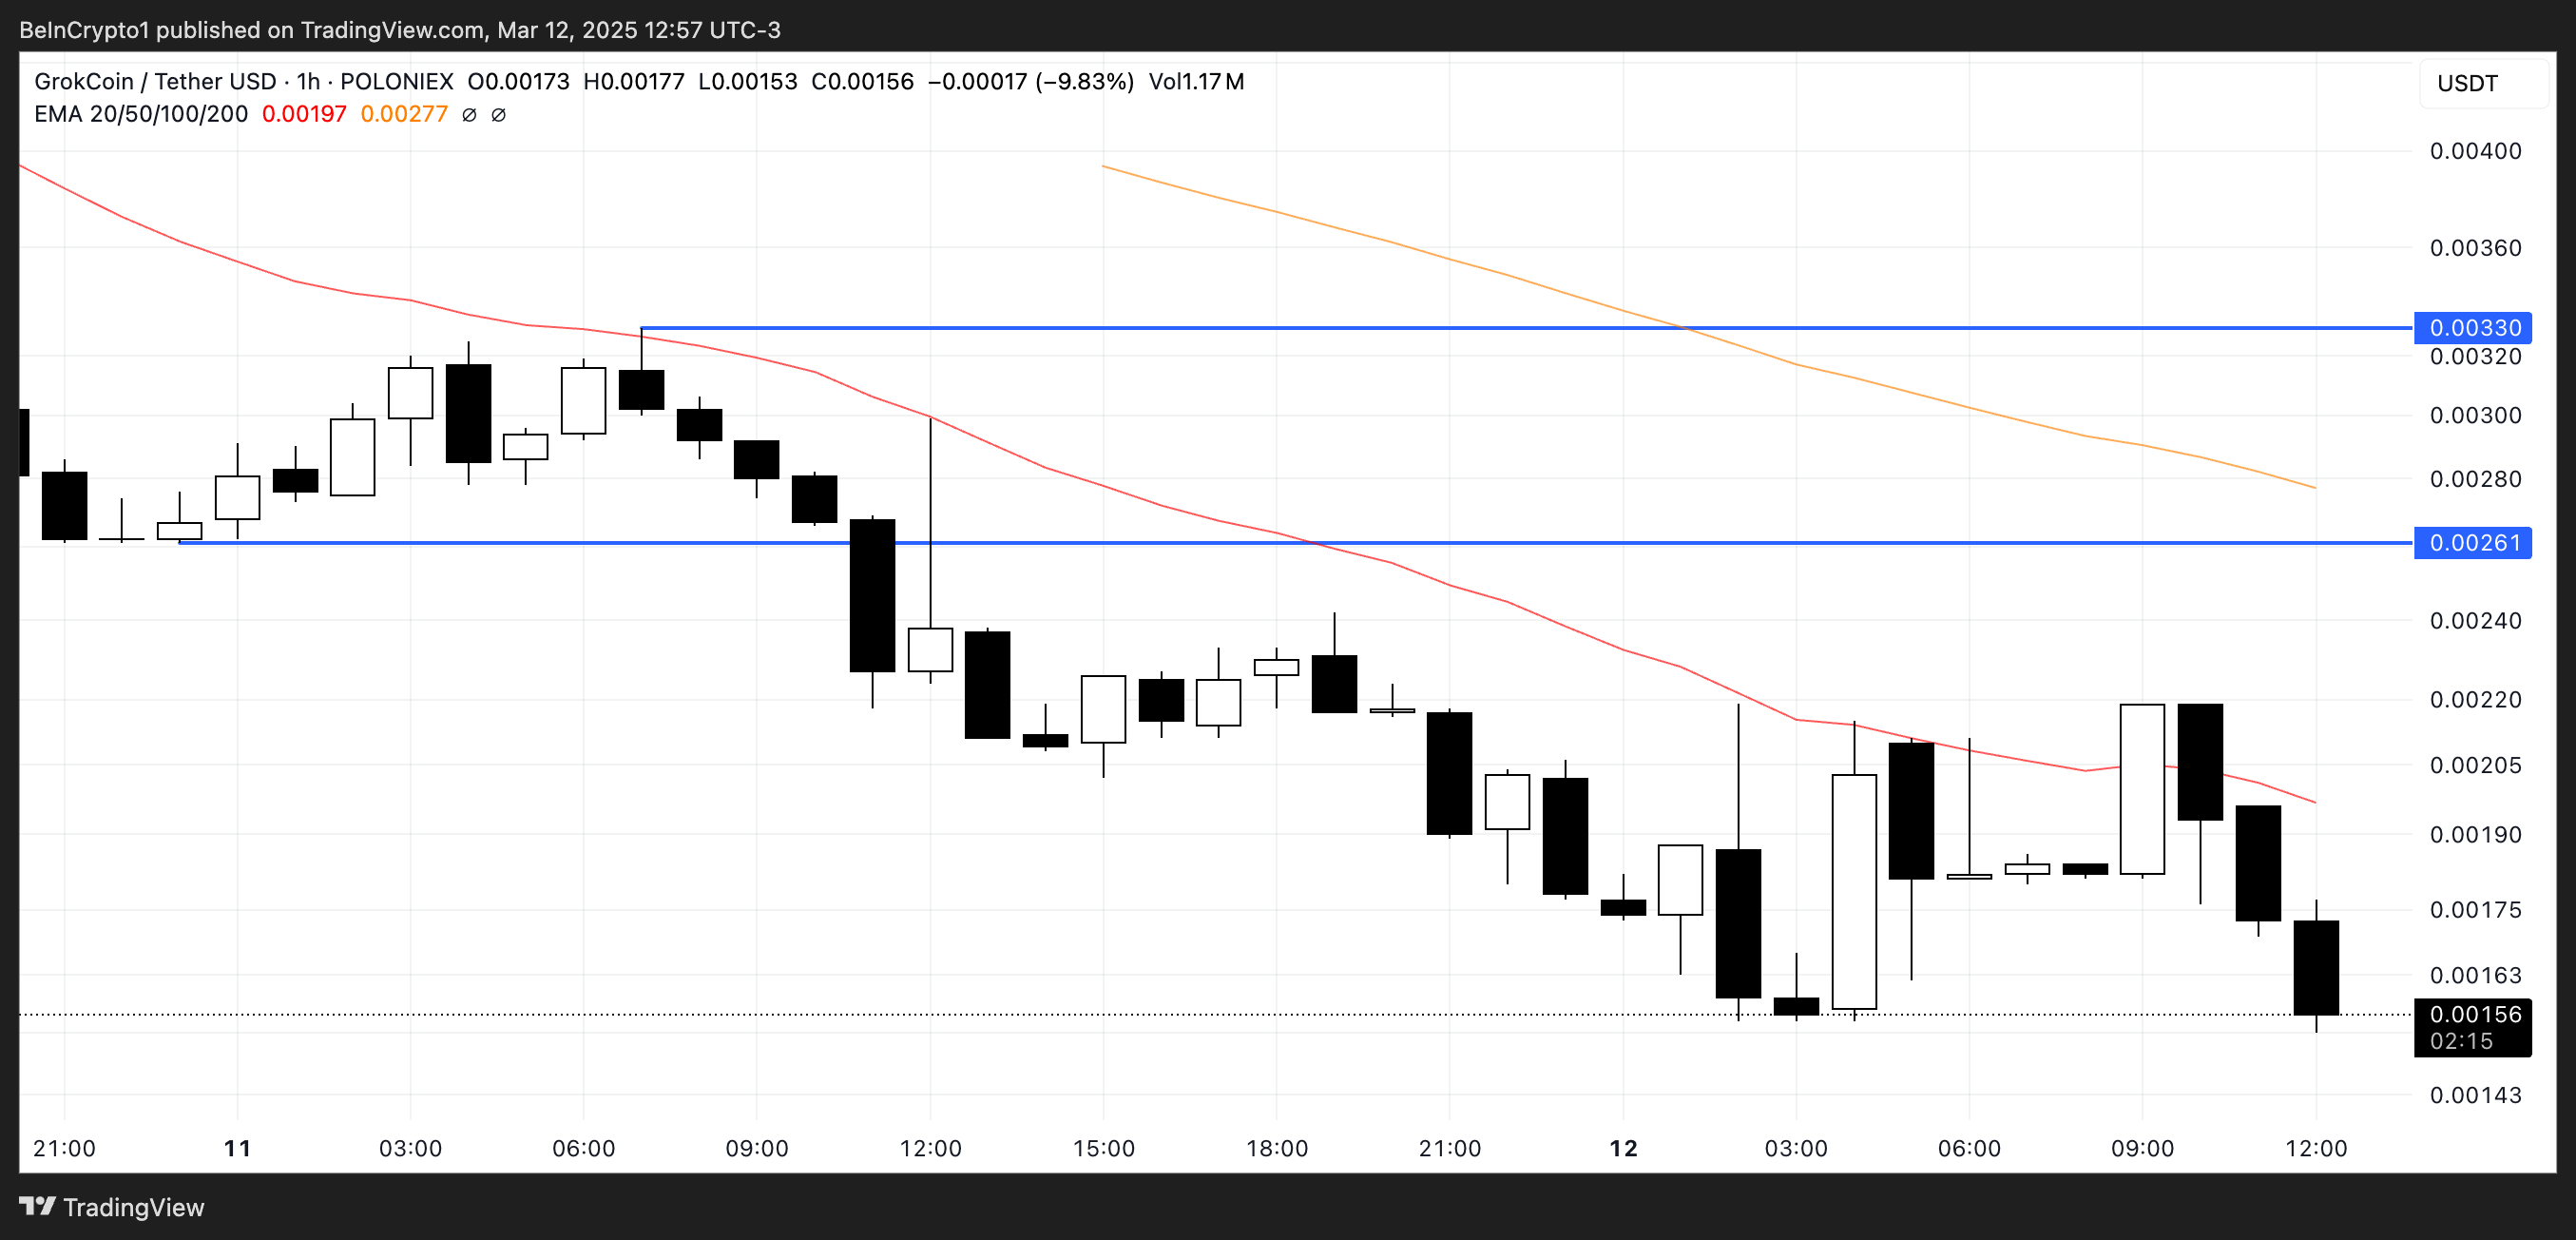
Despite a 33% drop in the last 24 hours, smart money wallets have shown interest, with 54 wallets accumulating a net total of $133,049 in GROKCOIN over the past week.
This suggests that experienced traders may be positioning for a potential rebound. If GROKCOIN can reverse its current downtrend, it could test resistance levels at $0.0026, with a stronger rally potentially pushing it toward $0.0033.
AI Rig Complex (ARC)
ARC has been hit hard by the ongoing correction in AI coins, with its price plunging 68% in the last 30 days. ARC is developing Rig, an open-source framework that enables developers to create portable, modular, and lightweight AI agents.
However, its price action suggests that market sentiment remains weak, with ARC currently trading at its lowest levels ever.
Even with the sharp decline, 14 smart money wallets have accumulated a net total of $47,275 in ARC over the past seven days, signaling potential accumulation.
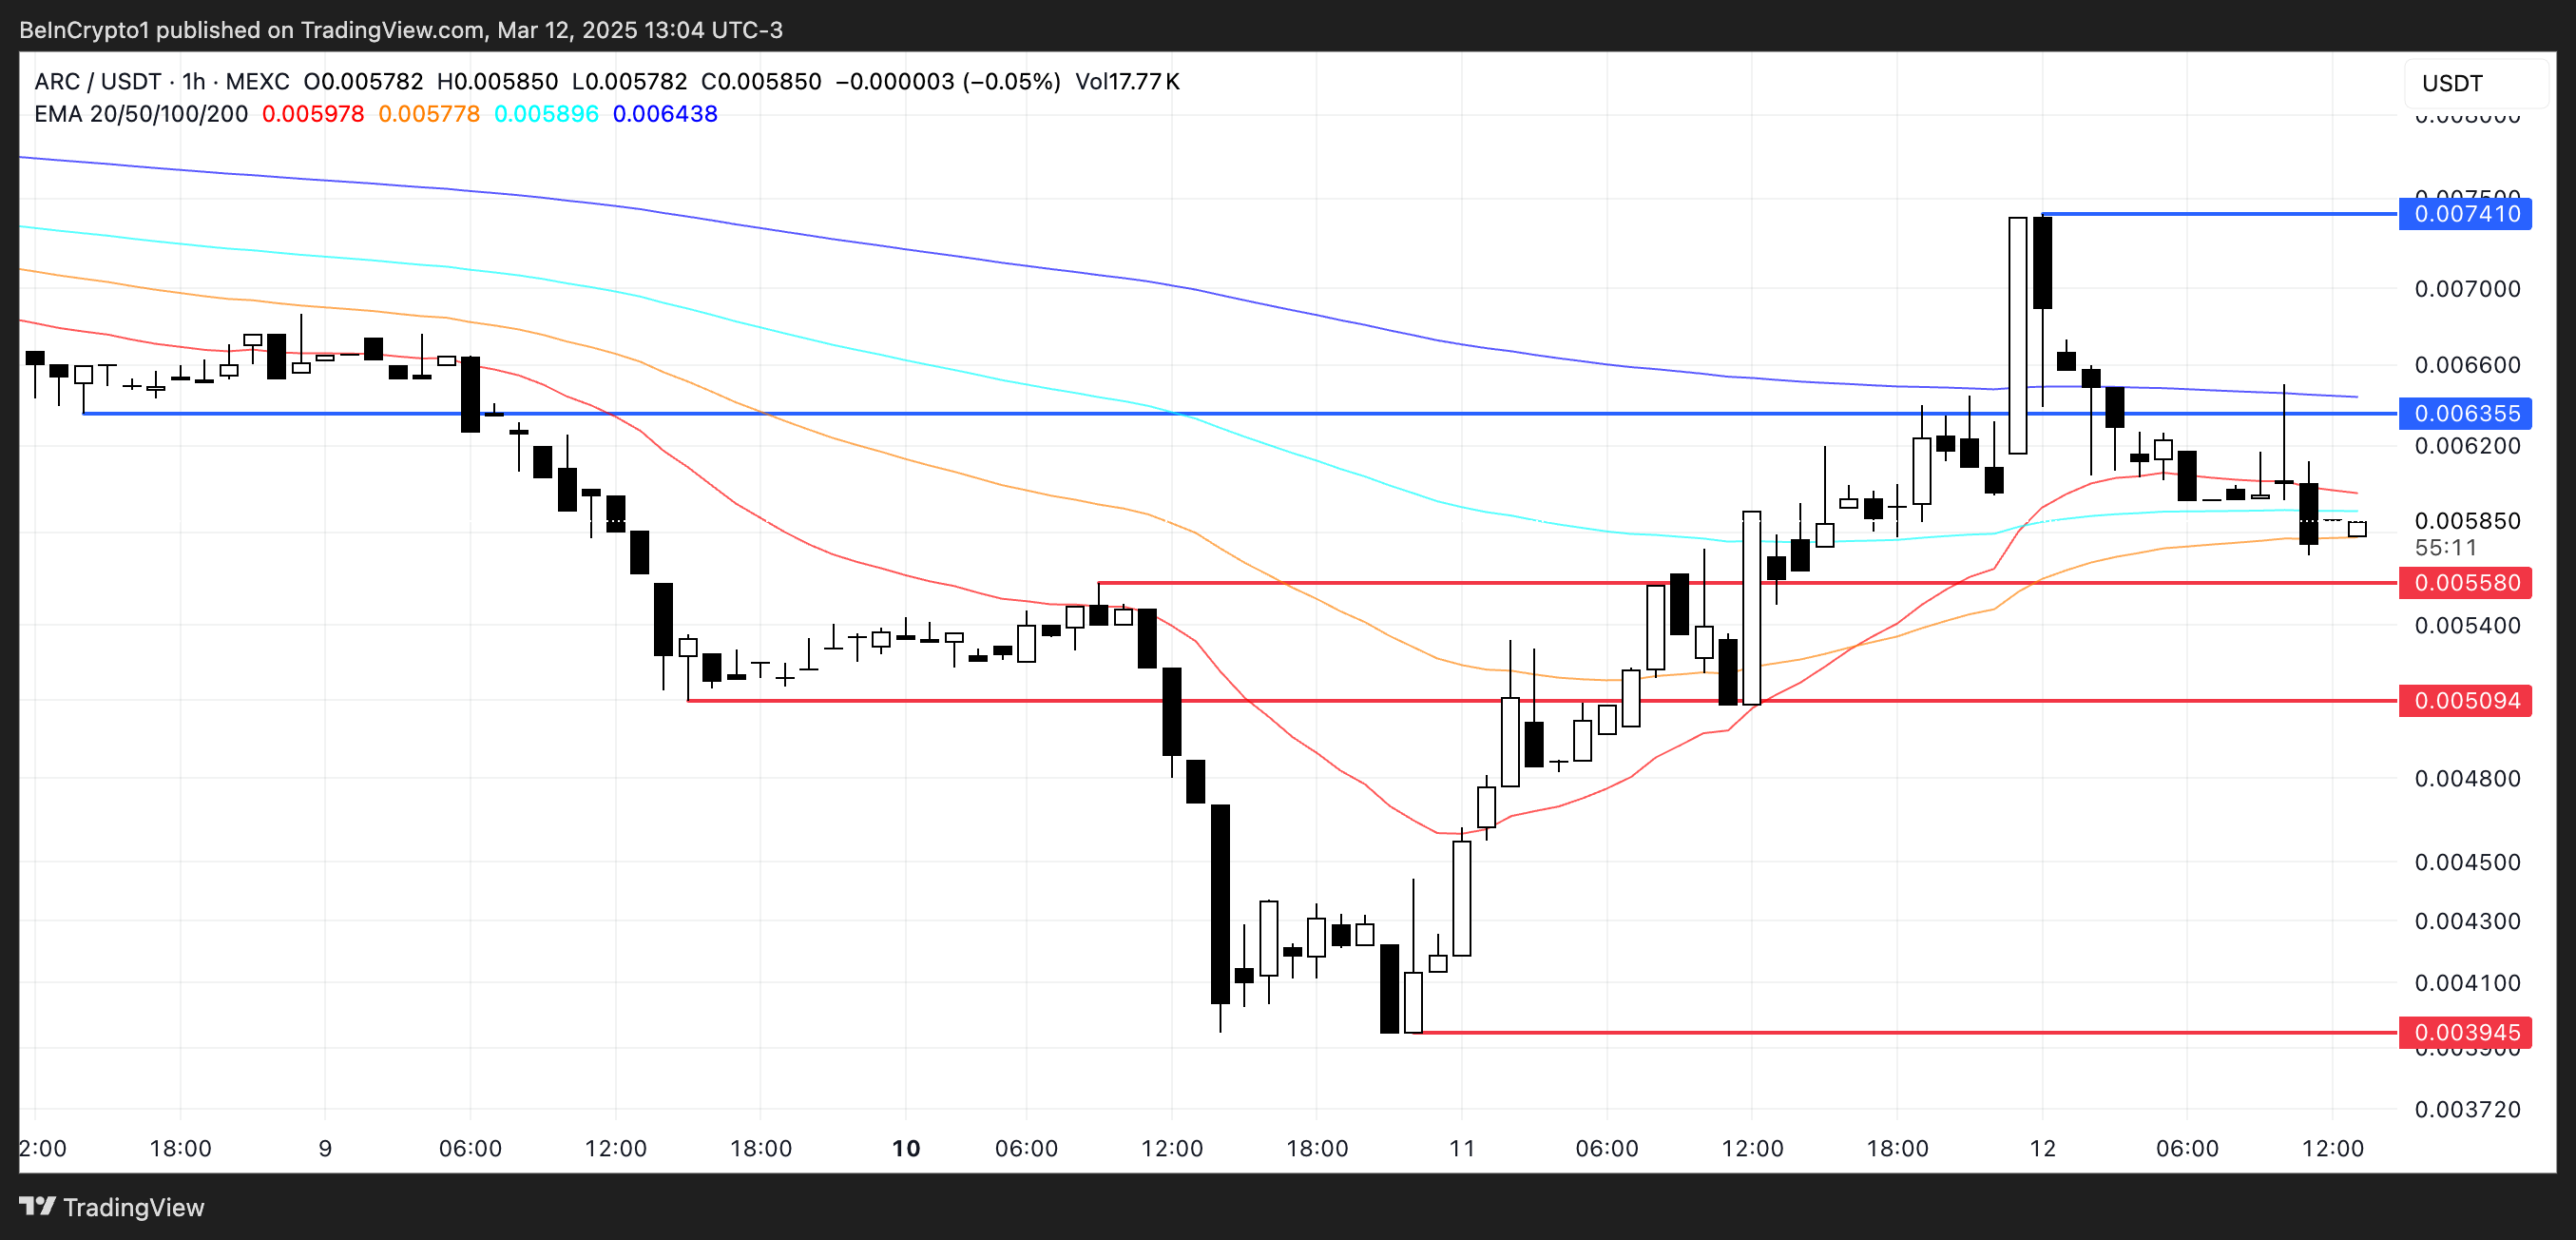
If ARC can regain momentum, it could test $0.0063 and $0.0074, which would mark a significant recovery from current levels.
However, if the correction continues, support at $0.0055 and $0.0050 will be critical, and a break below them could send ARC as low as $0.0039.
Disclaimer
In line with the Trust Project guidelines, this price analysis article is for informational purposes only and should not be considered financial or investment advice. BeInCrypto is committed to accurate, unbiased reporting, but market conditions are subject to change without notice. Always conduct your own research and consult with a professional before making any financial decisions. Please note that our Terms and Conditions, Privacy Policy, and Disclaimers have been updated.


DWF Labs announced today that it invested $25 million into Trump Family-backed World Liberty Financial and is planning to open an office in New York City. It hopes to use this office to drive new relationships with regulators, financial institutions, and more.
Although this partnership would potentially create more liquidity opportunities for the US crypto market, previous allegations against DWF have raised some concerns about political misconduct.
Understanding DWF Labs’ Investment in WLFI
World Liberty Financial (WLFI), one of the Trump family’s major crypto ventures, has been making some big moves since the President’s inauguration in January.
The DeFi project allegedly entered talks with Binance to launch a new stablecoin, and it officially announced USD1 shortly after. Today, WLFI has entered a new partnership with Dubai-based Web3 investment firm DWF Labs.
“The US is the world’s largest single market for digital asset innovation. Our physical presence reflects our confidence in America’s role as the next growth region for institutional crypto adoption. Moreover, the USD1 stablecoin and forthcoming global DeFi solutions align with our broader mission to improve financial services,” claimed Managing Partner Andrei Grachev.
DWF’s statement includes a few key details about its new relationship with WLFI. It essentially boils down to two key points: the firm has already purchased $25 million in WLFI tokens, and it plans to open a physical office in New York City.
On a positive note, this partnership could be significant for the overall US crypto market. DWF Labs has a portfolio of over 700 crypto projects.
So, physically setting up a hub in New York will give me regulatory freedom and the opportunity to invest directly in the local crypto market. This would potentially open up more liquidity for upcoming Web3 projects and startups in the US
Concerns of Financial Misconduct
Although DWF Labs is a popular market maker, it has been at the center of major controversies. Last year, it was accused of wash trading and market manipulation, and Binance allegedly shut down its internal investigation due to financial incentives.
Also, one of its partners was dismissed back in October over allegations of drugging a job applicant. So, the firm’s credibility and reputation have been shaky in recent times.
This is to say that the crypto community has reasons to worry about a deal between DWF and World Liberty Financial. A report from late March determined that most WLFI revenues go directly to Trump’s family.
WLFI owners are unable to actually trade their tokens, and the stated governance use of the assets seems unclear. In other words, there isn’t a clear reason why anyone would invest.
The growing concern is that firms like DWF would invest in WLFI as an easy tool for political corruption. Shortly after the election, Tron founder Justin Sun invested $30 million into World Liberty. Trump’s family apparently got most of this money, and the SEC settled a fraud case against Tron in February.
If DWF Labs invested a similar amount in WLFI, could this give it some legal protection? The Department of Justice already gutted its Crypto Enforcement Team, and New York’s US Attorney also signaled its intent to stop crypto prosecutions.
As this deal goes forward, it will be important to look for signs of any possible financial misconduct.
BeInCrypto has contacted DWF Labs about the 2024 market manipulation claims but has yet to receive a reply.
Disclaimer
In adherence to the Trust Project guidelines, BeInCrypto is committed to unbiased, transparent reporting. This news article aims to provide accurate, timely information. However, readers are advised to verify facts independently and consult with a professional before making any decisions based on this content. Please note that our Terms and Conditions, Privacy Policy, and Disclaimers have been updated.
The TRUMP meme coin has lost 29% of its value over the past month and is now down more than 90% from its all-time high. The sharp decline has been accompanied by weakening momentum across multiple indicators.
Both suggest that bullish strength has faded and downside risks are growing. Adding to the pressure, a large wallet just withdrew millions in USDC ahead of a $317 million token unlock next week, raising concerns about possible selling activity.
Indicators Suggest Weak Momentum for TRUMP Meme Coin
TRUMP’s BBTrend indicator has sharply dropped to 1.58, down from 6.23 just two days ago. This sudden decline suggests that the strength of the previous trend has significantly weakened.
After showing strong momentum earlier in the week, the current BBTrend reading points to a possible shift toward consolidation or even a reversal if buying interest continues to fade.
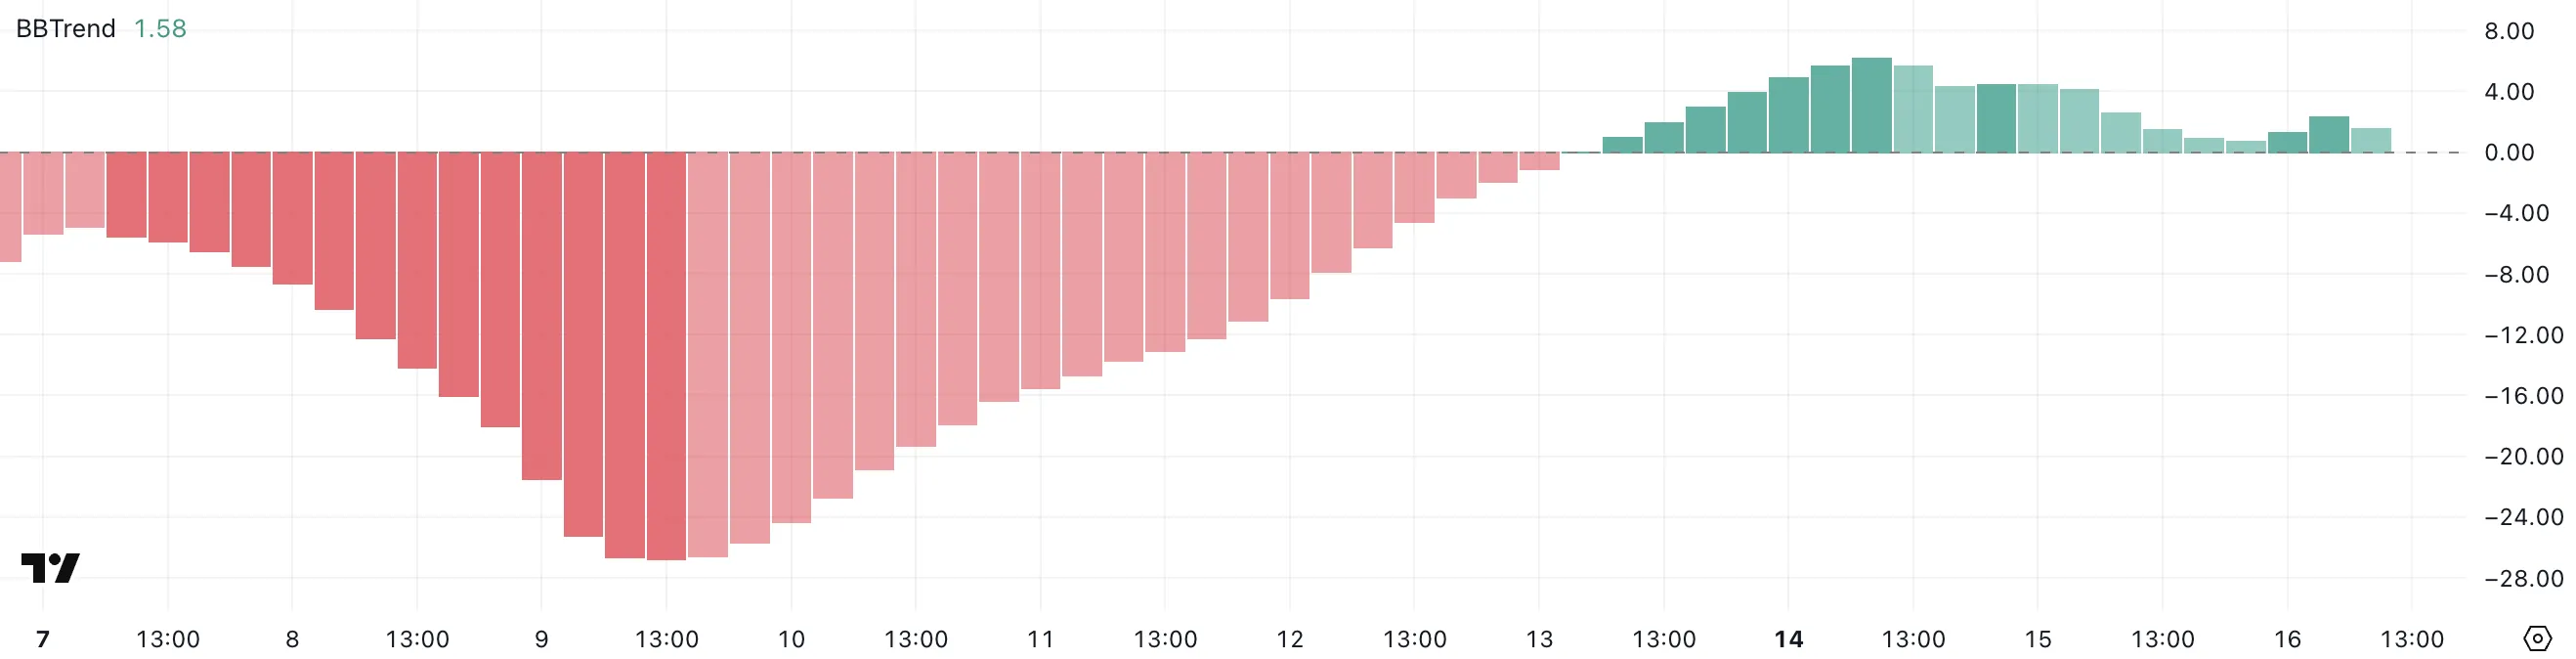
BBTrend, short for Bollinger Band Trend, is a technical indicator that measures the strength of a price trend based on the width of Bollinger Bands.
Higher values typically indicate a strong directional move, while lower values suggest that the market is entering a less volatile phase.
With TRUMP’s BBTrend now at 1.58—close to the neutral zone—it could signal that the strong bullish phase is cooling off. If the indicator continues to fall and the price loses support, it may point to a period of sideways movement or the beginning of a downtrend.
TRUMP’s Ichimoku Cloud chart shows a clear bearish setup. The price is currently trading below both the blue Tenkan-sen (conversion line) and the red Kijun-sen (baseline).

This positioning suggests that short-term momentum remains weak, and buyers have yet to regain control.
The fact that price candles are still beneath the cloud reinforces the ongoing bearish sentiment, as the cloud often acts as resistance when prices are below it.
Looking ahead, the cloud (Kumo) is transitioning from red to green but remains flat and narrow, signaling limited upside strength. The green Senkou Span A is only slightly above the red Senkou Span B, meaning the future trend outlook is still uncertain and lacks conviction.
For any bullish reversal to gain traction, TRUMP meme coin would need to break above the cloud with strong volume. Until that happens, the chart points to continued caution, with the potential for more sideways or downward price action.
Whale Withdrawal Raises Concerns Ahead of $317 Million TRUMP Unlock
A wallet linked to Donald Trump’s memecoin withdrew $4.6 million in USDC from the Solana DEX Meteora on Tuesday.
These funds were previously used to provide liquidity for the TRUMP-USDC trading pair. They helped ensure smoother trading and price stability. This wallet has made a withdrawal for the first time, and the size and timing of the move make it noteworthy.
Even after the withdrawal, the pool still holds around $205 million in USDC and $122 million in TRUMP tokens.

This activity comes just days before a major unlock event set for next Friday. Around $317 million worth of TRUMP meme coin tokens will become available.
Unlocks often worry investors as they increase token supply. If a large portion is sold, it can push prices down. The $4.6 million withdrawal has raised speculation about insider moves. Some believe funds are being repositioned ahead of the unlock.
While it’s not clear if a selloff is coming, the timing suggests caution. In the days ahead, on-chain activity should be closely watched.
Disclaimer
In line with the Trust Project guidelines, this price analysis article is for informational purposes only and should not be considered financial or investment advice. BeInCrypto is committed to accurate, unbiased reporting, but market conditions are subject to change without notice. Always conduct your own research and consult with a professional before making any financial decisions. Please note that our Terms and Conditions, Privacy Policy, and Disclaimers have been updated.

Crypto users often focus on user interfaces and pay less attention to the complex internal protocols. Security experts recently raised concerns about a critical vulnerability in Crypto-MCP (Model-Context-Protocol), a protocol for connecting and interacting with blockchains.
This flaw could allow hackers to steal digital assets. They could redirect transactions or expose the seed phrase — the key to accessing a crypto wallet.
How Dangerous is the Crypto-MCP Vulnerability?
Crypto-MCP is a protocol designed to support blockchain tasks. These tasks include querying balances, sending tokens, deploying smart contracts, and interacting with decentralized finance (DeFi) protocols.
Protocols like Base MCP from Base, Solana MCP from Solana, and Thirdweb MCP offer powerful features. These include real-time blockchain data access, automated transaction execution, and multi-chain support. However, the protocol’s complexity and openness also introduce security risks if not properly managed.
Developer Luca Beurer-Kellner first raised the issue in early April. He warned that an MCP-based attack could leak WhatsApp messages via the protocol and bypass WhatsApp’s security.
Following that, Superoo7—head of Data and AI at Chromia—investigated and reported a potential vulnerability in Base-MCP. This issue affects Cursor and Claude, two popular AI platforms. The flaw allows hackers to use “prompt injection” techniques to change the recipient address in crypto transactions.
For example, if a user tries to send 0.001 ETH to a specific address, a hacker can insert malicious code to redirect the funds to their wallet. What’s worse, the user may not notice anything wrong. The interface will still show the original intended transaction details.
“This risk comes from using a ‘poisoned’ MCP. Hackers could trick Base-MCP into sending your crypto to them instead of where you intended. If this happens, you might not notice,” Superoo7 said.

Developer Aaronjmars pointed out an even more serious issue. Wallet seed phrases are often stored unencrypted in the MCP configuration files. If hackers gain access to these files, they can easily steal the seed phrase and fully control the user’s wallet and digital assets.
“MCP is an awesome architecture for interoperability & local-first interactions. But holy shit, current security is not tailored for Web3 needs. We need better proxy architecture for wallets,” Aaronjmars emphasized.
So far, no confirmed cases of this vulnerability being exploited to steal crypto assets exist. However, the potential threat is serious.
According to Superoo7, users should protect themselves by using MCP only from trusted sources, keeping wallet balances minimal, limiting MCP access permissions, and using the MCP-Scan tool to check for security risks.
Hackers can steal seed phrases in many ways. A report from Security Intelligence at the end of last year revealed that an Android malware called SpyAgent targets seed phrases by stealing screenshots.
Kaspersky also discovered SparkCat malware that extracts seed phrases from images using OCR. Meanwhile, Microsoft warned about StilachiRAT, malware that targets 20 crypto wallet browser extensions on Google Chrome, including MetaMask and Trust Wallet.
Disclaimer
In adherence to the Trust Project guidelines, BeInCrypto is committed to unbiased, transparent reporting. This news article aims to provide accurate, timely information. However, readers are advised to verify facts independently and consult with a professional before making any decisions based on this content. Please note that our Terms and Conditions, Privacy Policy, and Disclaimers have been updated.

DWF Invests $25 Million in Trump’s World Liberty Financial
Are TRUMP Meme Coin Investors Selling Before Friday’s Unlock?

Mantra (OM) Price Pumps As Founder Reveals Massive Token Burn Plan

This Crypto Security Flaw Could Expose Seed Phrases
Mantra’s OM Token Surges 25% After Token Burn Announcement

BNB Burn Reduces Circulating Supply by $916 Million

2.52 Million Altcoins Are Ruining Crypto’s Future

Animoca Brands Valuation Tanks 75% In Two Years, Here’s Why

Crypto exchange BingX hacked for $43 million

Are The Big Players Losing Interest?

Hong Kong’s Securities Association Tips Authorities On Crypto Self-Regulation

Coinbase cbBTC Set to go Live on Solana
2.52 Million Altcoins Are Ruining Crypto’s Future
Animoca Brands Valuation Tanks 75% In Two Years, Here’s Why
Crypto exchange BingX hacked for $43 million
Are The Big Players Losing Interest?
Hong Kong’s Securities Association Tips Authorities On Crypto Self-Regulation
Coinbase cbBTC Set to go Live on Solana
-

 Market21 hours ago
Bitcoin Eyes $90,000, But Key Resistance Levels Loom
-

 Market17 hours ago
Solana (SOL) Jumps 20% as DEX Volume and Fees Soar
-

 Market16 hours ago
Hedera Under Pressure as Volume Drops, Death Cross Nears
-

 Market23 hours ago
ETH Retail Traders Boost Demand Despite Institutional Outflows
-
 Altcoin23 hours ago
Could Tomorrow’s Canada Solana ETF Launch Push SOL Price to $200?
-

 Ethereum18 hours ago
Ethereum Metrics Reveal Critical Support Level – Can Buyers Step In?
-

 Bitcoin21 hours ago
Bitcoin Adoption Grows As Public Firms Raise Holdings In Q1
-

 Market15 hours ago
Ethena Labs Leaves EU Market Over MiCA Compliance
