
Market
200 Million XRP Tokens On The Move, Where Are They Headed?

On-chain transaction data shows the XRP ecosystem recently witnessed an enormous movement of 200 million XRP tokens worth $94.5 million ahead of the periodic unlock from escrow. This transaction was recorded on-chain on June 30 between two unknown wallets, indicating it isn’t an escrow unlock. Although the periodic unlock has already been completed since this transaction, XRP traders and enthusiasts are still fascinated by its enormous nature, prompting a detailed look into the on-chain data.
Breaking Down The 200 Million XRP Transfer
According to on-chain data initially noted by large transaction tracker Whale Alerts, 200 million tokens were transferred from an unknown wallet to another unknown wallet on June 30, 2024. The XRP ecosystem is home to many whale addresses, so large transactions from whales are a common sight. The majority of these involve transactions from unknown addresses and crypto exchanges, and vice versa, indicating periods of whale selloffs and accumulations.

— Whale Alert (@whale_alert) June 30, 2024
The initial transfer was made from address “rP4X2h” to address “rJqiMb.” Interestingly, on-chain data indicates the recipient wallet was activated by Ripple as far back as October 2021 and is one of the wallets used for periodic selloffs and moving tokens between wallets. Similarly, the source wallet was activated in October 2023 by the recipient wallet, which connects both wallet addresses to Ripple.
However, on-chain data indicates that the tokens were not transferred into any crypto exchange. They were left sitting in the recipient’s wallet for around 48 hours before a subsequent transfer of 100 million XRP back to the source address “rP4X2h.” This points to the transaction being only a movement around addresses controlled by Ripple.
Related Reading
At the time of writing, address “rJqiMb” holds 107.2 million tokens worth $51.4 million, and address “rP4X2h” holds 93.6 million XRP tokens worth $44.9 million.
At the time of writing, XRP is trading at $0.48, and Ripple’s July unlock of 1 billion XRP tokens has been completed. The unlock occurred in batches of 400 million XRP, 100 million XRP, and 500 million XRP, respectively.
While big movements such as these used to spark wild speculation among investors, the community has grown accustomed to Ripple’s token management practices. Still, any sizable transaction raises questions about Ripple’s motives and future plans.
Featured image created with Dall.E, chart from Tradingview.com


Standard Chartered has predicted that Bitcoin (BTC) will likely break above $88,500 this weekend following a strong performance in the tech sector.
The bank’s Global Head of Digital Assets Research, Geoff Kendrick, shared these expectations in an exclusive with BeInCrypto.
What Standard Chartered Says About Bitcoin This Weekend
In an email to BeInCrypto, Kendrick pointed to recent price action among major technology stocks, including Microsoft, as an indicator of Bitcoin’s short-term trajectory.
“Strongest performers were MSFT and BTC. Same again so for today in Bitcoin spot and tech futures,” Kendrick said.
He explained that a decisive break above the critical $85,000 level appears likely post-US non-farm payrolls. The Standard Chartered executive explained that such an outcome would pave the way for a return to Wednesday’s pre-tariff level of $88,500.
However, China’s retaliatory tariffs could increase market uncertainty, driving prices down in the short term. This volatility might dampen investor confidence, overshadowing any weekend gains.
Kendrick’s assertions come ahead of the much-anticipated US employment report, Non-Farm Payrolls (NFP). The report would present a comprehensive labor market update, including jobs added, the unemployment rate, and wage growth.
A strong report could bolster faith in the economy, particularly if it comes in higher than the previous reading of 151,000 jobs. This is more so if accompanied by a steady 4.1% unemployment rate. Such an outcome could curb crypto gains if the dollar rallies.
Conversely, a disappointing tally, potentially below the median forecast of 140,000 jobs with unemployment ticking beyond 4.1%, could ignite recession worries. This would send investors flocking to Bitcoin and crypto.
Standard Chartered may be pivoting to the latter outcome, with Kendrick emphasizing Bitcoin’s growing role as a key asset.
“Bitcoin is proving itself to be the best of tech upside when stocks go up and also as a hedge in multiple scenarios…I argued that Bitcoin trades more like tech stocks than it does gold most of the time. At other times, and structurally, Bitcoin is useful as a TradFi hedge,” he added.
Standard Chartered has increasingly highlighted Bitcoin’s strategic importance within financial markets. The bank recently identified Bitcoin and Avalanche (AVAX) as likely beneficiaries of a potential post-Liberation Day crypto surge. BeInCrypto reported the forecast, which now aligns with the latest one, that institutional investors could be preparing for a market upswing.
Additionally, the bank has positioned Bitcoin as a growing hedge against inflation. It argued that its limited supply and decentralized nature make it an attractive alternative to traditional safe-haven assets.
Standard Chartered Calls to HODL Bitcoin
Amid Bitcoin’s growing role in traditional finance (TradFi), Kendrick advised investors to maintain their holdings.
“Over the last 36 hours, I think we can also add ‘US isolation’ hedge to the list of Bitcoin uses,” he added.
This suggests that Bitcoin could serve as a protective asset in geopolitical and macroeconomic uncertainty.
Meanwhile, the BTC/USDT daily chart shows a critical technical setup, with Bitcoin’s price currently trading around $82,643. A former support level of $85,000 now stands as resistance, limiting the pioneer crypto’s upside potential. The supply zone near $86,508 adds further selling pressure.
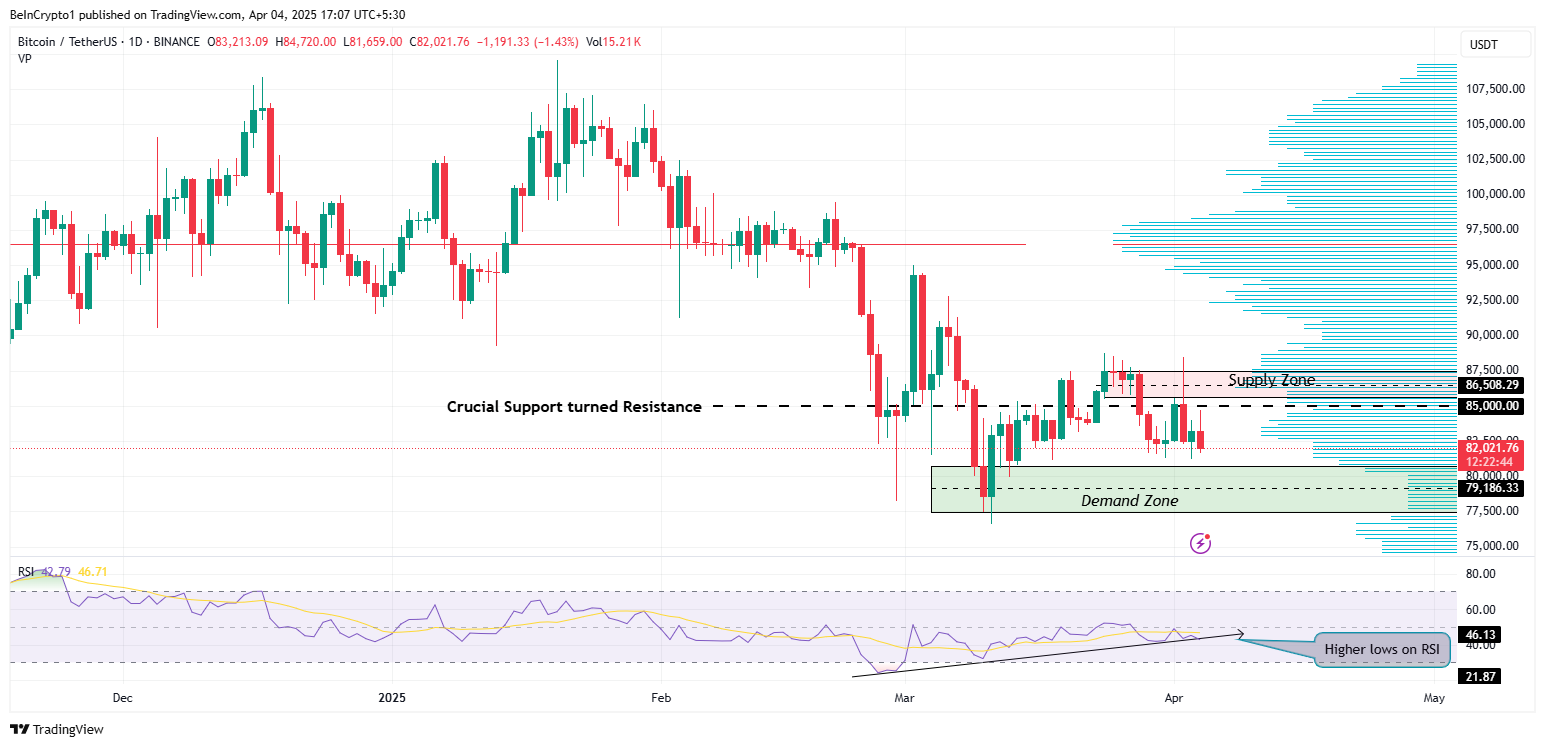
On the downside, a key demand zone between $77,500 and $80,708 provides support. Despite price consolidation, the Relative Strength Index (RSI) is forming higher lows, indicating sustained growing momentum and a potential reversal.
If BTC successfully reclaims $85,000, it could trigger a move toward $87,480. However, to confirm the continuation of the uptrend, BTC must record a daily candlestick close above the midline of the supply zone at $86,508.
The bullish volume profile (blue) supports this thesis, showing that bulls are waiting to interact with the Bitcoin price above the midline of the supply zone.
Failure to breach the immediate resistance at $85,000 might lead to a retest of the demand zone, potentially breaking lower. In such a directional bias, a break and close below the midline of this zone at $79,186 could exacerbate the downtrend.
Disclaimer
In adherence to the Trust Project guidelines, BeInCrypto is committed to unbiased, transparent reporting. This news article aims to provide accurate, timely information. However, readers are advised to verify facts independently and consult with a professional before making any decisions based on this content. Please note that our Terms and Conditions, Privacy Policy, and Disclaimers have been updated.

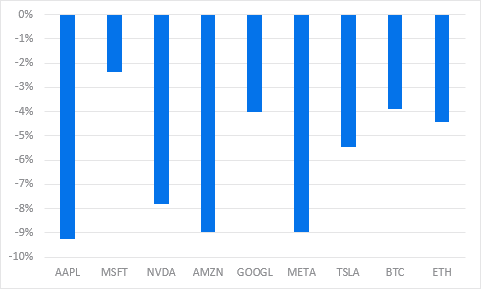
After a surge in Bitcoin spot ETF inflows on April 2, yesterday’s market action painted a different picture as institutional investors began offloading BTC holdings.
Despite this retreat, futures traders remain confident, with open interest climbing and funding rates staying positive. However, the options market tells a different story, with traders showing less conviction in sustained upward momentum. As a key batch of BTC options nears expiration, all eyes are on how the market will respond to this divergence.
BTC Spot ETFs See $99.86 Million Outflow as Institutional Confidence Wavers
Institutional investors withdrew liquidity from BTC spot ETFs yesterday, resulting in a net outflow of $99.86 million.
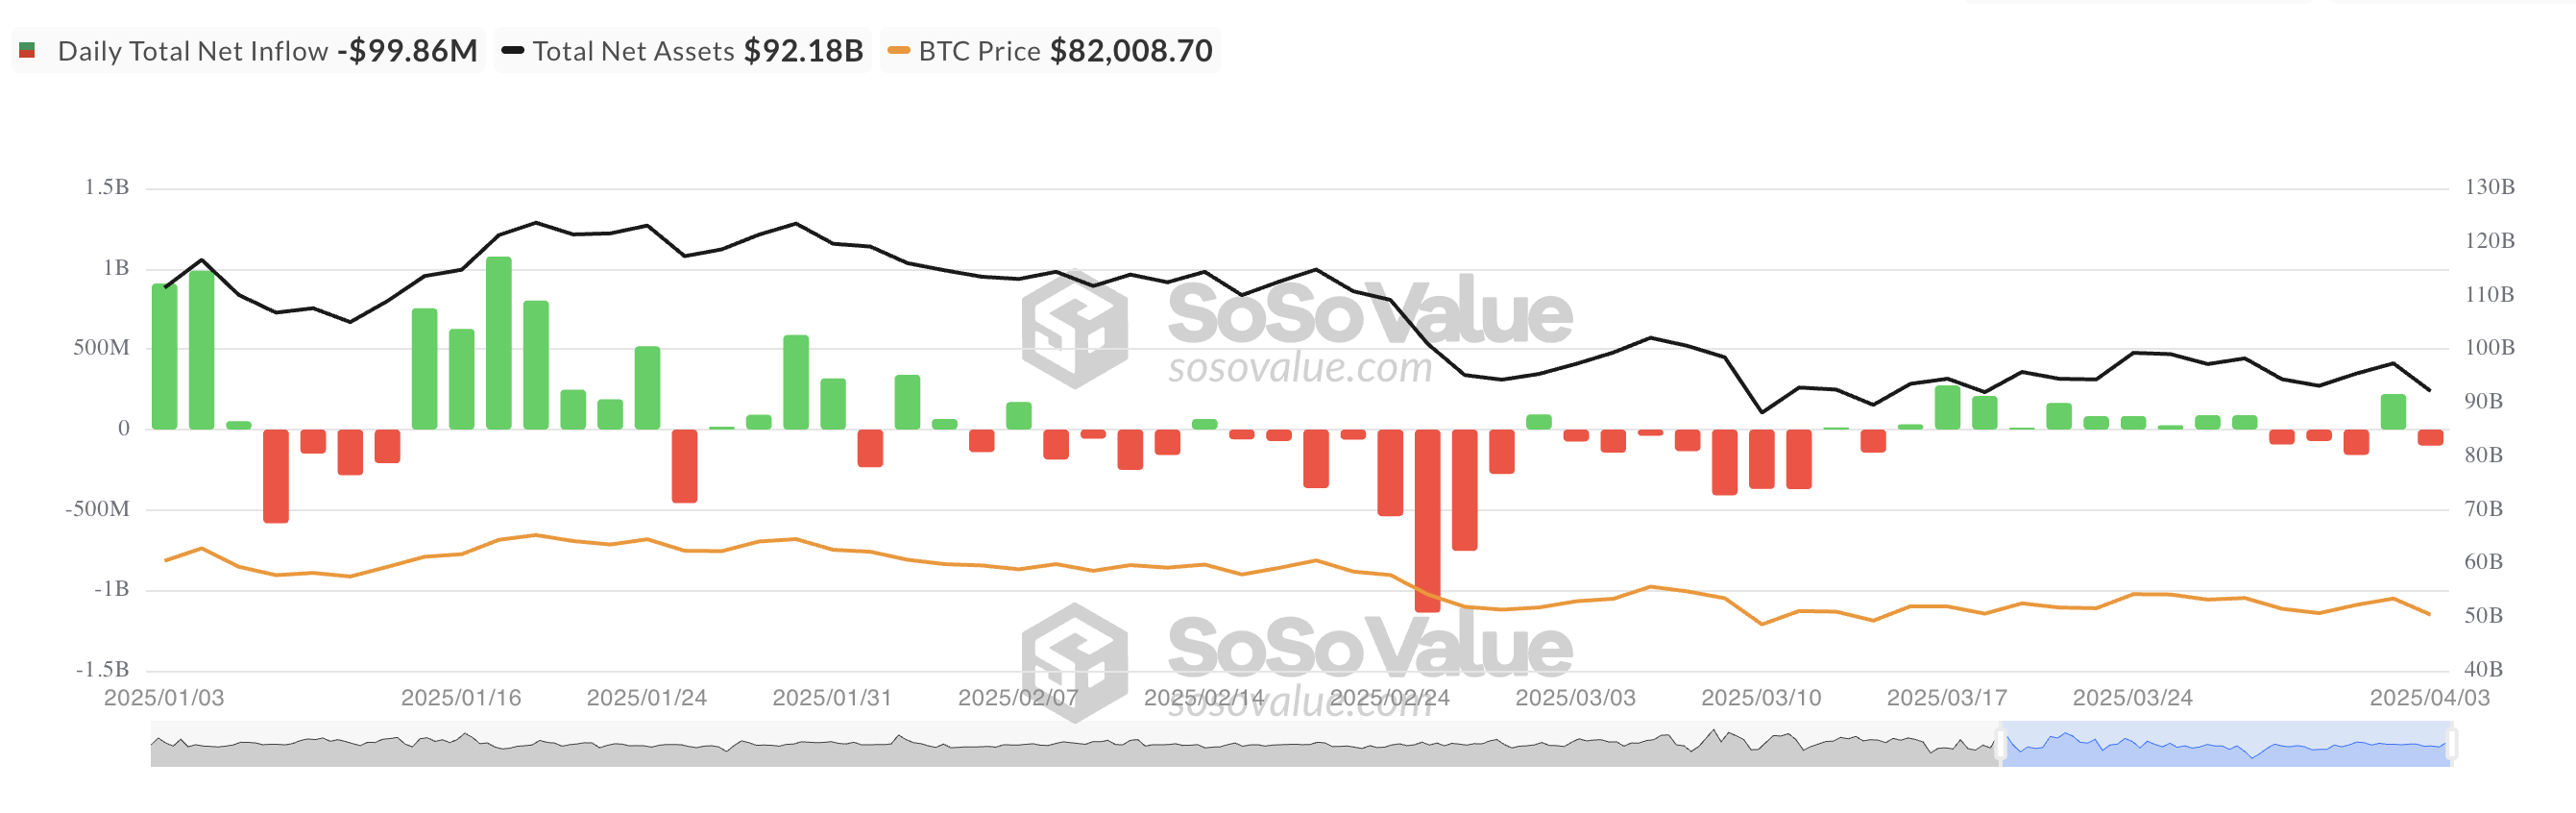
This abrupt shift followed April 2’s $767 million net inflow, which ended a three-day streak of outflows. It signaled a brief return of institutional confidence before momentum quickly reversed.
Grayscale’s ETF GBTC saw the highest amount of fund exits, with a daily net outflow of $60.20 million, bringing its net assets under management to $22.60 billion.
However, BlackRock’s ETF IBIT stood out, witnessing a daily net inflow of $65.25 million. At press time, Bitcoin Spot ETFs have a total net asset value of $92.18 billion, plummeting 5% over the past 24 hours.
Bitcoin Derivatives Split as Traders Bet on Both Sides of the Market
Meanwhile, the derivatives market remains split—Bitcoin futures traders are leaning bullish, backed by rising open interest and positive funding rates. In contrast, options traders appear more hesitant, signaling uncertainty in the market’s next move.
At press time, Bitcoin futures open is $52.63 billion, up 2% over the past day. The coin’s funding rate remains positive and currently stands at 0.0084%.
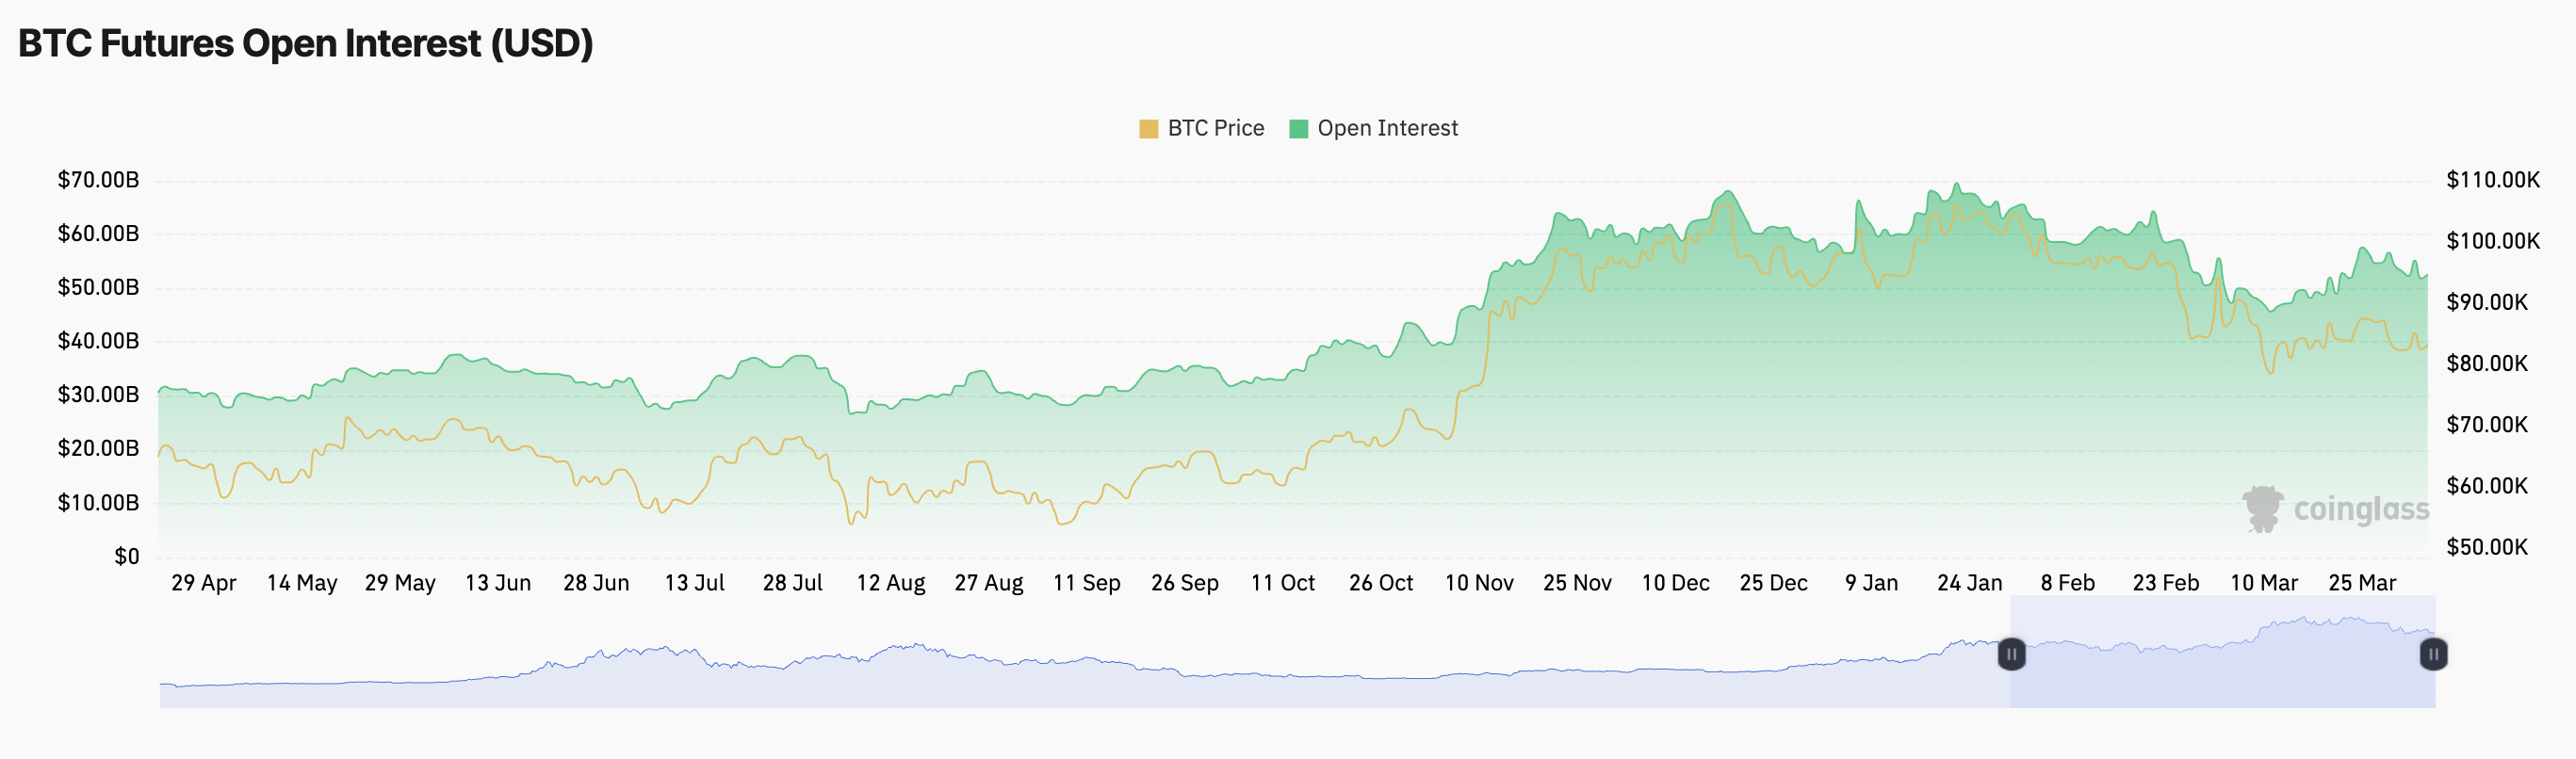
Notably, amid the broader market dip, BTC’s price has noted a minor 0.34% decline during the review period.
When BTC’s price declines while its futures open interest rises and funding rates remain positive, it suggests that traders are increasing leveraged positions despite the price drop. The positive funding rate indicates that long positions remain dominant, meaning traders expect a rebound.
However, caution is advised. If BTC’s price continues to fall, it could trigger long liquidations as overleveraged positions get squeezed.
In contrast, the options market tells a different story, with traders showing less conviction in sustained upward momentum. This is evident from the high demand for put options.
According to Deribit, the notional value of BTC options expiring today is $2.17 billion, with a put-to-call ratio of 1.24. This confirms the prevalence of sales options among market participants.
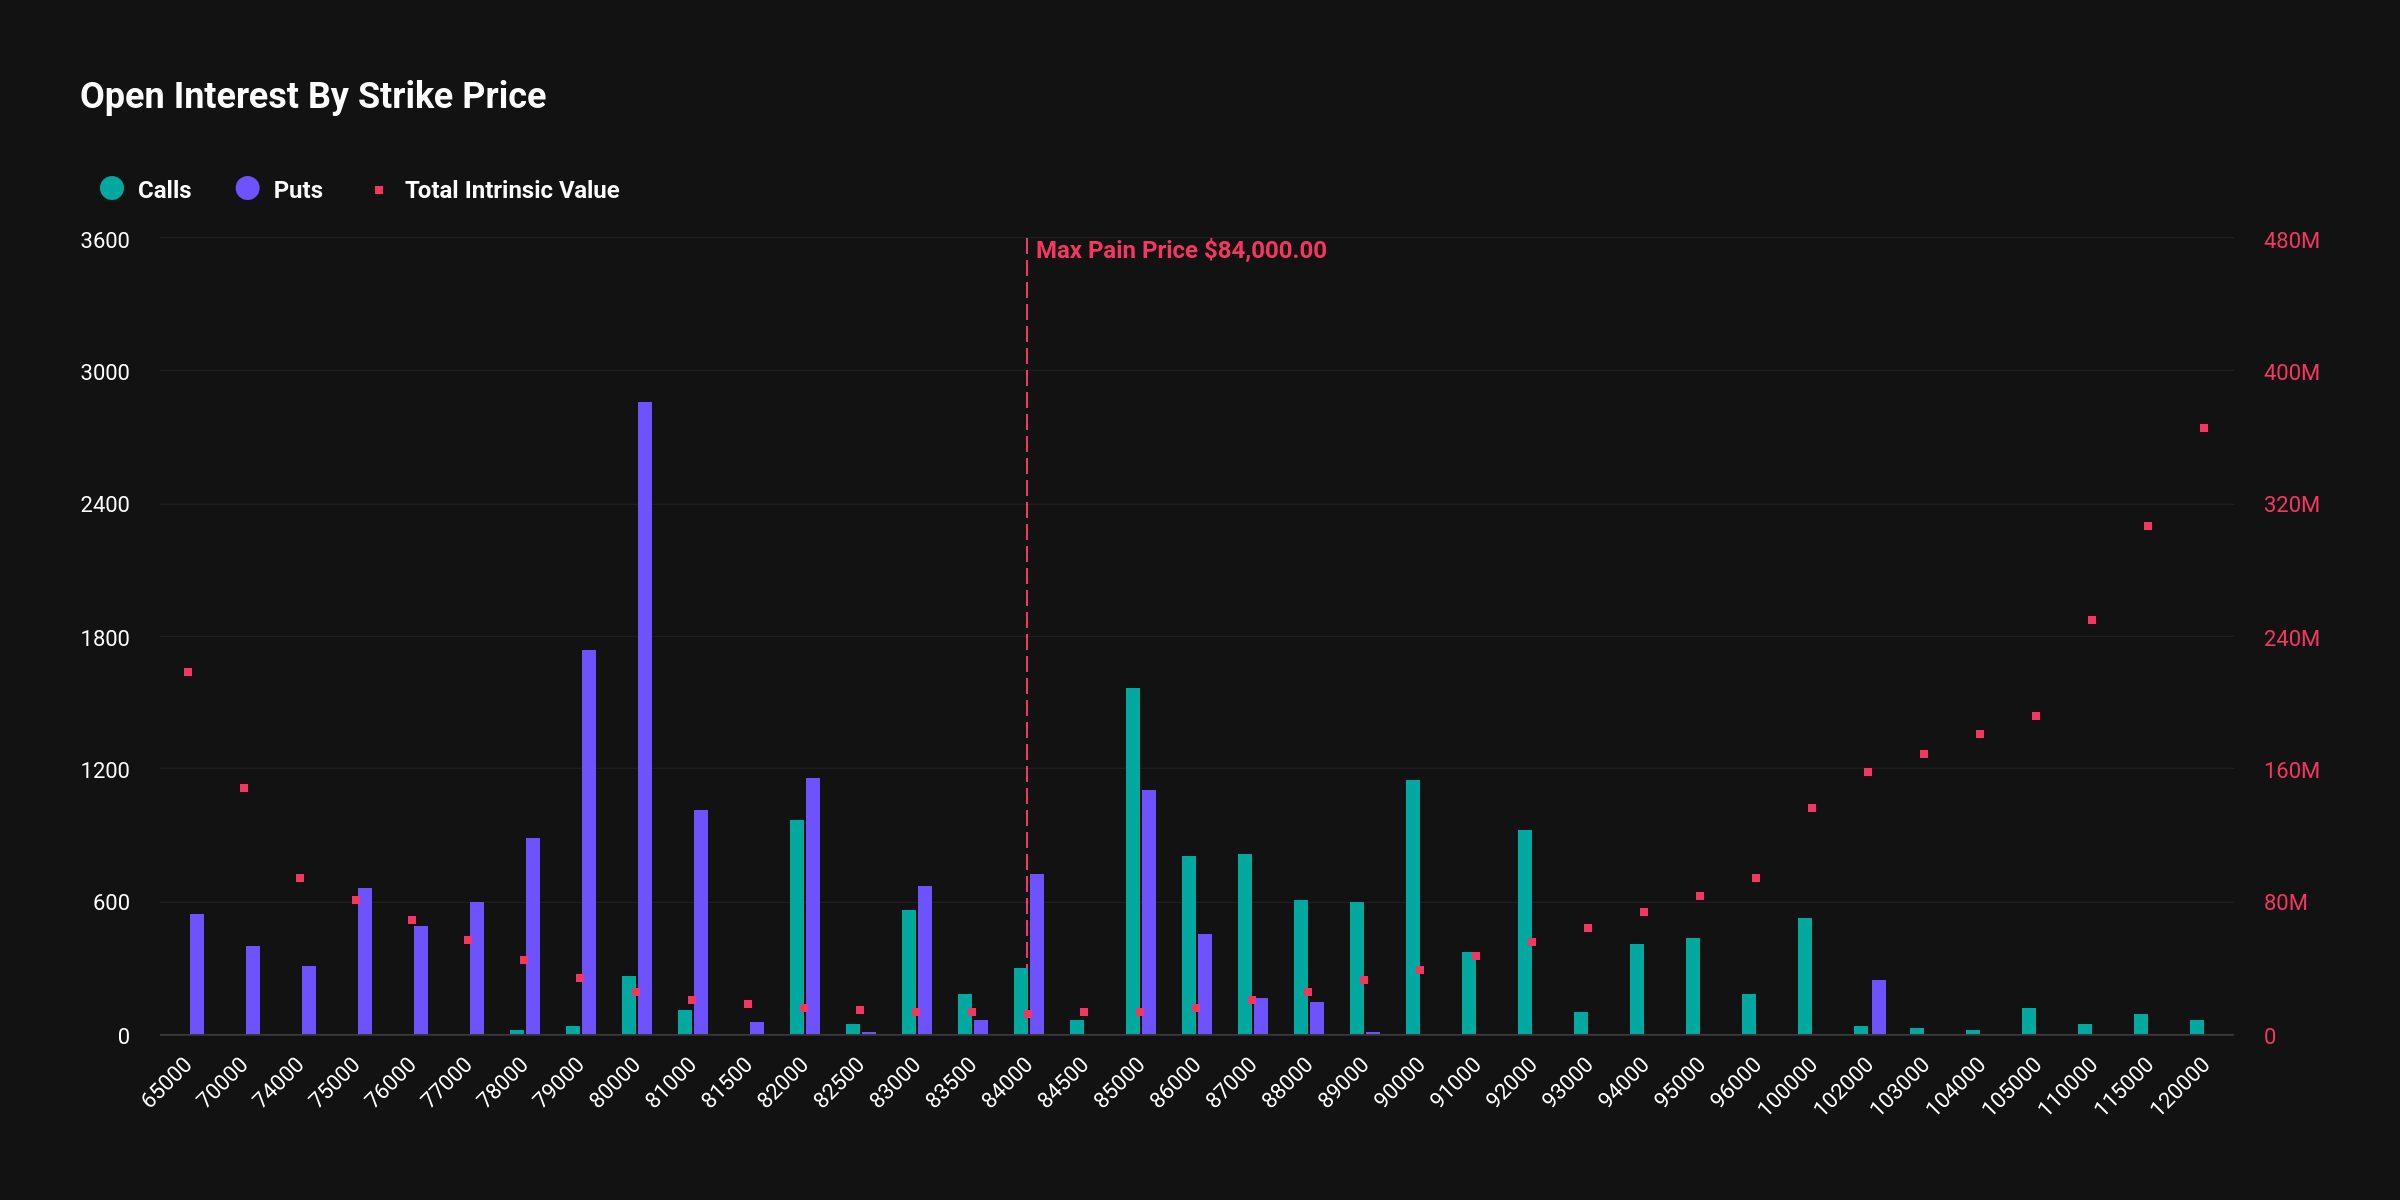
This divide between futures and options traders suggests a tug-of-war between bullish speculation and cautious hedging, potentially leading to heightened volatility in the near term.
Disclaimer
In line with the Trust Project guidelines, this price analysis article is for informational purposes only and should not be considered financial or investment advice. BeInCrypto is committed to accurate, unbiased reporting, but market conditions are subject to change without notice. Always conduct your own research and consult with a professional before making any financial decisions. Please note that our Terms and Conditions, Privacy Policy, and Disclaimers have been updated.

The highly anticipated Pectra upgrade will launch on the Ethereum (ETH) mainnet on May 7, 2025, after overcoming a series of technical challenges and delays in the testnet phase.
Ethereum developers announced the date during the All Core Developers Consensus (ACDC) meeting on April 3, 2025.
Pectra Upgrade Countdown Begins
The upgrade was initially slated for a tentative mainnet launch on April 30. However, Ethereum developers have postponed the launch by one week.
“We’ll go ahead and lock in May 7 for Pectra on mainnet,” Ethereum Foundation researcher Alex Stokes said.
In preparation for this, Stokes confirmed that client releases will be made available by April 21, ensuring that all users have the necessary updates and tools ahead of the mainnet launch. On April 23, a detailed blog post outlining the Pectra mainnet will be published.
The Pectra upgrade will introduce 11 Ethereum Improvement Proposals (EIPs) to enhance various aspects of the network. Notably, three EIPs are dedicated to improving the validator experience.
The first is EIP-7251. This will increase the staking limit for validators from 32 ETH to 2,048 ETH per validator. This change aims to enhance capital efficiency for large stakers and staking pools.
“This simplifies the staking experience, allowing users to manage multiple validators under one node instead of several,” an analyst remarked.
Moreover, EIP-7002 introduces execution-layer triggerable withdrawals, giving validators more control. Meanwhile, EIP-6110 reduces the deposit processing delay from about 9 hours to just 13 minutes.
The upgrade will also include EIP-7702, a major step toward account abstraction. It allows Externally Owned Accounts (EOAs) to gain smart contract functionality while maintaining simplicity. This enables features like transaction batching, gas sponsorship (where third parties pay fees), passkey-based authentication, spending controls, and asset recovery mechanisms.
Finally, the upgrade increases blob capacity through EIP-7691. In addition, EIP-7623 helps manage the increased bandwidth requirements. These updates aim to make Ethereum more scalable, efficient, and user-friendly.
It is worth noting that the road to the mainnet launch has not been without hurdles. Two previous tests on the Holesky and Sepolia test networks failed to finalize properly. However, Pectra achieved full finalization on the Hoodi testnet on March 26, marking a significant milestone toward the successful deployment of the upgrade.
Despite the technical progress, ETH continues to face market challenges.

Data from BeInCrypto shows that ETH dropped 4.8% over the past week, with weekly losses extending to 17.1%. At the time of writing, the altcoin was trading at $1,822, reflecting a small daily gain of 0.8%.
Disclaimer
In adherence to the Trust Project guidelines, BeInCrypto is committed to unbiased, transparent reporting. This news article aims to provide accurate, timely information. However, readers are advised to verify facts independently and consult with a professional before making any decisions based on this content. Please note that our Terms and Conditions, Privacy Policy, and Disclaimers have been updated.

Fresh $36M Bitcoin Transfer By Bhutan Sparks Speculation—Dump Alert?

Standard Chartered Calls for Bitcoin Push Above $88,500

BTC Holds $84K, ATOM & FIL Become Top Gainers

BTC Futures Show Bullish Sentiment, Options Traders Cautious
Pi Coin Price Crashes 15%, Is Coinbase Listing Only Hope?

What to Expect on May 7


-

 Market22 hours ago
Bitcoin’s Future After Trump Tariffs
-
 Regulation21 hours ago
US Senate Banking Committee Approves Paul Atkins Nomination For SEC Chair Role
-

 Market19 hours ago
Binance Managed 94% of All Crypto Airdrops and Staking Rewards
-

 Market23 hours ago
EDGE Goes Live, RSR Added to Roadmap
-

 Market21 hours ago
TRUMP Token Hits Record Low Due To Liberation Day Tariffs
-

 Market20 hours ago
Pi Network Price Falls To Record New Low Amid Weak Inflows
-
 Regulation18 hours ago
US SEC Acknowledges Fidelity’s Filing for Solana ETF
-

 Market18 hours ago
XRP Battle Between Bulls And Bears Hinges On $1.97 – What To Expect
 Arabic
 Chinese (Simplified)
 Dutch
Dutch English
 French
 German
 Italian
 Portuguese
 Russian
 Spanish
 Vietnamese