
Ethereum
Weekly price analysis: prices decline on risk-off sentiments


- The crypto market trended lower last week, driven largely by risk-off sentiments on newly released Fed meeting notes and economic data
- The Fed expressed caution around inflation, especially as President-elect Donald Trump’s policies will kick in after his inauguration on January 20
- Meanwhile, spot crypto exchange-traded funds (ETFs) logged outflows from Wednesday, January 8
Bitcoin
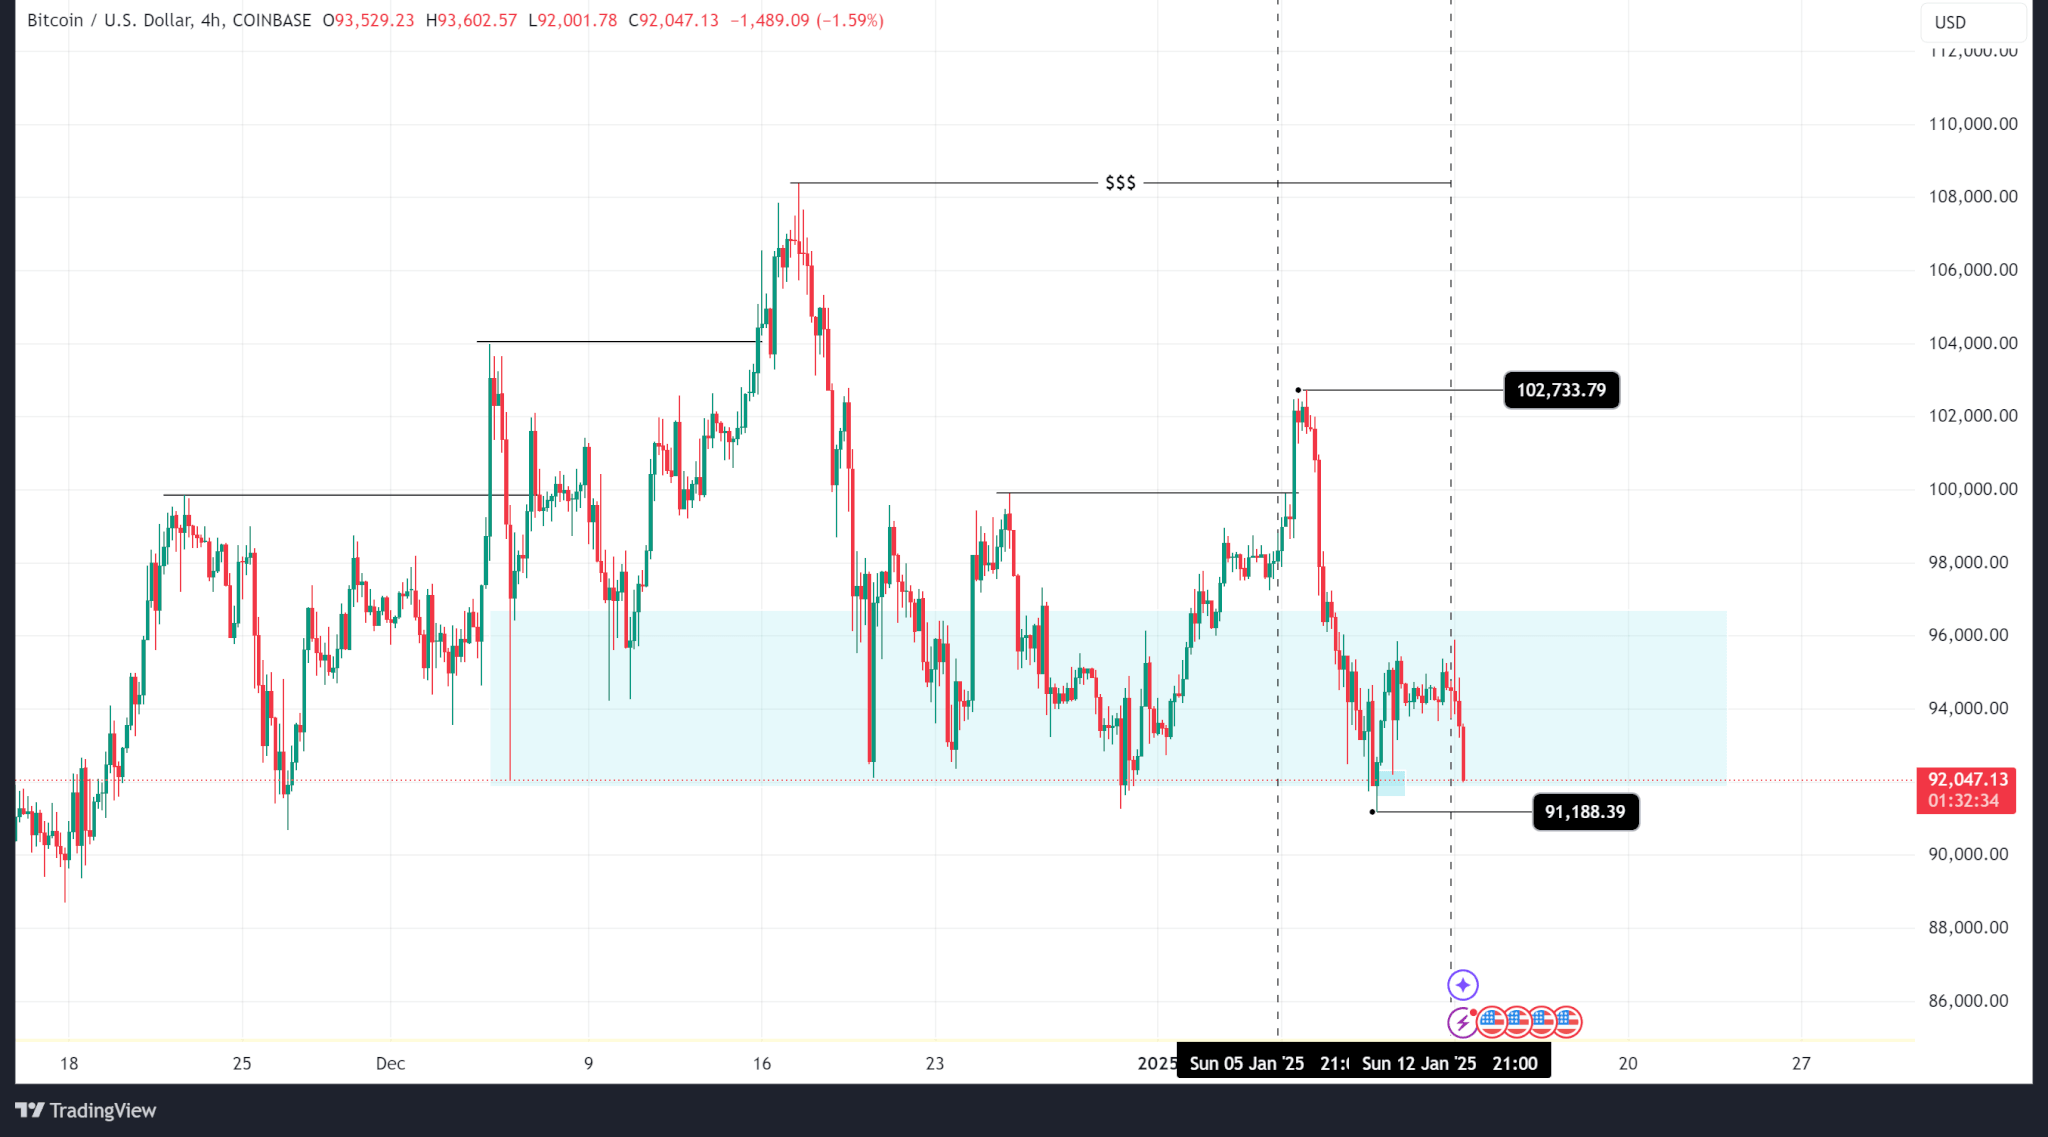
Bitcoin’s price logged a negative week falling from a high of $102,733 to a low of $91,188 before eventually closing at $94,547.
Technical analysis shows a break above the last lower high and a push back down into the H4 demand zone, which means that although the price took a bearish turn, it is still in overall bullish territory.
Much of this bearish sentiment is driven by bleak economic expectations. The US Federal Reserve meeting minutes, released on January 8, showed that the reserve bank is cautious about inflation it expects will follow President-elect Donald Trump’s policies.
As such, the likelihood of continued rate cuts has dwindled, with some analysts seeing an end to cuts early this year. The market’s reaction reflects this updated risk-off sentiment.
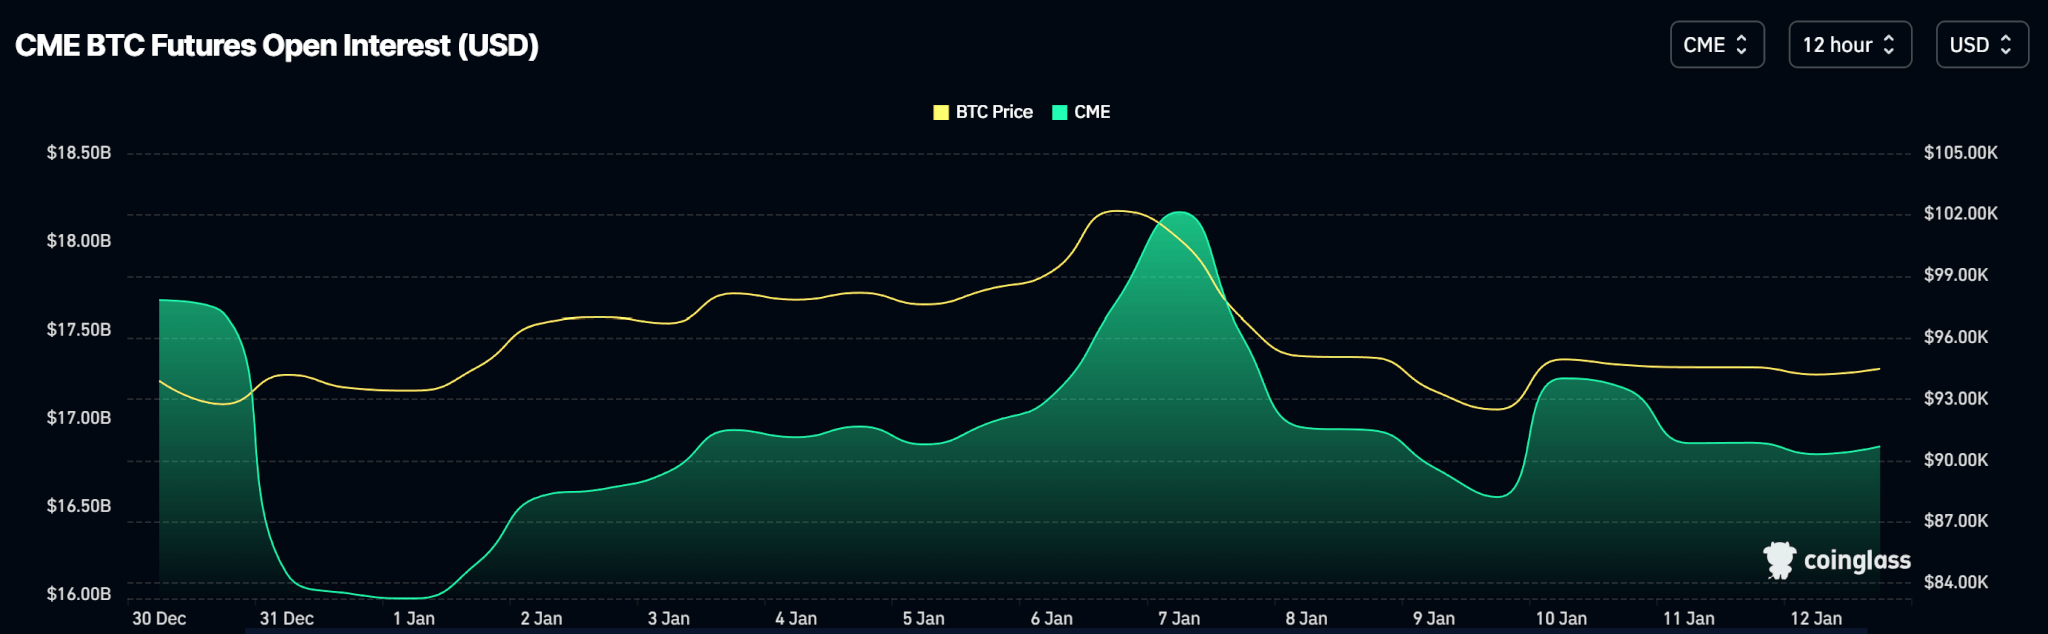
Bitcoin’s open interest chart shows a decline in open contracts between Wednesday and now. Open interest hit a weekly high on Tuesday at $18.16 billion on the CME, fell to a low on Thursday ($16.55 billion), and mellowed out the rest of the week.
Meanwhile, spot Bitcoin ETFs logged outflows after the release of the Fed’s meeting minutes on Wednesday. Outflows totalled $718.20 million while inflows totalled $1.03 billion.
Outlook
Bitcoin’s price currently hovers around the bottom of the demand zone. If it breaks below, its price could be pushed down to $85,100 where a fair value gap could act as support.
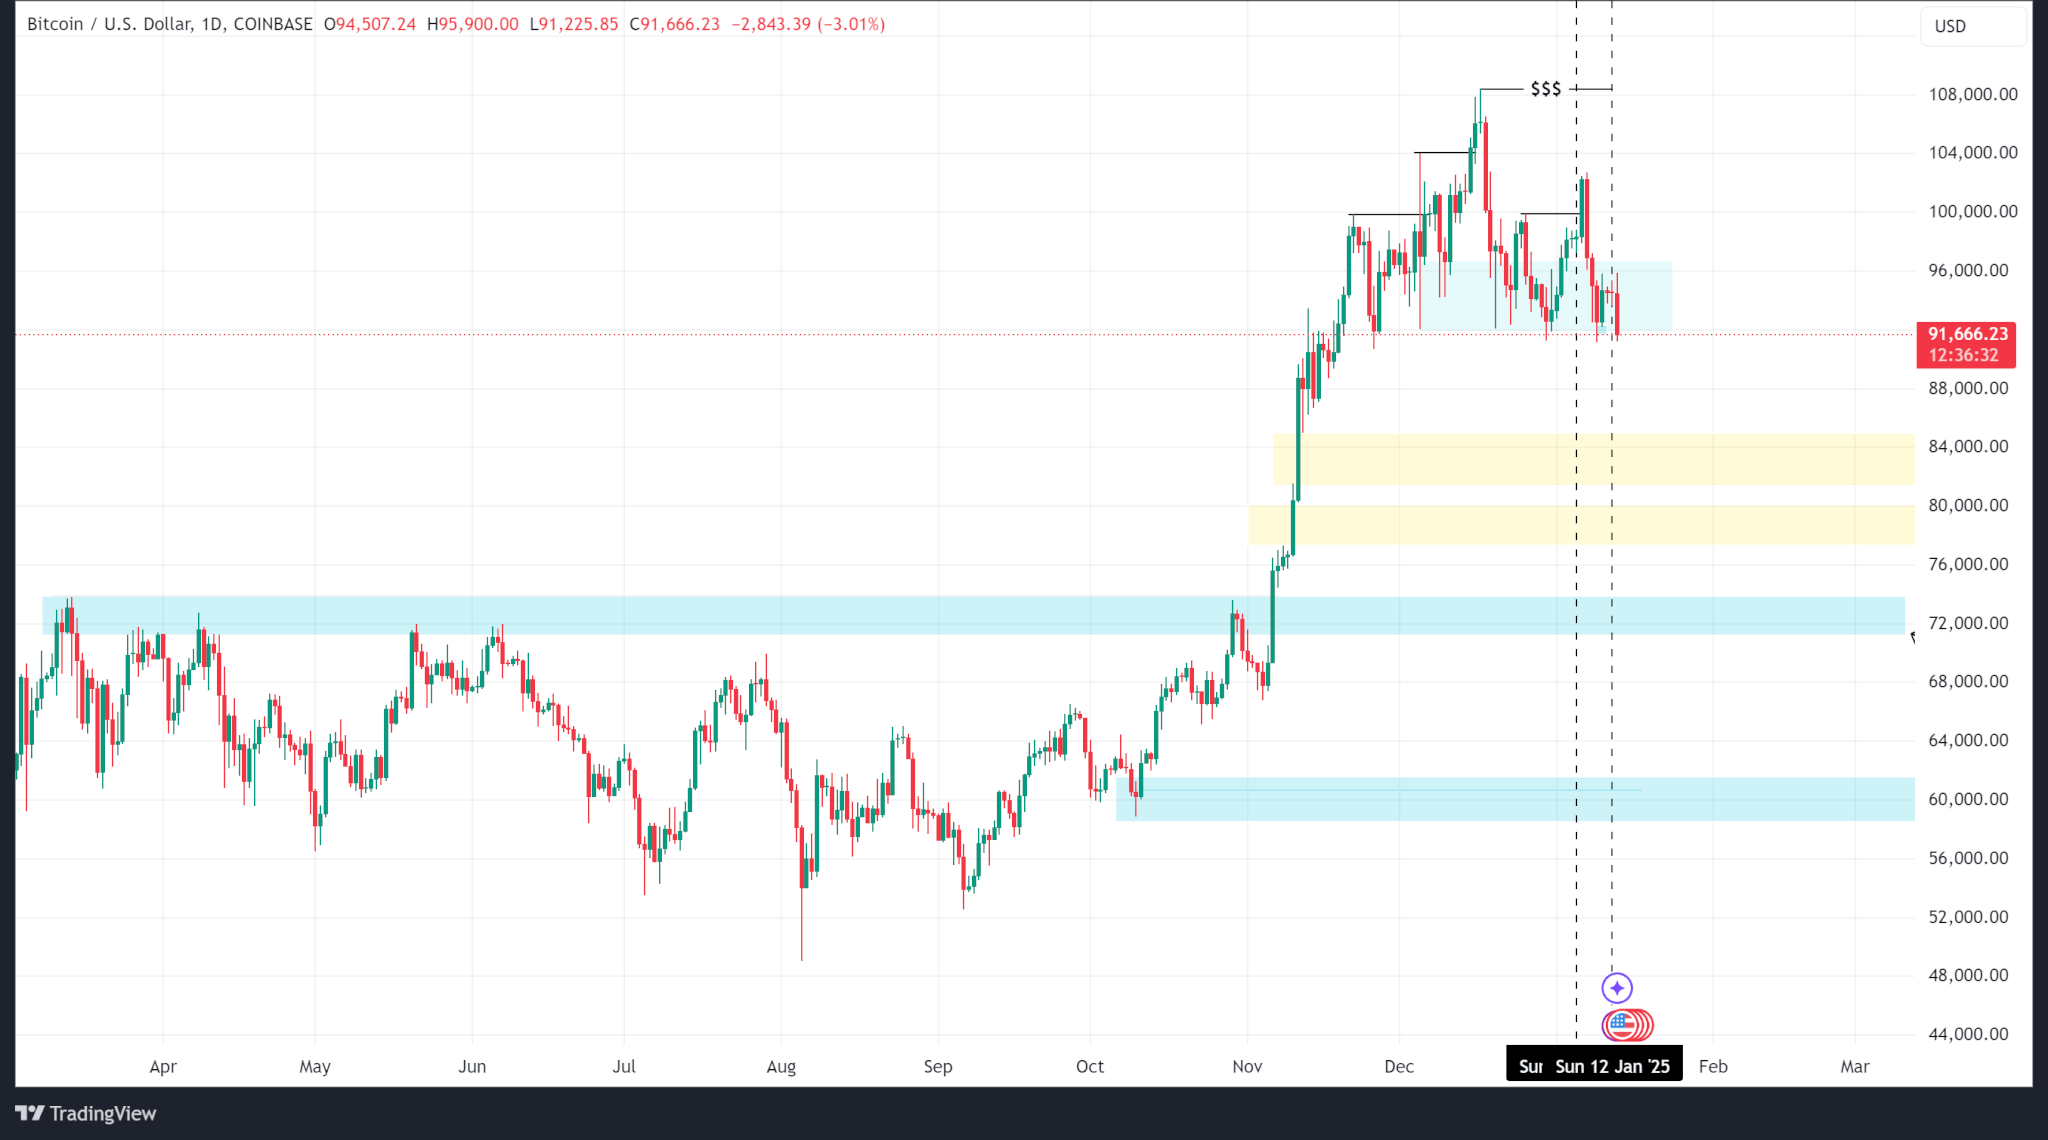
BTC trades at $91,622 as of publishing.
Ethereum
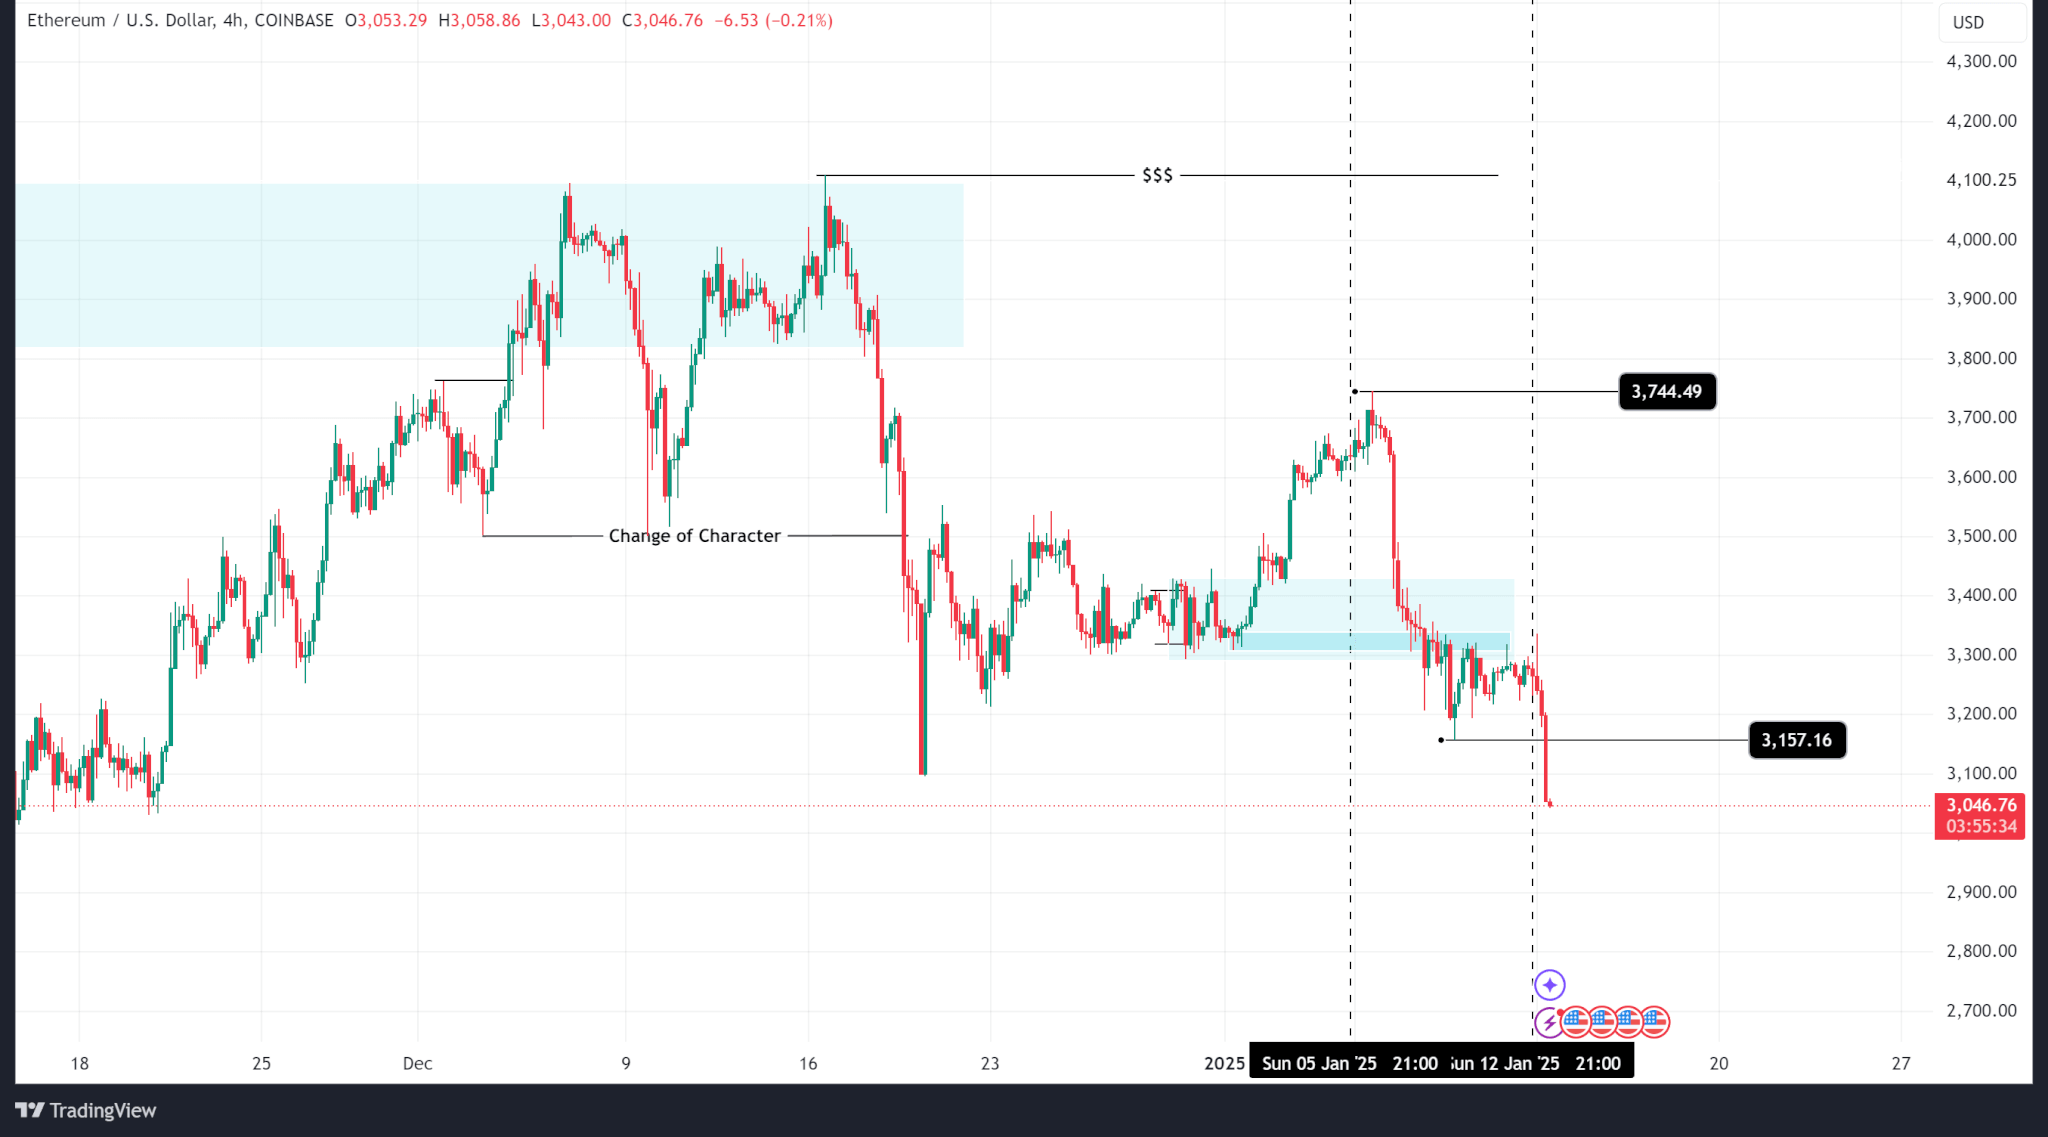
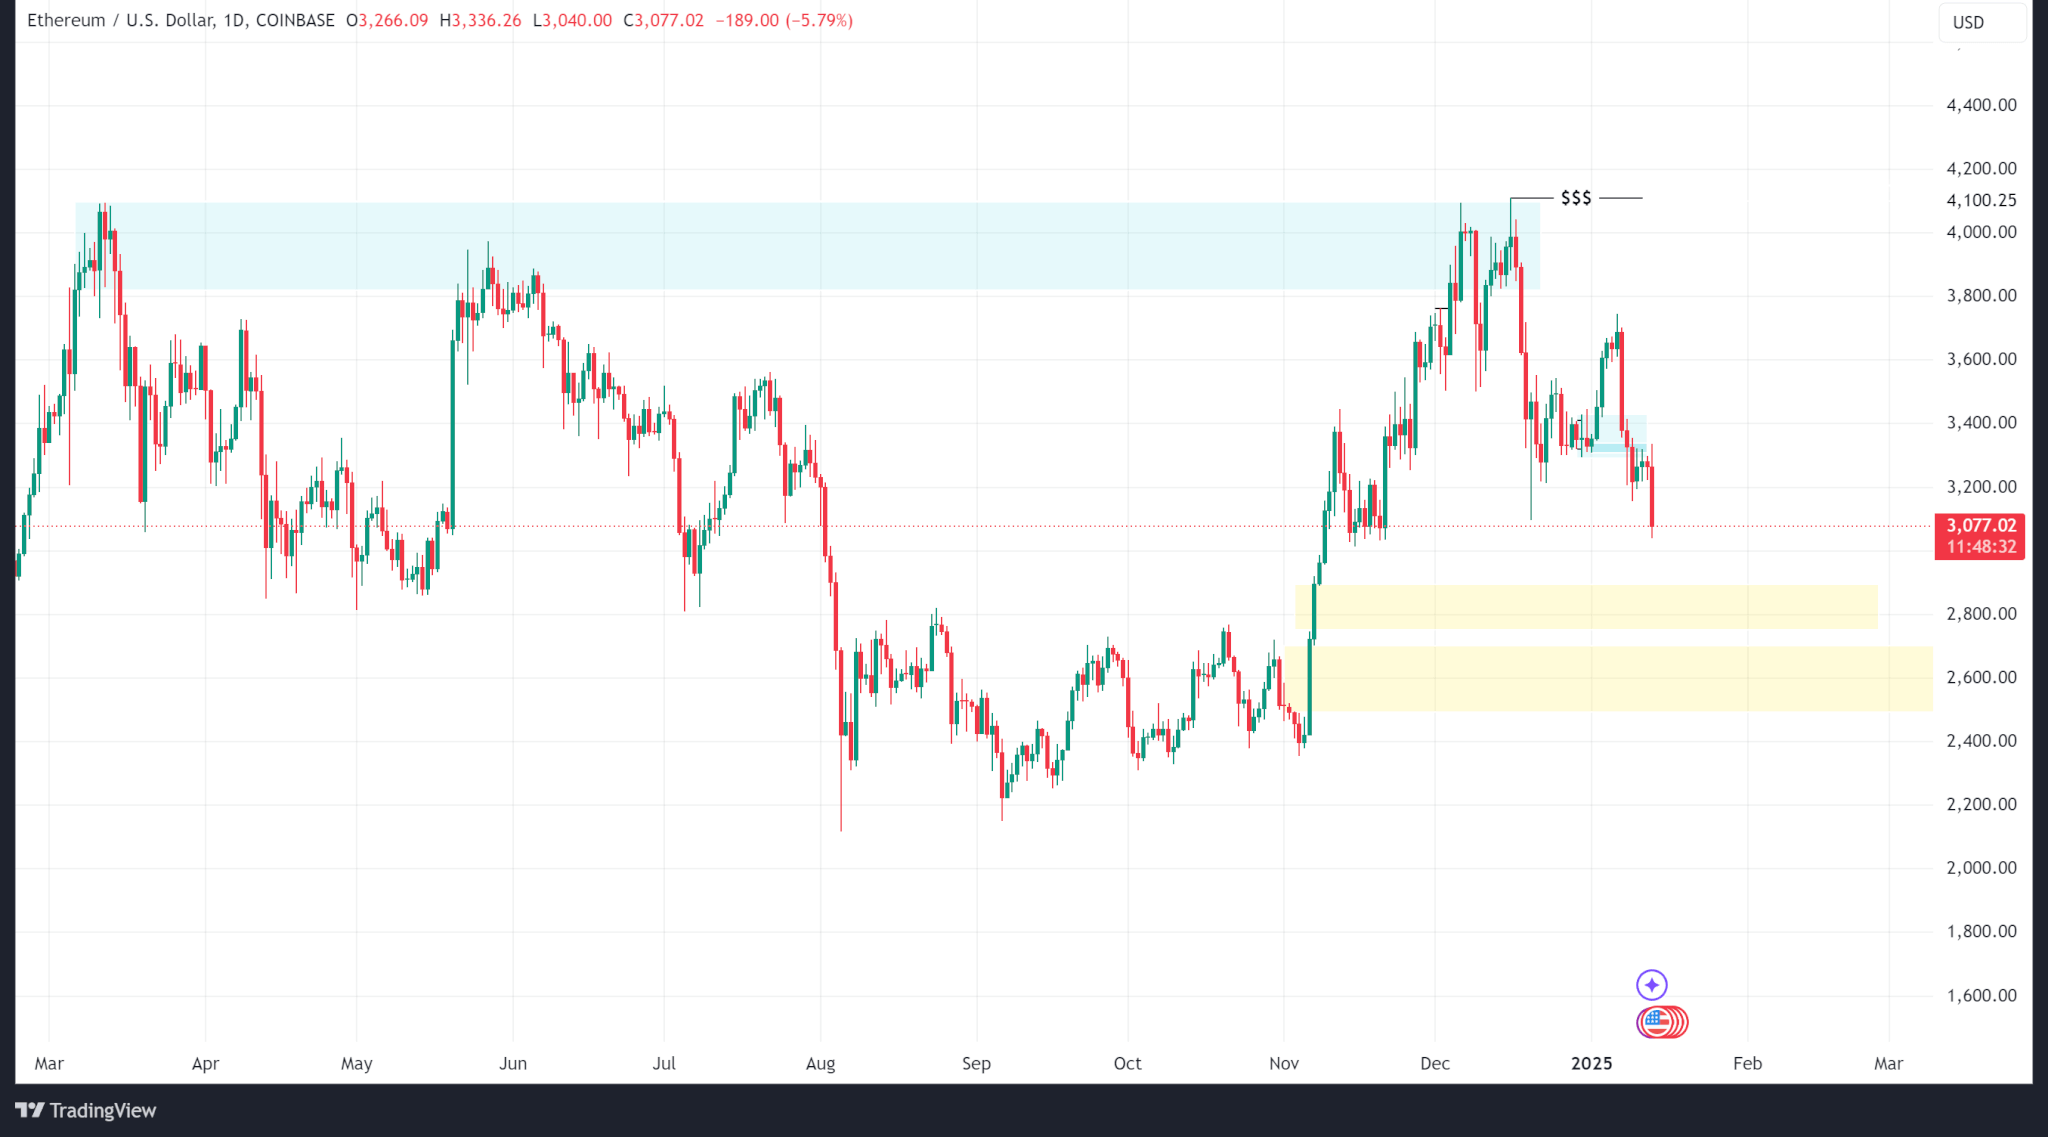
Ethereum’s price also logged a negative week, falling from a high of $3,744 to a low of $3,157 before closing at $3,236. ETH price action tested March 2024’s high of $4,089 in early December 2024, but failed to break above and has been logging lower lows since.
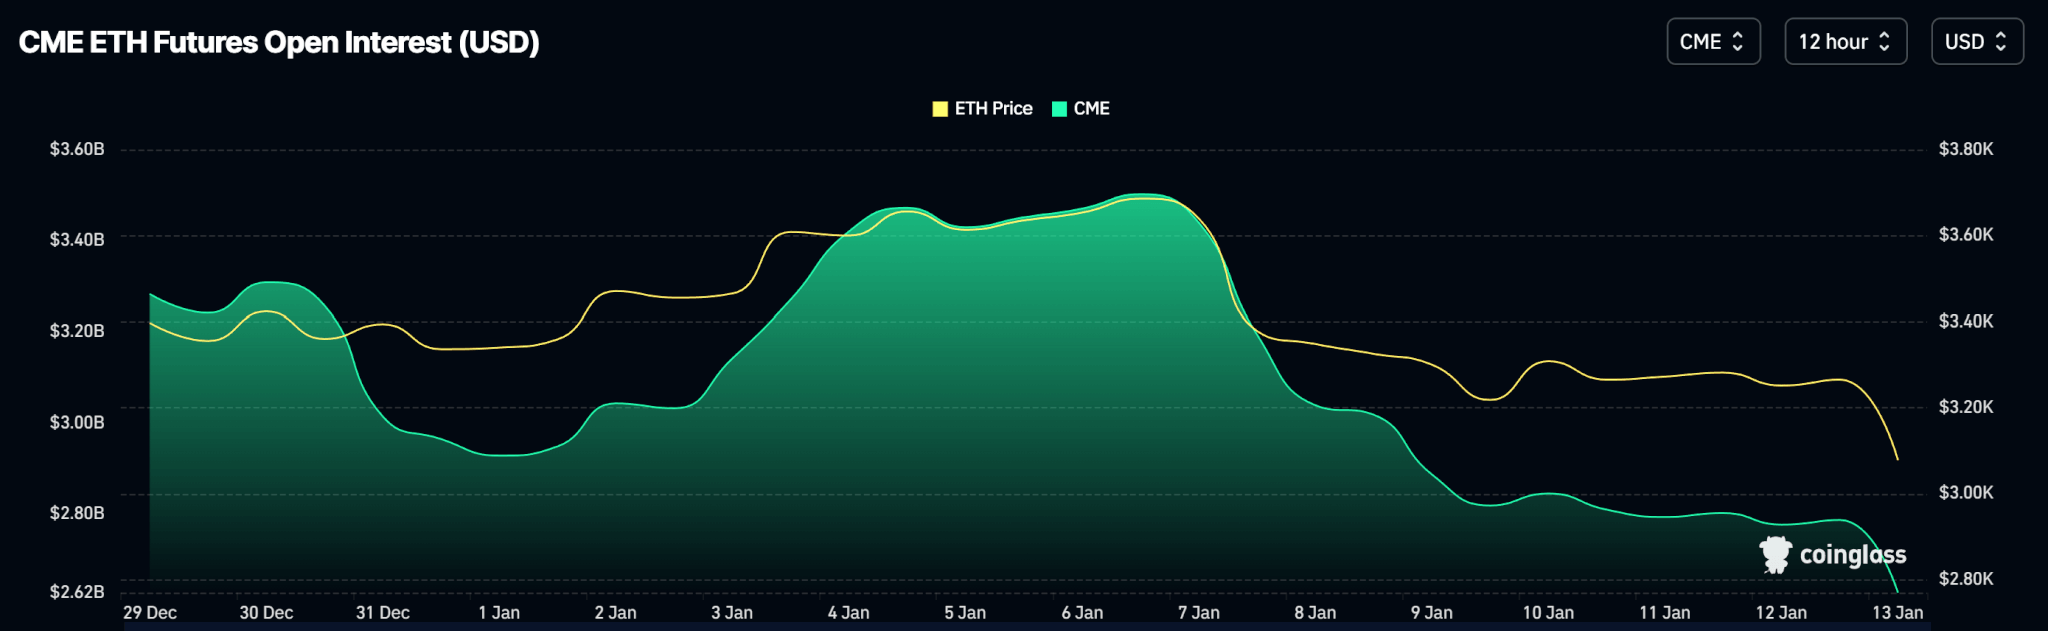
Open interest dropped from a January 7 high of $3.50 billion and continued to decline until it was $2.63 billion as of this publication.
Meanwhile, Ethereum spot ETFs logged a weekly net outflow of $186.00 million following risk-off sentiments in the market.
Outlook
As Ethereum’s price continues to trend lower, the next technical level that could provide support is the fair value gap at the $2,893 price level.
ETH trades at $3,071 as of publishing.
Solana
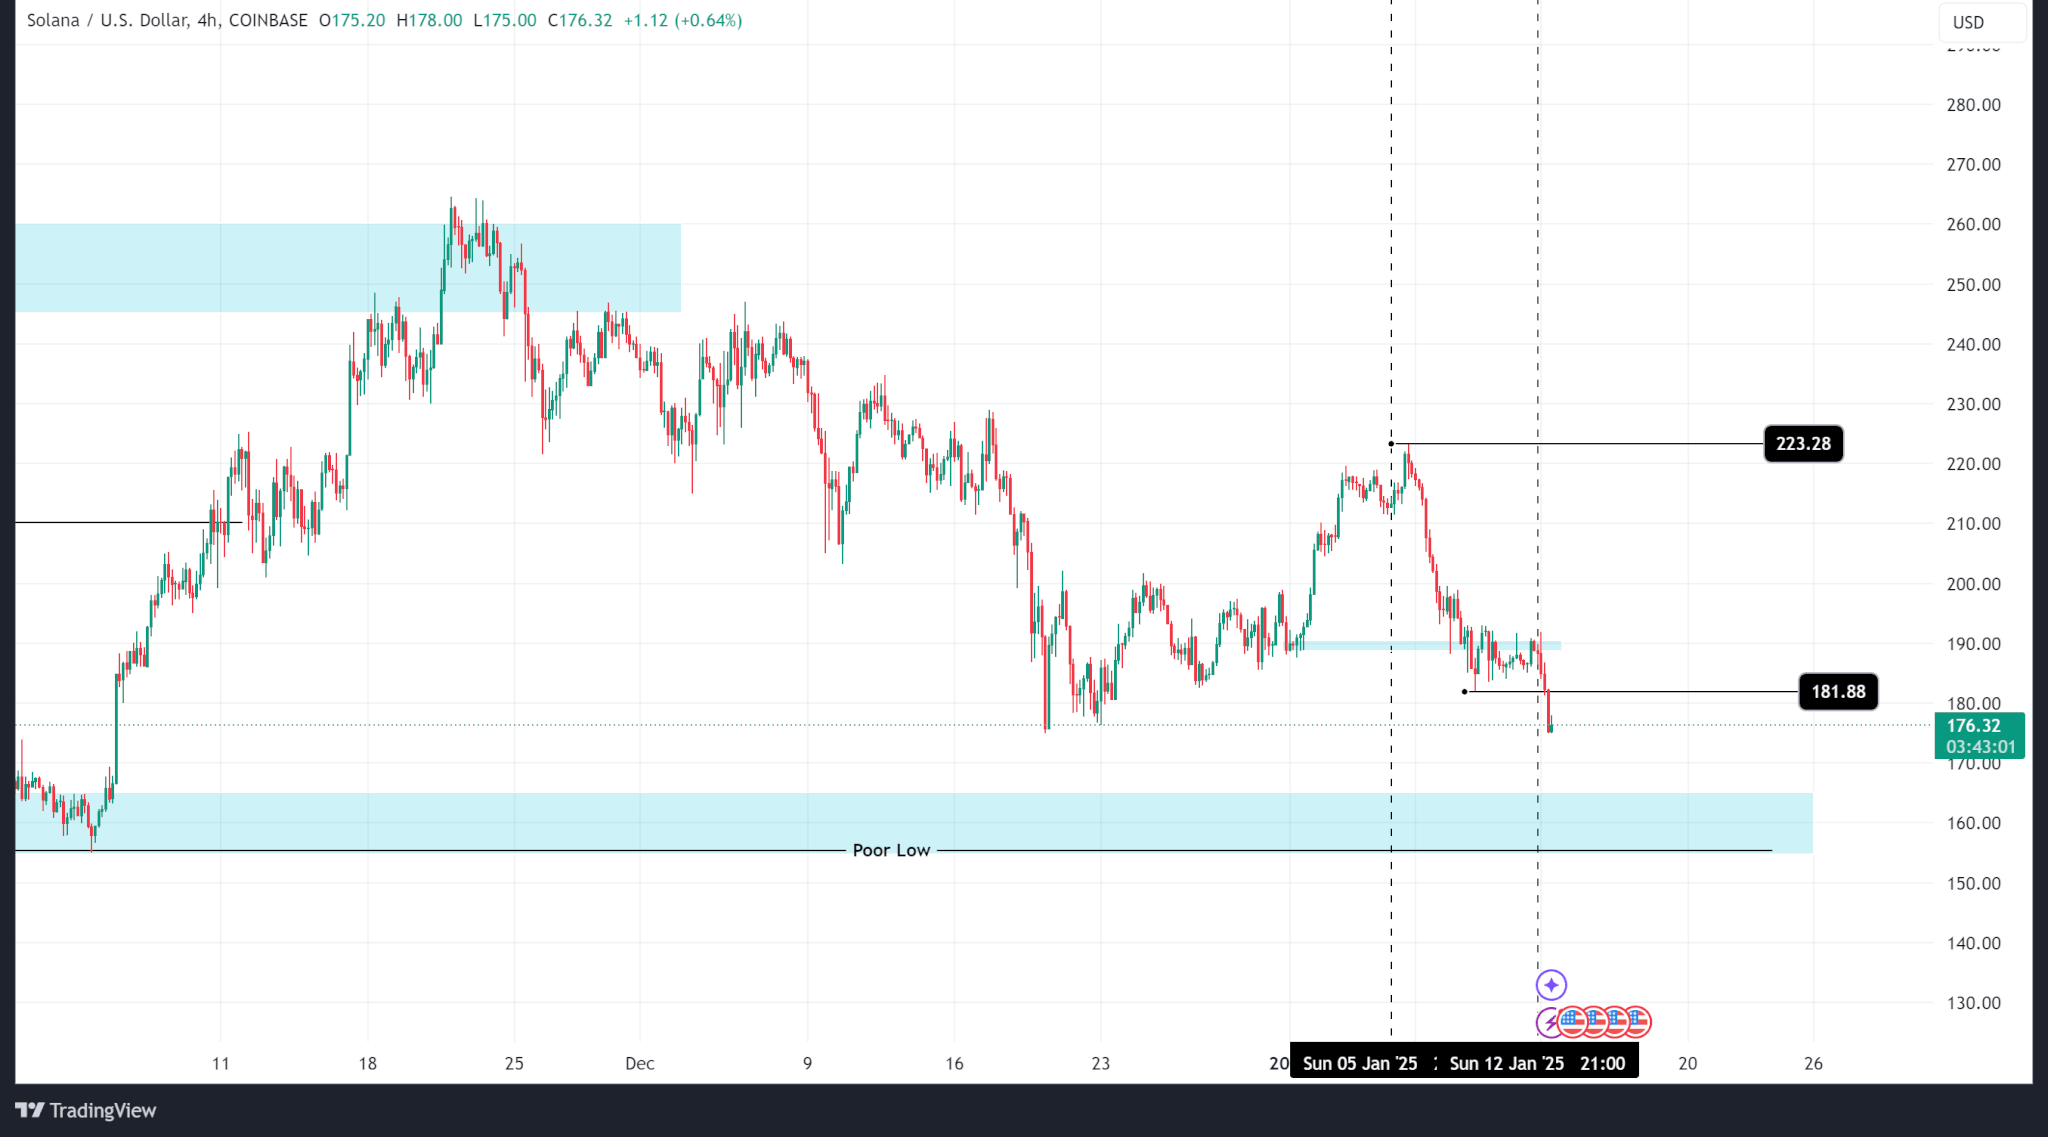
Solana’s price fell from a weekly high of $223 to a weekly low of $181 before eventually closing at $188, logging a total loss of 12.53%. SOL continues to trend lower after failing to close above its all-time high of $260.
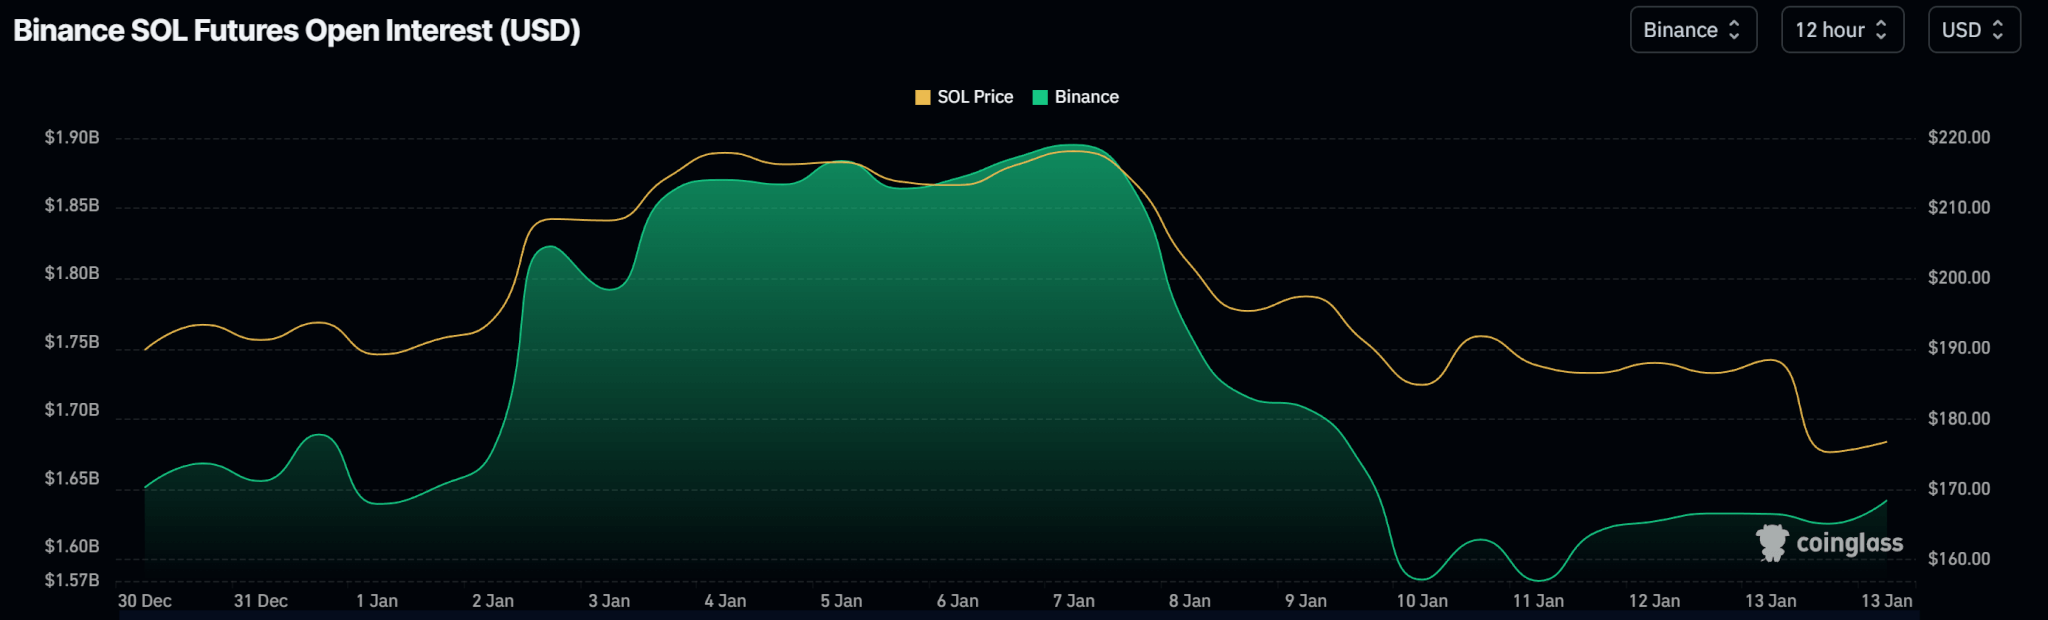
Open interest data shows a steep fall from $1.89 billion on Binance on January 7 to $1.58 billion on January 10. As of this publication, OI levels have improved to $1.63 billion.
Outlook
The next technical support zone is at the $164 price level. However, although the order block is a support, it is a poor low that could be taken out even if price reverses from that zone.
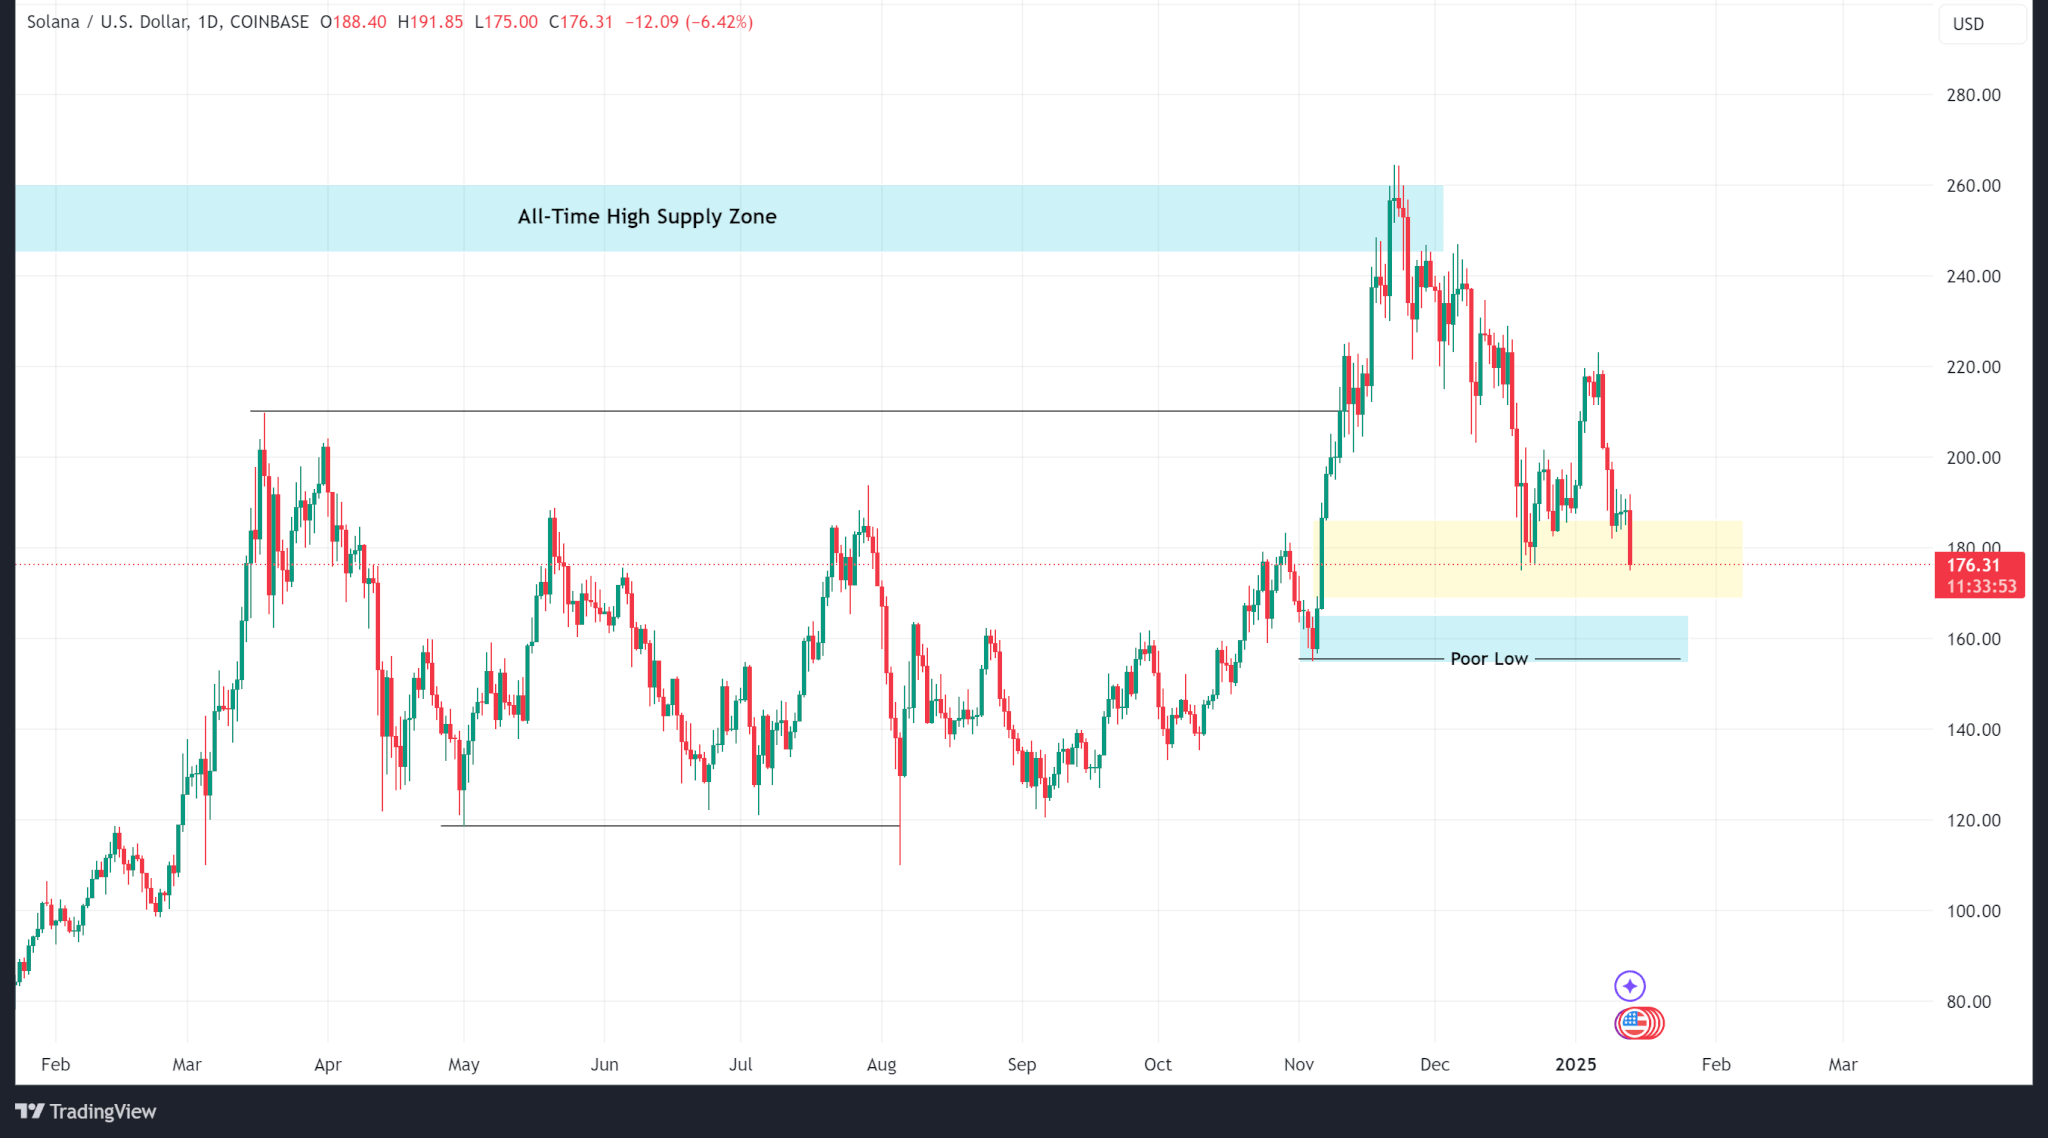
SOL trades at $176 as of publishing.
Ripple
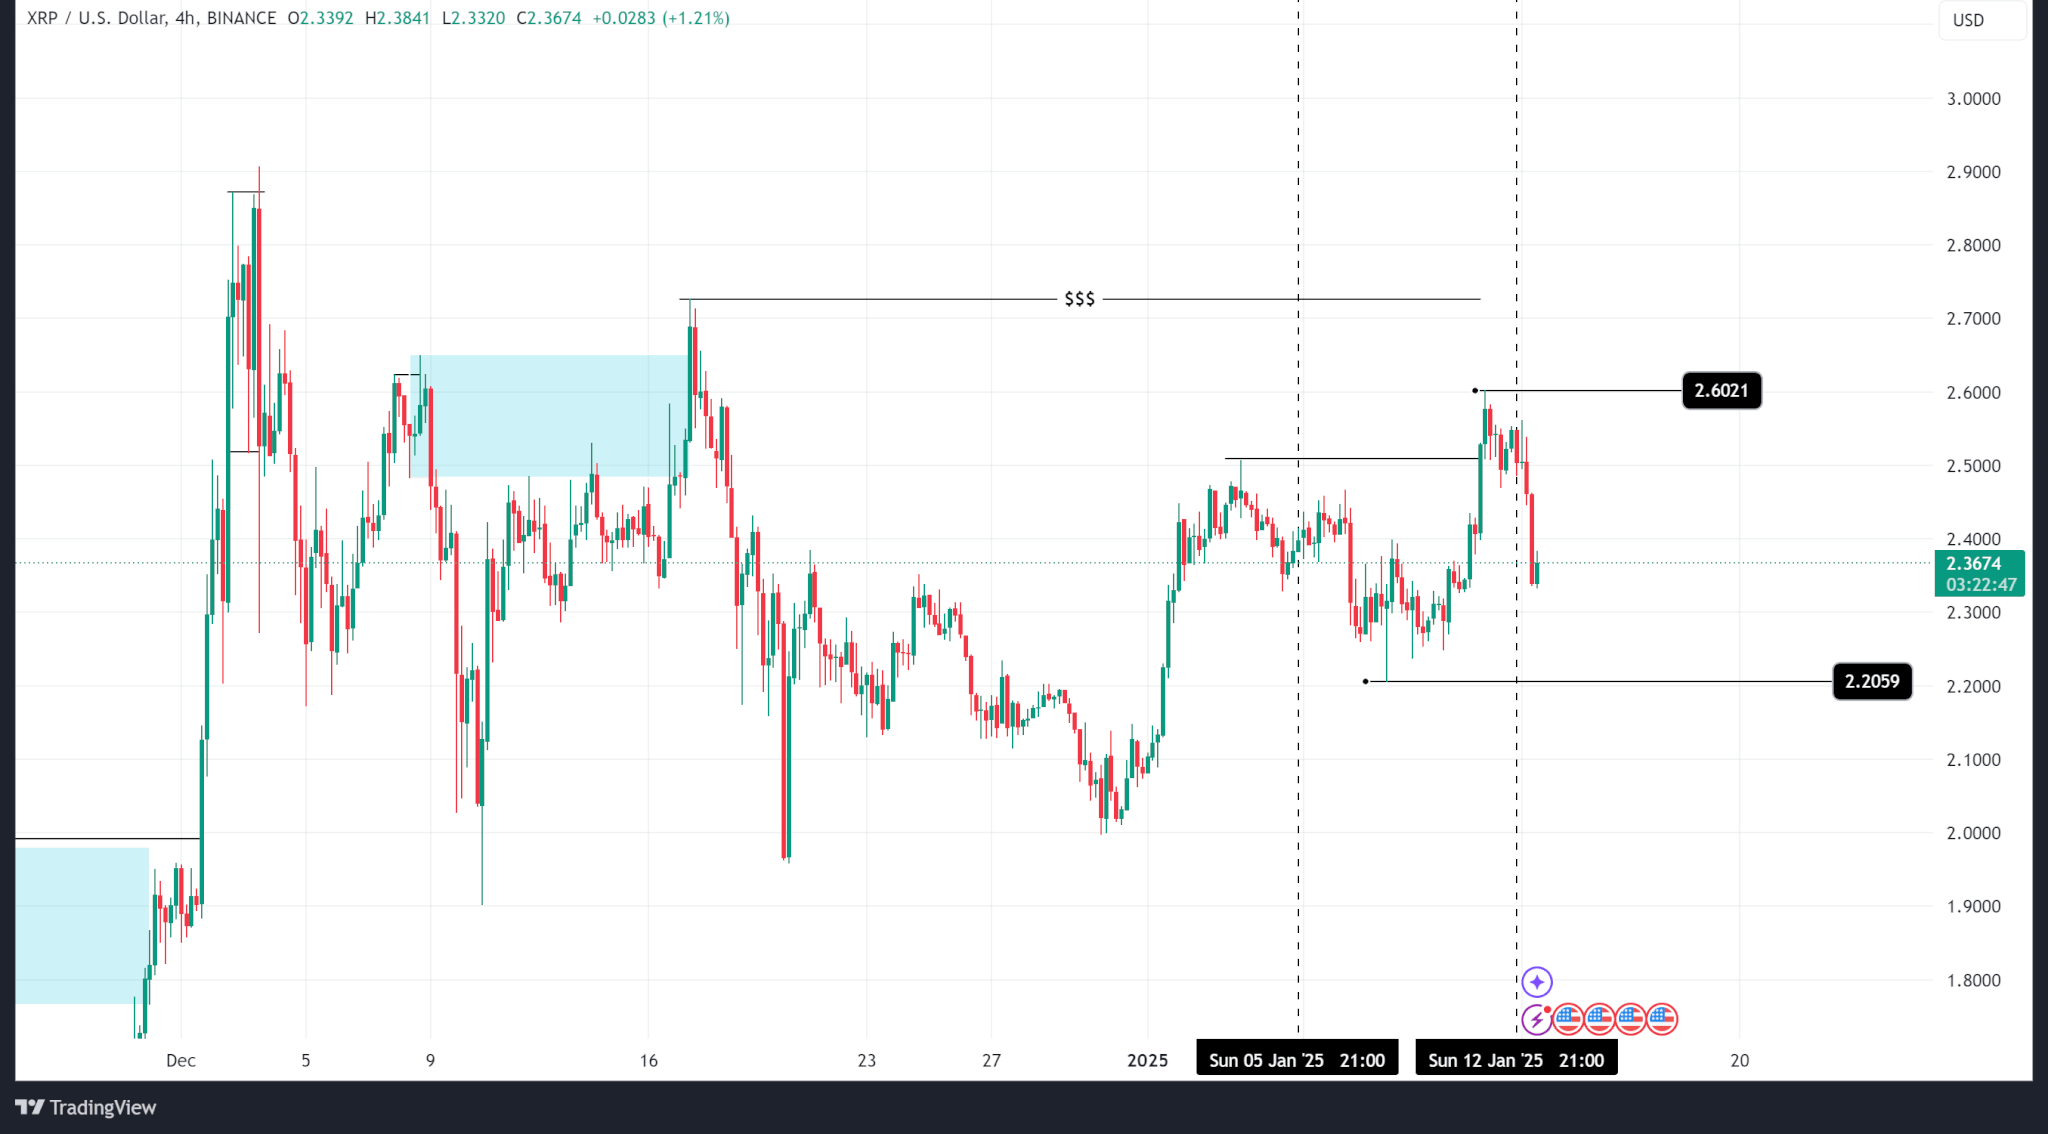
Ripple’s price fared better last week, closing higher at $2.55 from $2.38 at the start of the week as its price continued to log higher highs. Zooming out, the price continues to range between $1.90 and $2.90 as the market cools.
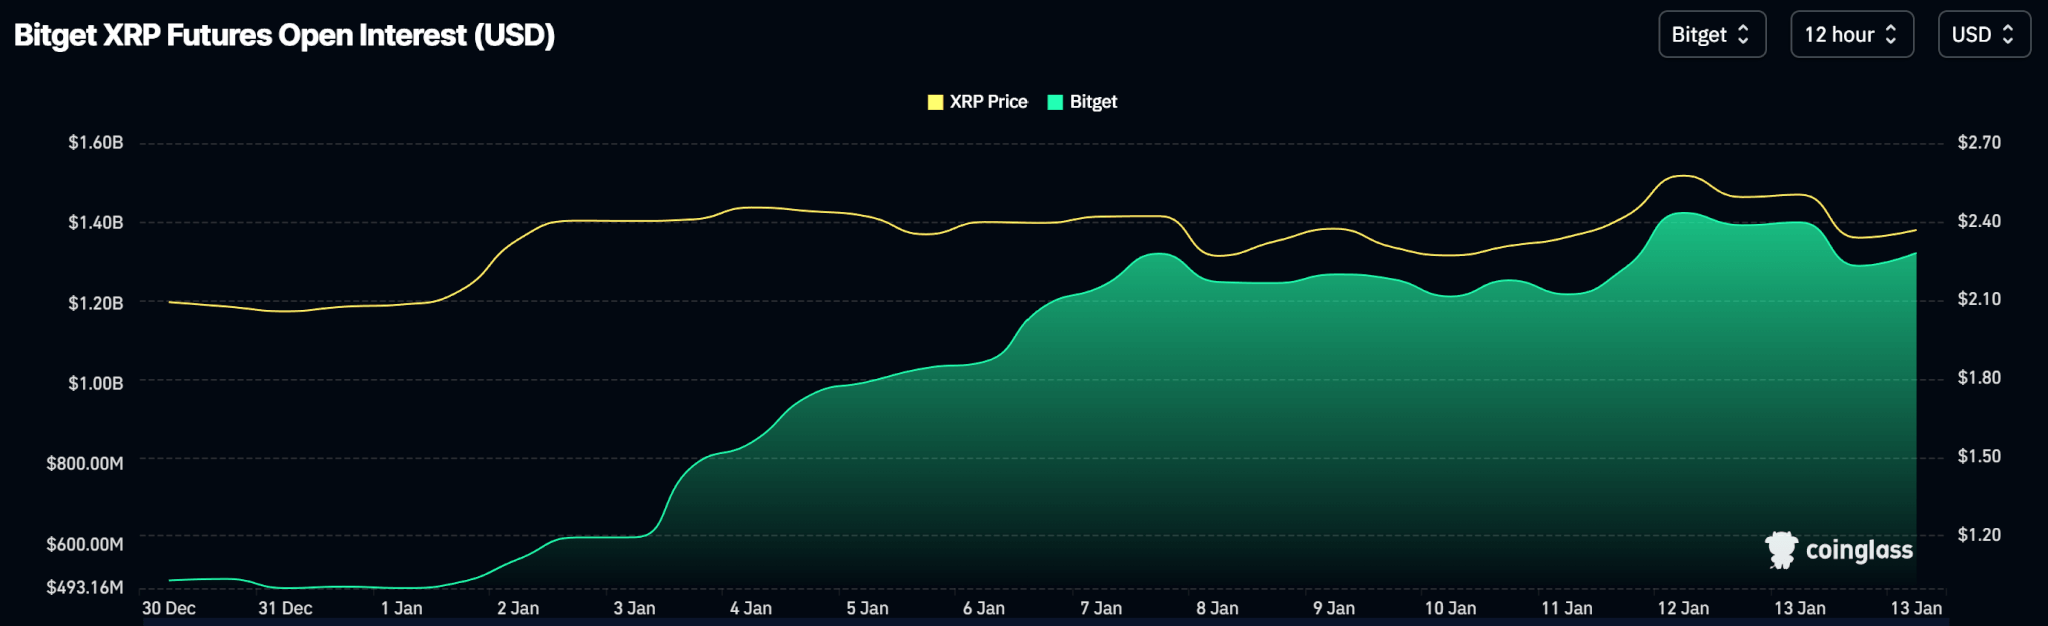
Open interest rose on Bitget, the exchange with the highest XRP derivative trading volume, over the last week, supporting upward price movement as positive news around Ripple’s case with the SEC boosted sentiments.
Outlook
Ripple’s price is buoyed by news around the SEC’s lawsuit against its parent company, a case which could be thrown out with the outgoing administration.
However, technical analysis shows that XRP trades at a premium and a pullback is expected. The most likely levels are the fair value gap at $1.75 and the order block at $1.46.
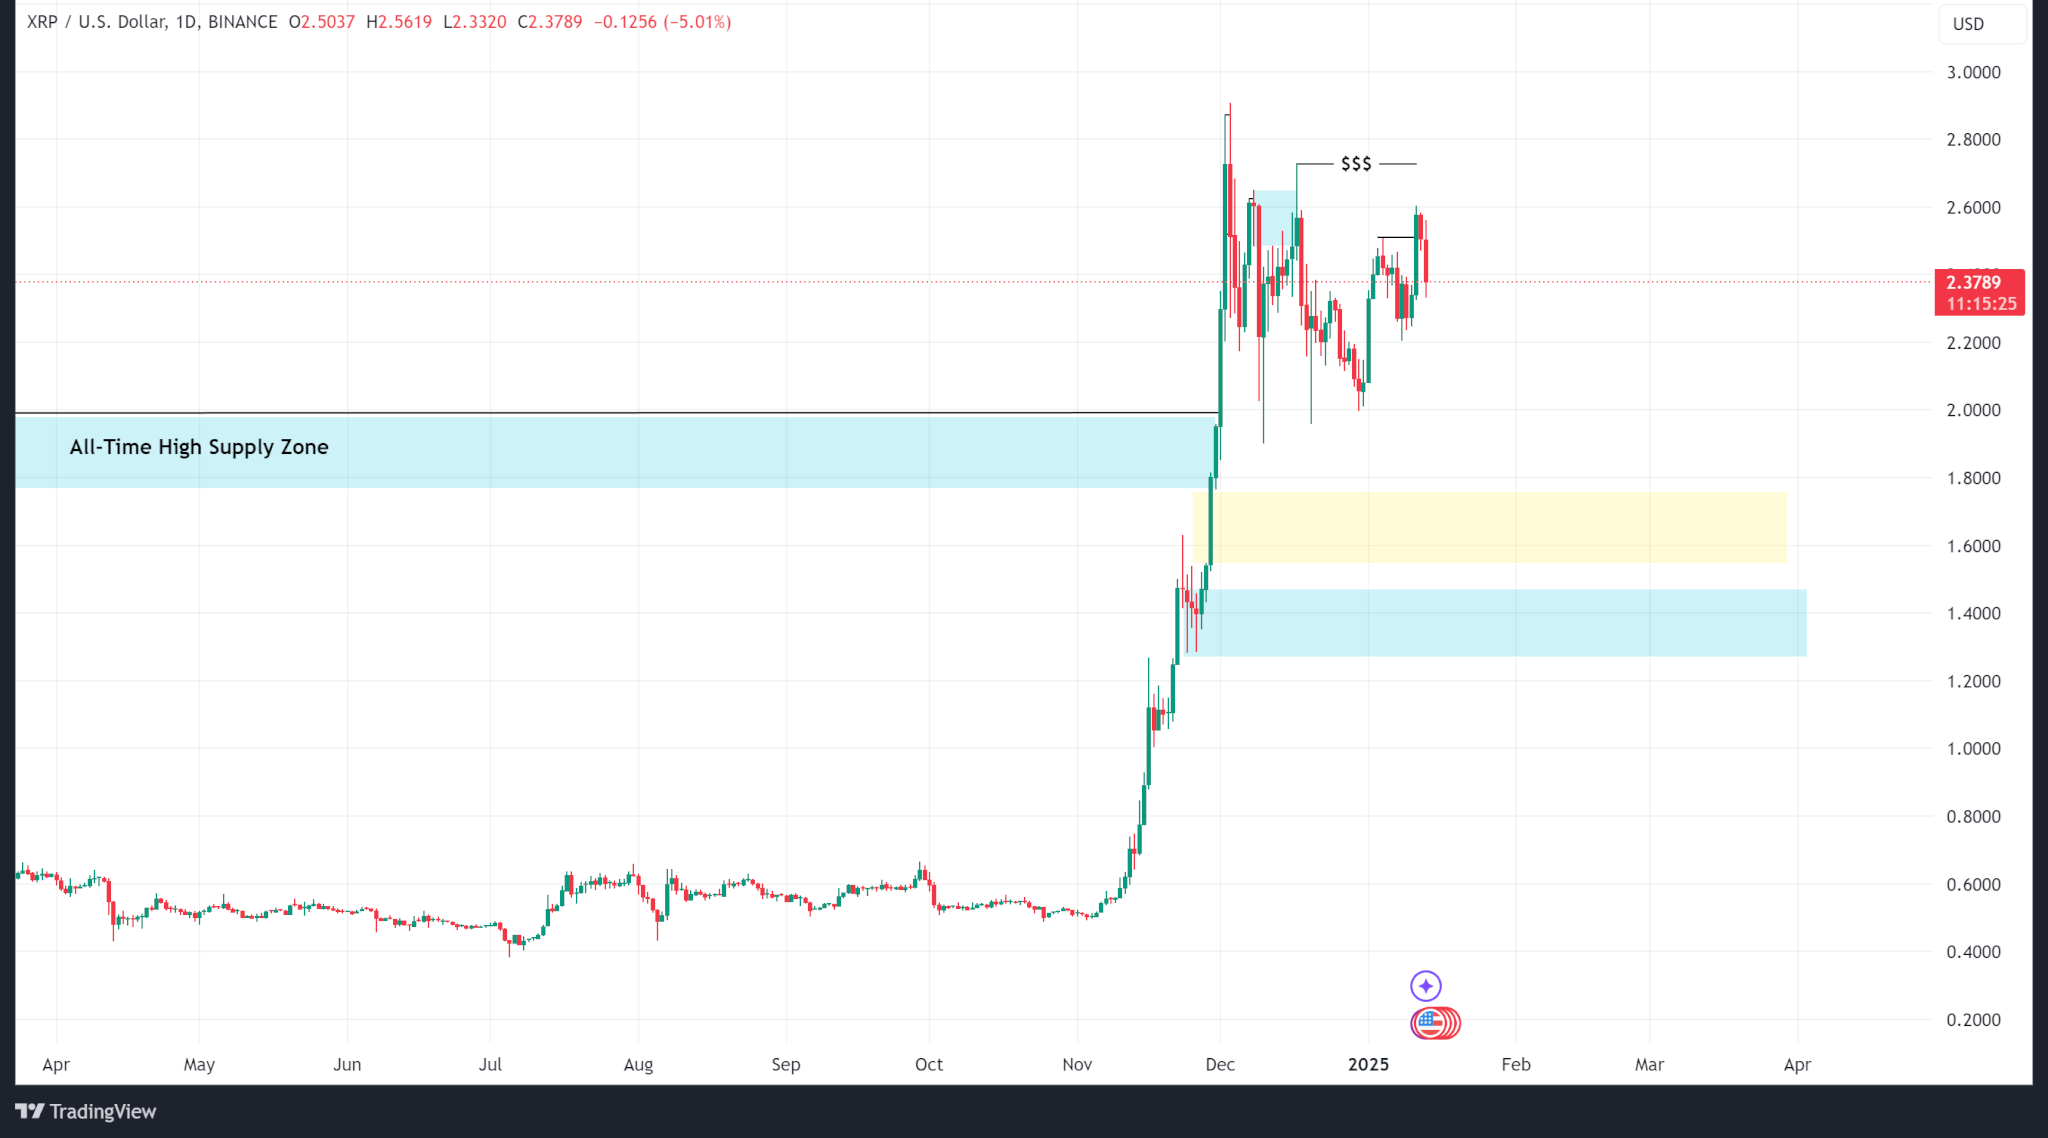
XRP trades at $2.37 as of publishing.


The Ethereum Foundation is realigning its developmental strategy to address core protocol efficiency and user experience challenges, following recent leadership changes earlier this year.
Co-executive director Tomasz Stańczak outlined the updated focus areas in a public statement on X earlier today, emphasizing that the shift is intended to strengthen Ethereum’s long-term scalability while improving near-term usability.
Protocol Upgrades and a Revised Role for Vitalik Buterin
Stańczak described the discussions surrounding Ethereum’s base-layer roadmap as extensive and community-driven, noting that the changes are designed to sharpen focus among researchers and core developers. Stańczak wrote:
Our discussions about the Layer 1 scaling roadmap have been extensive, and the feedback so far suggests that the community appreciates our ambition. Turning that ambition into reality now depends on the focus of the core development teams and researchers.
As part of its strategic transition, the Ethereum Foundation is aiming to give Vitalik Buterin more time to focus on advanced research rather than daily operational oversight.
“We aimed, among other things, to free more of Vitalik’s time for research and exploration,” Stańczak stated, adding that Buterin’s recent writings on topics like RISC-V and zkVMs have been instrumental in directing attention toward potentially “transformative technologies.”
According to Stańczak, these insights have played a significant role in realigning the Ethereum community around long-term priorities, such as privacy, modularity, and decentralized infrastructure.
Stańczak clarified that Buterin’s proposals are not mandates but starting points for community-led exploration:
Vitalik’s proposals will always carry weight, but they are intended to start conversations and encourage progress in difficult research areas.
He also stressed the importance of giving other researchers the same freedom, highlighting ongoing work by contributors like Justin Drake and Tankard Feist.
Overall. the Foundation’s research direction is now geared toward short-term outcomes that include better Layer-1 scaling, enhanced Layer-2 integration, and more “seamless” user experiences—especially in upcoming upgrades like Pectra, Fusaka, and Glamsterdam.
RISC-V Proposal and Developer Flexibility
The Foundation is also assessing the feasibility of moving from the Ethereum Virtual Machine (EVM) to a more modern execution environment powered by RISC-V.
This proposal, initially introduced by Buterin, suggests that RISC-V could streamline execution, improve efficiency, and simplify zero-knowledge proof implementation.
“We are exploring ways to bring forward projects that currently look three to five years away,” Stańczak noted, referencing possible acceleration in next-gen execution and consensus layer development.
RISC-V’s benefits include broader language compatibility and the potential for backward compatibility with existing EVM contracts. Developers could continue using Solidity and Vyper or expand into languages like Rust.
Additionally, RISC-V could improve validator performance through hardware-level customization, while maintaining core Ethereum features such as account models and contract interactions.
As research and experimentation continue, Stańczak emphasized the importance of community input: “Ethereum researchers often ask that readers recognize the exploratory nature of their posts and proposals. Focus remains essential.”
Featured image created with DALL-E, Chart from TradingView
Editorial Process for bitcoinist is centered on delivering thoroughly researched, accurate, and unbiased content. We uphold strict sourcing standards, and each page undergoes diligent review by our team of top technology experts and seasoned editors. This process ensures the integrity, relevance, and value of our content for our readers.

Reason to trust
![]()
Strict editorial policy that focuses on accuracy, relevance, and impartiality
Created by industry experts and meticulously reviewed
The highest standards in reporting and publishing
Strict editorial policy that focuses on accuracy, relevance, and impartiality
Morbi pretium leo et nisl aliquam mollis. Quisque arcu lorem, ultricies quis pellentesque nec, ullamcorper eu odio.
Crypto analyst Incognito has predicted that the Ethereum price could soon rally to as high as $2,700. This bullish prediction comes despite ETH’s underperformance so far, with the altcoin’s market share already dropping to new lows.
Ethereum Price Could Rally To $2,700 As Wyckoff Accumulation Nears
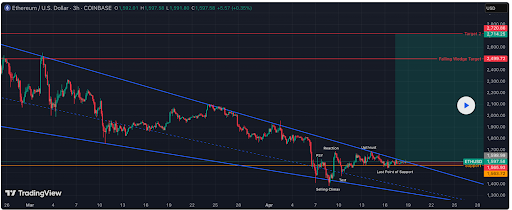
In a TradingView post, Incognito predicted that the Ethereum price could witness a big move to $2,700 with the Wyckoff accumulation almost over. He remarked that if support holds, the ETH should see a breakout of the falling wedge. The analyst’s accompanying chart showed that $2,499 is the target for the falling wedge, while $2,700 is the second target that Ethereum could reach on this breakout.
Related Reading
However, Incognito warned that this could be a huge trap to shake out sellers, so he advised market participants to be looking to take profits. In the meantime, the Ethereum price could indeed break out to the upside, especially with the Bitcoin price attempting to reclaim the $90,000 level.
The Ethereum price is likely to reach new local highs if Bitcoin can sustain this bullish momentum, given their positive correlation. In an X post, crypto analyst Ali Martinez remarked that this week would be big for ETH as the TD Sequential just flashed a buy signal, hinting at a potential shift in momentum.
Martinez also raised the possibility of the Ethereum price recording a new bull rally. For that to happen, he mentioned that ETH needs to break the supply wall at $2,330. The leading altcoin could face significant selling pressure at that range, as 12.62 million addresses bought 68.63 million ETH around that range.
ETH May Have Already Bottomed
In an X post, crypto analyst Titan of Crypto suggested that the Ethereum price has already bottomed or may be bottoming out. He revealed that the leading altcoin is progressing within a giant ascending channel on the macro chart. His accompanying chart showed that ETH could rally to as high as $4,200 following this bullish reversal.
Related Reading
Crypto analyst Hardy also echoed a similar sentiment, suggesting that the Ethereum price has already reached its bottom. He noted that ETH’s weekly candle close was bullish and a good indicator of a potential reversal at the key support level around its current price. His accompanying chart showed that Ethereum could rally to as high as $4,300 on this bullish reversal.
Ethereum price reclaiming the $4,000 level could pave the way for a rally to a new all-time high (ATH). Crypto analyst Crypto Patel predicted that ETH could reach between $6,000 and $8,000 by the end of the year.
At the time of writing, the Ethereum price is trading at around $1,639, up almost 2% in the last 24 hours, according to data from CoinMarketCap.
Featured image from Unsplash, chart from Tradingview.com

Reason to trust
![]()
Strict editorial policy that focuses on accuracy, relevance, and impartiality
Created by industry experts and meticulously reviewed
The highest standards in reporting and publishing
Strict editorial policy that focuses on accuracy, relevance, and impartiality
Morbi pretium leo et nisl aliquam mollis. Quisque arcu lorem, ultricies quis pellentesque nec, ullamcorper eu odio.
Ethereum and the broader crypto market experienced a small but notable pump yesterday, reigniting hopes of a potential trend reversal after weeks of sustained selling pressure. As market uncertainty intensifies, driven largely by global economic tensions and geopolitical strain between the US and China, investors are closely watching for signs of a breakout.
Related Reading
Despite the headwinds, analysts are starting to shift their tone. Some believe that the worst may be behind for Ethereum and that a strong move to the upside could be brewing. One of the most vocal among them is top analyst Carl Runefelt, who shared a bold outlook, suggesting that Ethereum “might go absolutely parabolic starting from here.” His analysis suggests that ETH is poised to break out from a daily descending trendline, which could serve as a key technical signal indicating va shift in momentum in favor of the bulls.
As Ethereum holds above critical support levels and inches closer to a potential trend reversal, traders and investors are now watching closely for follow-through confirmation. If volume and sentiment continue to build, this could be the beginning of a significant rally — one that may reset expectations for the rest of the cycle.
Ethereum Eyes Recovery Amid Rising Global Tensions
Global tensions and macroeconomic uncertainty continue to weigh heavily on investor sentiment, with the ongoing trade war between the US and China sending shockwaves through equities and high-risk assets. In the midst of this fragile backdrop, Ethereum has managed to find a solid support level around $1,500 and is now attempting to reclaim higher ground. After weeks of selling pressure that erased bullish expectations for the year, ETH is showing early signs of recovery.
Ethereum’s current price structure has become a focal point for market participants. The recent bounce from $1,500 marks a potential higher low, a technical setup often associated with trend reversals. If ETH can successfully push above the $1,700 mark and break the descending trendline, it could spark renewed momentum for bulls.
Runefelt shared an optimistic view, stating that Ethereum could go up really fast from here. According to his analysis, the next key price target sits at $3,000, assuming a confirmed breakout above short-term resistance levels.

Despite continued global risks, the Ethereum network remains fundamentally strong, with growing adoption in DeFi and real-world assets. If the breakout materializes and broader market sentiment stabilizes, ETH could lead the next leg of the crypto recovery.
Related Reading
Price Faces Key Resistance As Bulls Struggle for Momentum
Ethereum is currently trading at $1,630 after another failed attempt to break above the $1,700–$1,800 resistance zone. This price range has acted as a major barrier over the past several weeks, limiting bullish momentum and keeping ETH locked in a broader downtrend. Bulls must reclaim the local high at $1,691, set last week, to signal a potential shift in structure and confirm the start of a recovery rally.
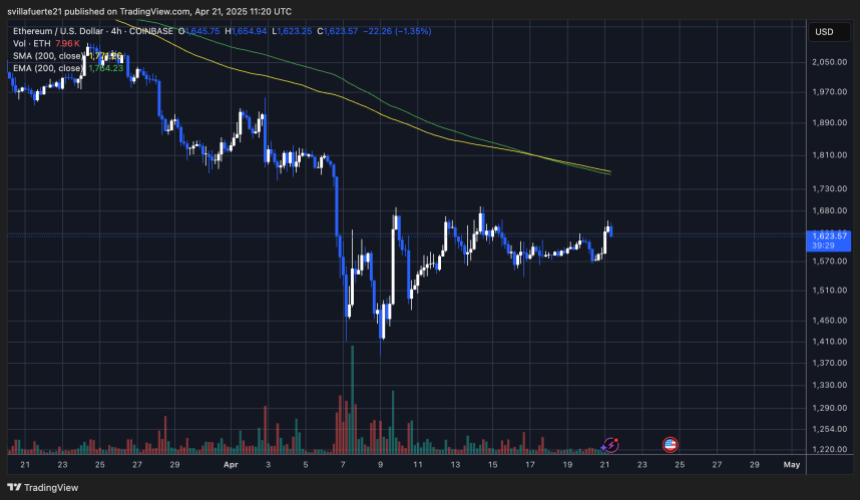
A decisive move above $1,700 could open the door to a test of the $2,000 level, which would mark a significant psychological and technical milestone. However, the lack of follow-through on recent upside attempts reflects ongoing uncertainty across crypto markets, largely driven by macroeconomic tensions and risk-off sentiment.
Related Reading
If Ethereum fails to gain strength above current levels, a retracement toward $1,500 is likely, with the possibility of further downside if selling pressure intensifies. This level has served as a critical support zone in recent weeks. Without a convincing breakout, ETH remains vulnerable to renewed weakness and deeper corrections. All eyes are now on whether bulls can build enough momentum to flip resistance into support and avoid another leg down.
Featured image from Dall-E, chart from TradingView

Report Alleges Massive Meme Coin Sniping on Pump.fun

Solana Leads Blockchain Metrics as SOL Momentum Builds

Crypto Firms Donated $85 million in Trump’s Inauguration

Ethereum to Emphasize Layer-1 Efficiency and UX in Upcoming Protocol Upgrades

XRP Surpasses Ethereum In This Major Metric After Outperforming For 6 Months

PumpFun Moves $13M SOL To Kraken as Solana Price Consolidates, What Next?

2.52 Million Altcoins Are Ruining Crypto’s Future

Animoca Brands Valuation Tanks 75% In Two Years, Here’s Why

Crypto exchange BingX hacked for $43 million

Are The Big Players Losing Interest?

Hong Kong’s Securities Association Tips Authorities On Crypto Self-Regulation

Coinbase cbBTC Set to go Live on Solana
2.52 Million Altcoins Are Ruining Crypto’s Future
Animoca Brands Valuation Tanks 75% In Two Years, Here’s Why
Crypto exchange BingX hacked for $43 million
Are The Big Players Losing Interest?
Hong Kong’s Securities Association Tips Authorities On Crypto Self-Regulation