
Ethereum
Franklin Templeton launches a Bitcoin and Ethereum index ETF


- Franklin Templeton has launched EZPZ ETF tracking Bitcoin and Ether.
- The EZPZ ETF is the second US crypto index ETF.
- The other crypto index is Hashdex’s Nasdaq Crypto Index US ETF (NCIQ).
Franklin Templeton, a prominent global asset manager, has introduced a new exchange-traded fund (ETF) that provides investors with exposure to both Bitcoin (BTC) and Ethereum’s Ether (ETH).
Announced on February 20, 2025, the Franklin Crypto Index ETF, trading under the ticker EZPZ, marks the second crypto index ETF to launch in the United States, following closely on the heels of Hashdex’s Nasdaq Crypto Index US ETF (NCIQ), which debuted on February 14.
The Franklin Bitcoin and Ether Index ETF
The EZPZ fund is designed to track the US CF Institutional Digital Asset Index, a market capitalization-weighted benchmark managed by CF Benchmarks.
As of its launch date, the index allocates approximately 87% of its weighting to Bitcoin — currently priced at $98,706 — while Ether, valued at $2,755, accounts for about 13%.
Franklin Templeton has emphasized that this ETF offers a streamlined way for investors to gain exposure to these leading digital assets without the complexities of directly purchasing and managing them.
Franklin Templeton is excited to launch $EZPZ, our latest exchange-traded product (ETP) that provides exposure to bitcoin and ether without the hassle of buying them directly.
This innovative offering plans to add new digital assets as they become eligible for inclusion in… pic.twitter.com/1snE7mKMht
— Franklin Templeton Digital Assets (@FTDA_US) February 20, 2025
Looking ahead, Franklin Templeton plans to expand the fund’s holdings as additional cryptocurrencies are incorporated into the underlying index, subject to regulatory approval. This forward-thinking approach positions EZPZ as a potential “one-stop-shop” for US investors seeking a diversified crypto portfolio through a single investment vehicle.
The launch of EZPZ comes amid a wave of cryptocurrency ETF developments in the US. Hashdex’s NCIQ, trading on the Nasdaq, similarly focuses on Bitcoin and Ether with plans to broaden its scope over time.
The broader market has also seen a surge in ETF filings throughout 2024, with asset managers submitting proposals for funds tied to altcoins such as Solana (SOL), XRP, and Litecoin (LTC).
In October, NYSE Arca sought approval to list a Grayscale ETF based on the Grayscale Digital Large Cap Fund, a diversified crypto portfolio established in 2018 that includes Bitcoin, Ether, Solana, and XRP, among others.
Additionally, Bitwise recently filed for a 10 Crypto Index Fund ETF with the SEC, further underscoring the growing demand for crypto investment vehicles.
Analysts at Bloomberg Intelligence have expressed optimism about the regulatory outlook, suggesting “relatively high odds of approval across the board” for these new crypto ETF proposals. This momentum highlights a pivotal moment for the integration of digital assets into traditional finance, offering investors more accessible and regulated options to participate in the crypto market.
Franklin Templeton’s entry into the crypto ETF space with EZPZ signals both the firm’s confidence in the maturing digital asset ecosystem and the increasing appetite among mainstream investors for cryptocurrency exposure. As the index evolves and regulatory hurdles are cleared, EZPZ could pave the way for broader adoption of crypto-focused ETFs, bridging the gap between conventional investment strategies and the rapidly expanding world of blockchain-based assets.
For now, the fund stands as a milestone in making Bitcoin and Ether more accessible to US investors, with the promise of further growth on the horizon.


Given the continued volatility in the general crypto market, several major digital assets such as Ethereum and Bitcoin experienced a decrease in investor participation. As a result, the two crypto giants were faced with significant selling pressure, with ETH recording more losses than Bitcoin.
Ethereum Outpaces Bitcoin In Recent Losses
Over the last few days, Ethereum and Bitcoin have struggled with notable bearish pressure that has hampered their upward movements. During this volatile period, seasoned market expert and host of the Crypto Banter show, Kyle Doops, has outlined substantial losses in both assets as observed in the 6-Hour Rolling Losses metric.
Ethereum’s value has declined more precipitously than that of several of its competitors, triggering selling pressure among investors. During the recent sell-off, Ethereum holders have locked in $564 million in losses, highlighting growing investor caution and a shift in market sentiment.
According to the expert, this is one of the worst losses ETH investors have experienced since the 2023 bull began. The notable losses raise concerns about ETH’s short-term resilience and future performance as volatile market conditions constantly affect investors’ confidence in the altcoin.
Kyle Doops highlighted that while losses are decreasing, this could imply that the market is adjusting to lower pricing. With the market adapting to lower price conditions, the market expert is confident that capitulation is still present.

In another X post, Kyle Doops reported that Bitcoin is navigating rough waters as it suffers significant losses amid persistent market turbulence. This huge loss has also triggered speculations about the sustainability of BTC’s renewed upward trend to key levels like $85,000.
Data from the expert reveals that investors of the largest cryptocurrency asset experienced about $250 million in realized losses in just 6 hours after last week’s sharp drop. In the current market cycle, this loss is one of the biggest so far.
However, looking at the chart, each leg down is exhibiting less pain, which suggests that sellers might be running out of ammo. As key technical resistance levels continue to hinder BTC’s uptrend, the future of the flagship asset is becoming increasingly uncertain.
Where One Of ETH’s Strongest Support Lies
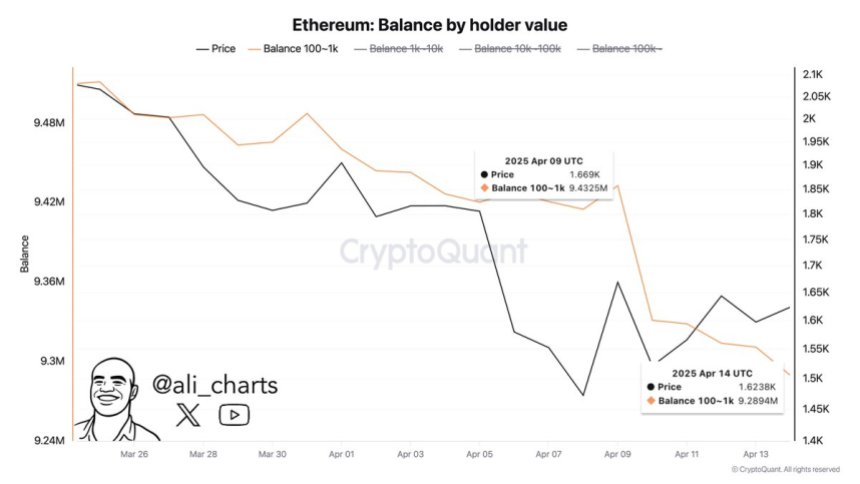
ETH has made a brief rebound to the $1,600 mark after a sudden drop on Wednesday. Delving into the price action, Ali Martinez, a crypto analyst, has underlined a crucial support zone for Ethereum, where significant investor interest was seen in spite of continued price fluctuation.
While the altcoin slowly rebounds, Ali Martinez highlighted that the $1,528.50 is a key support level in its price dynamics. This is due to the notable accumulation around this level. On-chain data shows that about 2.61 million wallet addresses purchased more than 4.82 million ETH in this zone, making it a robust area of support against downside pressure.
Featured image from Unsplash, chart from Tradingview.com
Editorial Process for bitcoinist is centered on delivering thoroughly researched, accurate, and unbiased content. We uphold strict sourcing standards, and each page undergoes diligent review by our team of top technology experts and seasoned editors. This process ensures the integrity, relevance, and value of our content for our readers.

Reason to trust
![]()
Strict editorial policy that focuses on accuracy, relevance, and impartiality
Created by industry experts and meticulously reviewed
The highest standards in reporting and publishing
Strict editorial policy that focuses on accuracy, relevance, and impartiality
Morbi pretium leo et nisl aliquam mollis. Quisque arcu lorem, ultricies quis pellentesque nec, ullamcorper eu odio.
Ethereum is trading around the $1,600 level after several days of failed attempts to reclaim higher prices. Bulls are showing signs of life, but their momentum remains weak as bearish pressure continues to dominate the market. Despite a brief recovery bounce last week, Ethereum’s broader structure still reflects a clear downtrend.
Related Reading
The crypto market remains under the shadow of macroeconomic uncertainty, as ongoing tensions between the United States and China weigh heavily on global financial sentiment. No resolution or agreement between the two economic giants has been announced, leaving investors cautious and risk-averse.
Adding to the negative sentiment, CryptoQuant data shows that Ethereum whales have offloaded approximately 143,000 ETH over the past week. This large-scale distribution reinforces fears of further downside, with long-term holders and large wallets choosing to reduce exposure rather than accumulate.
While some analysts still see potential for a turnaround if key levels are reclaimed, the current market environment remains fragile. Unless Ethereum can regain and hold above short-term resistance levels, the threat of another leg down remains very real. Traders are now closely watching price action for signs of a shift — but for now, caution continues to lead the way.
Ethereum Faces Selling Pressure As Whales Exit
Ethereum is facing a critical test as price action continues to lack clarity, and support levels remain fragile. Despite brief attempts to rebound, ETH has failed to establish a clear bottom, and the downtrend structure remains intact. The market is struggling to define a strong demand zone, making it difficult for bulls to sustain upward momentum. As selling pressure mounts, analysts are warning that Ethereum may continue to slide toward lower demand levels in the absence of strong buying interest.
Broader macroeconomic conditions continue to weigh heavily on risk assets like Ethereum. Global trade tensions, particularly the unresolved tariff standoff between the United States and China, have created uncertainty across financial markets. Combined with fears of a slowing global economy and lack of coordinated fiscal support, crypto markets remain under pressure.
Adding to the bearish sentiment, top analyst Ali Martinez shared on-chain data revealing that whales have offloaded approximately 143,000 ETH over the past week. This large-scale distribution by influential holders has significantly weakened Ethereum’s outlook, reinforcing concerns that smart money is preparing for deeper downside.
Since late December, ETH has remained in a prolonged bearish trend, with every attempt at recovery being met by renewed selling. Unless bulls reclaim key technical levels and shift market sentiment, Ethereum may continue to slide further.
Related Reading
ETH Price Stuck In Volatile Range
Ethereum is currently trading at $1,600 after enduring days of massive volatility and macroeconomic-driven uncertainty. Despite brief relief bounces, ETH remains locked in a bearish structure, unable to generate sustained momentum. For bulls to regain control, reclaiming the $1,850 resistance level is critical. This level aligns with the 4-hour 200 MA and EMA around $1,800, making it a key zone to watch for confirmation of a short-term trend reversal.

Holding above these moving averages would signal renewed strength and possibly mark the beginning of a recovery rally. However, price action continues to struggle beneath them, and failure to push above these indicators would confirm persistent weakness. In that case, Ethereum may retest the $1,500 level or even dip below it if selling pressure intensifies.
Related Reading
The current environment is shaped by global tensions and macro uncertainty, with no clear catalysts to drive a breakout in either direction. As long as ETH remains below its key moving averages, the risk of another leg down remains elevated. Bulls must act swiftly to flip sentiment and avoid a deeper correction toward long-term demand levels.
Featured image from Dall-E, chart from TradingView

Meet Samuel Edyme, Nickname – HIM-buktu. A web3 content writer, journalist, and aspiring trader, Edyme is as versatile as they come. With a knack for words and a nose for trends, he has penned pieces for numerous industry player, including AMBCrypto, Blockchain.News, and Blockchain Reporter, among others.
Edyme’s foray into the crypto universe is nothing short of cinematic. His journey began not with a triumphant investment, but with a scam. Yes, a Ponzi scheme that used crypto as payment roped him in. Rather than retreating, he emerged wiser and more determined, channeling his experience into over three years of insightful market analysis.
Before becoming the voice of reason in the crypto space, Edyme was the quintessential crypto degen. He aped into anything that promised a quick buck, anything ape-able, learning the ropes the hard way. These hands-on experience through major market events—like the Terra Luna crash, the wave of bankruptcies in crypto firms, the notorious FTX collapse, and even CZ’s arrest—has honed his keen sense of market dynamics.
When he isn’t crafting engaging crypto content, you’ll find Edyme backtesting charts, studying both forex and synthetic indices. His dedication to mastering the art of trading is as relentless as his pursuit of the next big story. Away from his screens, he can be found in the gym, airpods in, working out and listening to his favorite artist, NF. Or maybe he’s catching some Z’s or scrolling through Elon Musk’s very own X platform—(oops, another screen activity, my bad…)
Well, being an introvert, Edyme thrives in the digital realm, preferring online interaction over offline encounters—(don’t judge, that’s just how he is built). His determination is quite unwavering to be honest, and he embodies the philosophy of continuous improvement, or “kaizen,” striving to be 1% better every day. His mantras, “God knows best” and “Everything is still on track,” reflect his resilient outlook and how he lives his life.
In a nutshell, Samuel Edyme was born efficient, driven by ambition, and perhaps a touch fierce. He’s neither artistic nor unrealistic, and certainly not chauvinistic. Think of him as Bruce Willis in a train wreck—unflappable. Edyme is like trading in your car for a jet—bold. He’s the guy who’d ask his boss for a pay cut just to prove a point—(uhhh…). He is like watching your kid take his first steps. Imagine Bill Gates struggling with rent—okay, maybe that’s a stretch, but you get the idea, yeah. Unbelievable? Yes. Inconceivable? Perhaps.
Edyme sees himself as a fairly reasonable guy, albeit a bit stubborn. Normal to you is not to him. He is not the one to take the easy road, and why would he? That’s just not the way he roll. He has these favorite lyrics from NF’s “Clouds” that resonate deeply with him: “What you think’s probably unfeasible, I’ve done already a hundredfold.”
PS—Edyme is HIM. HIM-buktu. Him-mulation. Him-Kardashian. Himon and Pumba. He even had his DNA tested, and guess what? He’s 100% Him-alayan. Screw it, he ate the opp.

Sui Meme Coins Surge With Rising DEX Volumes

Tron Founder Justin Sun Reveals Plan To HODL Ethereum Despite Price Drop

Top 3 AI Coins To Watch: RENDER, IP, and CLANKER

Ethereum Investors Suffer More Losses Than Bitcoin Amid Ongoing Market Turmoil

Dogecoin Price Breakout in view as Analyst Predicts $5.6 high

Hedera Struggles Under $0.17 Despite Strong Support

2.52 Million Altcoins Are Ruining Crypto’s Future

Animoca Brands Valuation Tanks 75% In Two Years, Here’s Why

Crypto exchange BingX hacked for $43 million

Are The Big Players Losing Interest?

Hong Kong’s Securities Association Tips Authorities On Crypto Self-Regulation

Coinbase cbBTC Set to go Live on Solana
2.52 Million Altcoins Are Ruining Crypto’s Future
Animoca Brands Valuation Tanks 75% In Two Years, Here’s Why
Crypto exchange BingX hacked for $43 million
Are The Big Players Losing Interest?
Hong Kong’s Securities Association Tips Authorities On Crypto Self-Regulation
Coinbase cbBTC Set to go Live on Solana
-

 Market23 hours ago
XRP Dips To $1.97 – A Golden Opportunity Before The Next Rally?
-

 Market22 hours ago
No Rate Cut Soon, Crypto Banking Rules to Ease
-

 Market16 hours ago
Bitcoin Whales Withdraw $280 Million: Bullish Signal?
-

 Market21 hours ago
Ethereum Price Struggles to Rebound—Key Hurdles In The Way
-

 Ethereum21 hours ago
77K Ethereum Moved to Derivatives—Is Another Price Crash Looming?
-

 Market20 hours ago
Bitcoin and Global M2 Money Supply: A Misleading Connection?
-
 Altcoin19 hours ago
Crypto Whales Bag $20M In AAVE & UNI, Are DeFi Tokens Eyeing Price Rally?
-
 Bitcoin17 hours ago
Gary Gensler Explains Why Bitcoin Will Outlast Altcoins
