
Ethereum
February Promises To Be Positive For Ethereum – Historic Data Supports Bull Trend

Ethereum (ETH) has been in a downtrend since late December, facing significant selling pressure and negative market sentiment regarding its performance this year. Despite Bitcoin and other altcoins showing signs of recovery, ETH has struggled to gain momentum, leaving investors questioning whether it will underperform this cycle.
However, top analyst Carl Runefelt shared valuable insights on X, revealing that historical data suggests Ethereum tends to perform very bullishly in key phases of the market cycle. While sentiment remains bearish in the short term, Runefelt believes ETH is still poised for significant upside if it follows past market trends.
The coming weeks will be crucial in determining Ethereum’s next major move. If ETH can reclaim key resistance levels, it could reverse its downtrend and align with the broader bullish momentum seen in the market. However, failure to gain traction could see ETH continue its underperformance, leading to further doubts about its role in this cycle’s rally.
With historical trends pointing toward a potential breakout, all eyes are now on Ethereum’s ability to recover and confirm a bullish trajectory.
February Could Spark An Ethereum Rally
Ethereum has struggled to gain momentum for the past several months, lagging behind Bitcoin and many altcoins. Compared to previous cycles, ETH has remained underwhelming, leading to growing concerns that it might continue to underperform throughout the year. With several fast-growing altcoins emerging and gaining market share, some analysts even speculate that ETH’s position as the second-largest cryptocurrency could be at risk.
Despite the negative sentiment, Ethereum could be approaching a key opportunity for investors. Historically, February has been a strong month for ETH, often marking the start of its parabolic move in the fourth year of the Bitcoin halving cycle. If this trend holds, ETH could be on the verge of a bullish turnaround despite its weak performance so far.
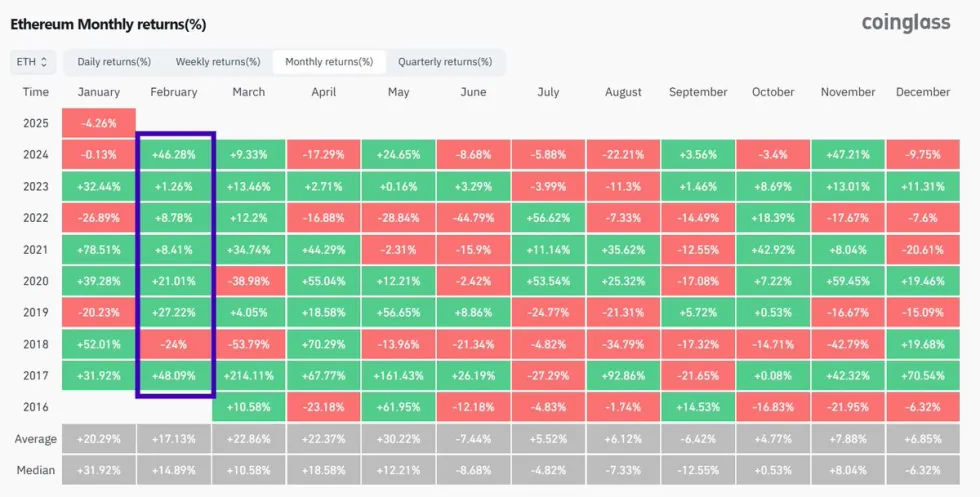
Top analyst Carl Runefelt recently shared a chart on X highlighting Ethereum’s historical monthly returns, revealing that February has consistently been one of ETH’s best months across past cycles. If ETH follows this historical pattern, it could be gearing up for a significant rally, reversing its downtrend and aligning with the broader bullish sentiment in the market.
For now, Ethereum must break out of its bearish structure and reclaim key resistance levels. If it can do so, a major rally could be on the horizon.
Ethereum Struggles at $3,220
Ethereum is trading at $3,220 after enduring days of negative sentiment, volatility, and uncertainty. Despite Bitcoin and other altcoins showing signs of strength, ETH has yet to confirm a trend reversal, leaving investors cautious about its next move.
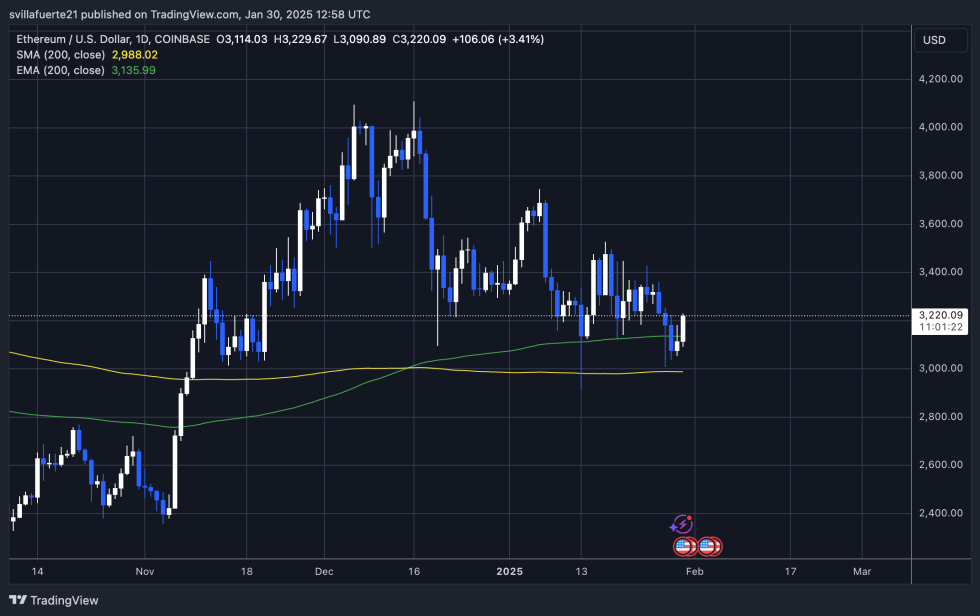
To break out of its bearish structure, ETH must push above $3,220 and reclaim key resistance levels that previously acted as strong support for weeks. The critical zone to watch is $3,500, as a breakout above this mark would confirm bullish momentum and signal the start of a new uptrend.
However, failure to hold current levels could lead to further downside pressure. If ETH drops below $3,000, it could trigger a deeper correction, shaking investor confidence and extending Ethereum’s underperformance relative to Bitcoin and other leading altcoins.
For now, Ethereum remains in a crucial consolidation phase, and the coming weeks will determine whether ETH can reclaim its strength or continue to struggle below key resistance levels.
Featured image from Dall-E, chart from TradingView


Reason to trust
![]()
Strict editorial policy that focuses on accuracy, relevance, and impartiality
Created by industry experts and meticulously reviewed
The highest standards in reporting and publishing
Strict editorial policy that focuses on accuracy, relevance, and impartiality
Morbi pretium leo et nisl aliquam mollis. Quisque arcu lorem, ultricies quis pellentesque nec, ullamcorper eu odio.
Ethereum is trading above the $1,500 mark after a week of heightened volatility and continued global trade uncertainty. Macroeconomic tensions — driven by tariffs, shifting policies, and weakened investor sentiment — continue to weigh heavily on crypto markets. Despite the recent bounce, Ethereum’s price action still hints at a broader downtrend, with bulls struggling to reclaim key resistance levels that could trigger a meaningful recovery.
Related Reading
However, there are signs of potential strength ahead. If bulls manage to push ETH above immediate resistance zones, a bullish momentum shift could emerge. Market watchers are closely monitoring cost basis levels to identify where strong demand may resurface.
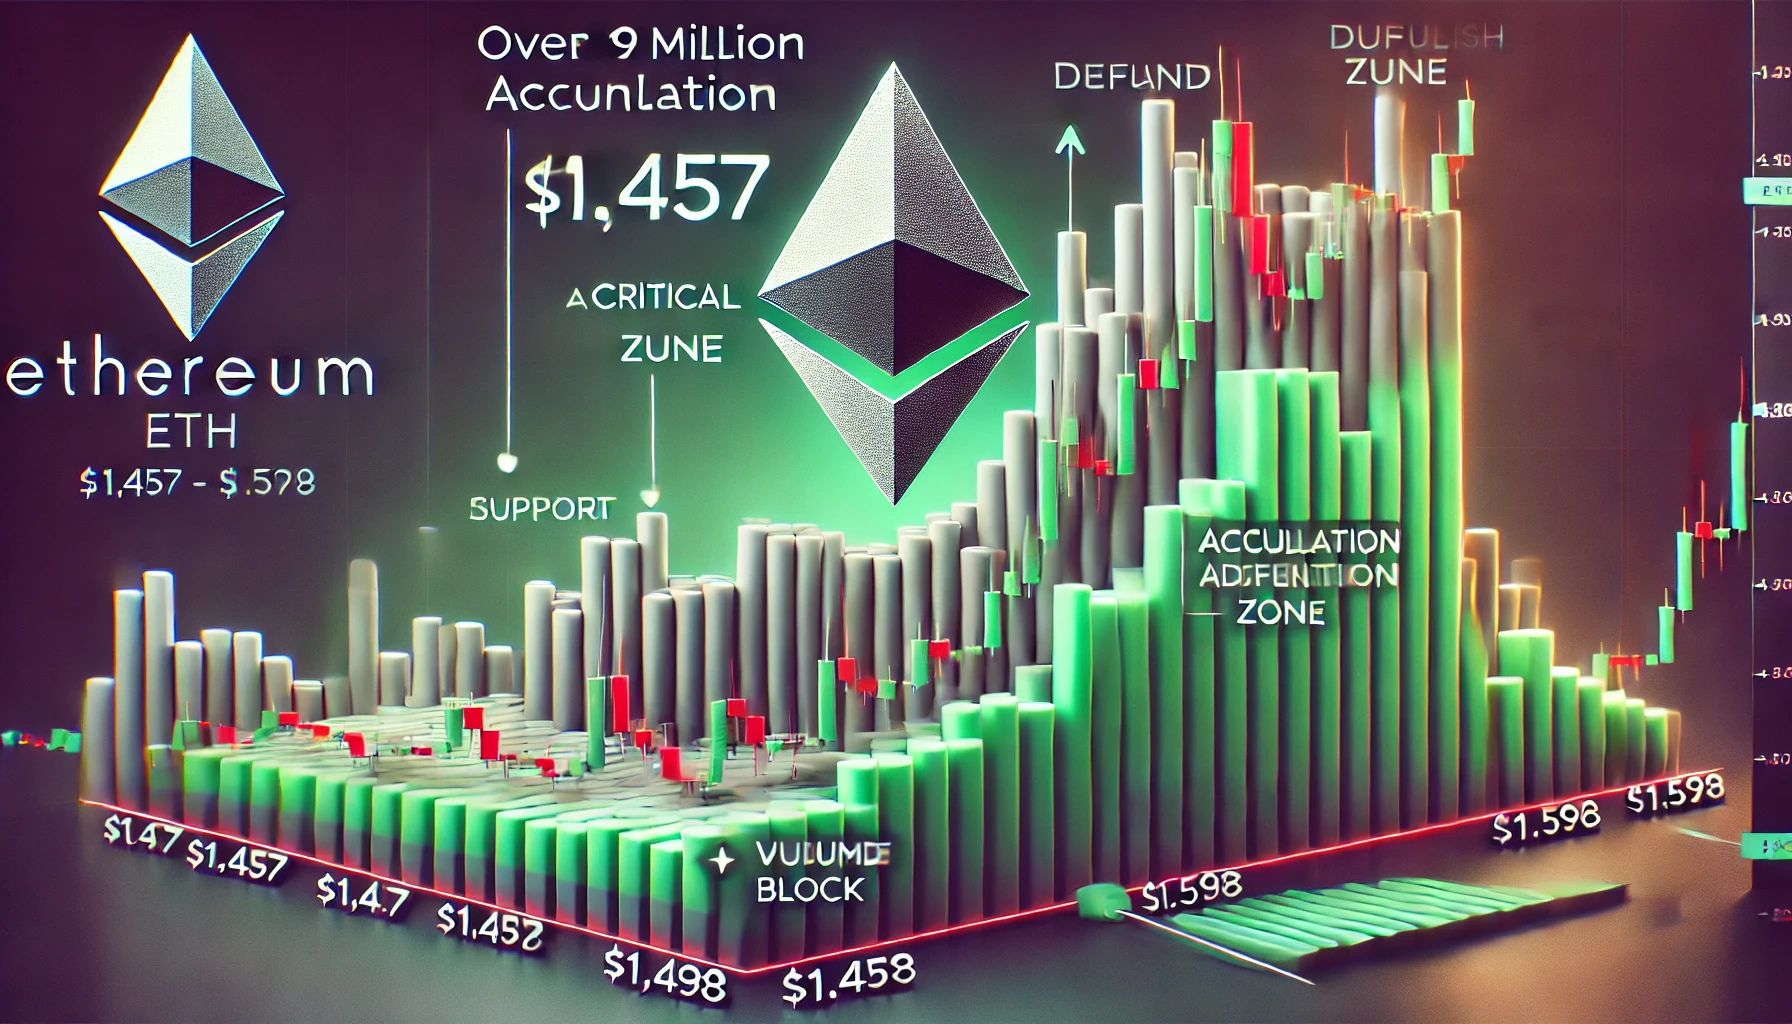
According to data from Glassnode, Ethereum’s Cost Basis Distribution reveals three key price clusters likely to shape short-term action. Among them, the $1,546 level stands out as the most significant, with 822,440 ETH previously accumulated in this range. A successful hold or breakout above this zone could provide a solid foundation for a larger recovery.
For now, Ethereum’s outlook remains cautiously neutral, with bulls needing to reclaim higher levels to shift sentiment and challenge the broader downtrend.
Ethereum Key Cost Basis Levels Could Define Price Action
Ethereum has lost over 50% of its value since early February, setting the stage for a challenging but potentially pivotal recovery phase. After months of heavy selling pressure, ETH is now trading just above the $1,500 mark, a zone that could serve as a springboard if bullish momentum builds. While the broader market has shown signs of recovery, Ethereum’s underwhelming price action continues to test investor patience. Still, analysts believe a recovery rally is possible, especially if macroeconomic sentiment improves.
Persistent global trade tensions, ongoing tariff battles, and US foreign policy shifts continue to inject volatility into financial markets. These factors have suppressed demand for risk assets like Ethereum, but some believe that the worst may be behind.
Glassnode’s on-chain data offers a more detailed look at Ethereum’s short-term outlook. According to their Cost Basis Distribution analysis, three price clusters are likely to shape ETH’s near-term price action. Around $1,457, roughly 408,000 ETH were previously accumulated. At $1,546, over 822,000 ETH sit, making it one of the most critical levels. Finally, approximately 725,000 ETH were acquired around $1,598.

These clusters reflect areas of high on-chain activity and are expected to act as support or resistance zones during the current phase of price consolidation. A breakout above the $1,600 level could trigger a more significant move toward $1,800 and beyond. For now, Ethereum’s price remains range-bound, but market participants are watching these levels closely for signs of a decisive shift.
Related Reading
ETH Faces Crucial Resistance As Bulls Fight to Regain Momentum
Ethereum is currently trading at $1,580 after failing to break above the $1,700 resistance level, signaling that bullish momentum remains weak. Despite a brief recovery from recent lows, ETH has struggled to reclaim higher ground, and key resistance levels continue to weigh on price action.
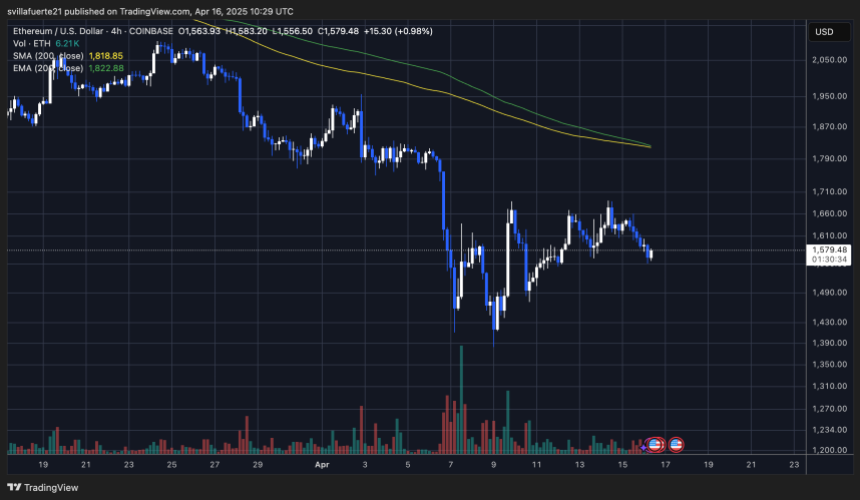
For bulls to confirm the start of a true recovery phase, Ethereum must push above the 4-hour 200 MA and EMA, both hovering around $1,820. A decisive move above these indicators would indicate renewed market confidence and open the door for a push toward critical demand levels around $2,000.
However, the risk of further downside remains. If Ethereum loses the $1,500 support level, selling pressure could accelerate, potentially driving the price below the $1,400 mark. This zone served as a key level in early 2023 and could be retested if bearish momentum builds.
Related Reading
With macroeconomic uncertainty and trade tensions still dominating the narrative, investors remain cautious. The next few trading sessions will be critical for ETH, as it hovers between potential recovery and the threat of renewed decline. Traders should watch for volume spikes and reaction around the $1,700 and $1,500 zones to assess the next move.
Featured image from Dall-E, chart from TradingView


Ethereum (ETH) is down nearly 50% over the past year, eroding investor confidence in the second-largest cryptocurrency by market cap. However, crypto analysts suggest that ETH’s fortunes might be about to turn.
Ethereum Set For A Bullish Breakout?
Unlike Bitcoin (BTC), ETH has not significantly benefited from the bullish developments of 2024. While the approval of spot BTC exchange-traded funds (ETFs) opened the floodgates for institutional capital to flow into the top digital asset, ETH ETFs have failed to generate the same level of interest.
Moreover, ETH’s underperformance relative to BTC has only deepened. Crypto analyst Daan Crypto Trades shared the following two-week ETH/BTC chart showing how ETH has consistently broken through key high time-frame support levels against BTC over the past few years.

Currently, ETH is trading at levels not seen since 2020 relative to BTC. According to the analyst, the final major ETH/BTC support lies around 0.016 – nearly 20% below the current level of 0.019.
On a more optimistic note, fellow analyst Ted pointed out that ETH may be breaking out of a downward-sloping trendline on the two-hour chart. He commented:
Global markets are gaining some strength, so expect Ethereum to hold the $1,550-$1,600 level. For now, I’m hoping for a breakout above and close above $1,670 for a rally towards $2K.
Similarly, seasoned analyst Titan of Crypto highlighted that ETH appears poised to break out from an ascending triangle pattern on the weekly time frame. According to him, ETH is currently trading at the bottom of the structure and could be setting up to test the top of the formation around $3,600.

For the uninitiated, the ascending triangle is a continuation pattern that forms when price makes higher lows while facing resistance at a horizontal level, eventually creating a triangle shape. It signals building buying pressure, and a breakout above the resistance line often leads to a strong upward move.
Rising ETH Exchange Reserves Could Suppress Price
While the analysts above point to a potential bullish reversal for ETH, crypto analyst Ali Martinez noted that over 368,000 ETH has been sent to exchanges since the beginning of the month. A rise in exchange reserves for a digital asset is typically bearish news, as it indicates that holders may be looking to sell their assets in the near-term.
Additionally, even if ETH has already bottomed for this market cycle, it still faces strong resistance around the $2,300 mark. At press time, ETH trades at $1,612, down 2.7% over the past 24 hours.
Featured Image from Unsplash.com, charts from X and TradingView.com
Editorial Process for bitcoinist is centered on delivering thoroughly researched, accurate, and unbiased content. We uphold strict sourcing standards, and each page undergoes diligent review by our team of top technology experts and seasoned editors. This process ensures the integrity, relevance, and value of our content for our readers.

Reason to trust
![]()
Strict editorial policy that focuses on accuracy, relevance, and impartiality
Created by industry experts and meticulously reviewed
The highest standards in reporting and publishing
Strict editorial policy that focuses on accuracy, relevance, and impartiality
Morbi pretium leo et nisl aliquam mollis. Quisque arcu lorem, ultricies quis pellentesque nec, ullamcorper eu odio.
Ethereum (ETH) continues to hold a crucial support level after recovering from last week’s correction. Its recent bounce from historical demand zones has led some analysts to suggest that the altcoin is gearing up for a breakout.
Related Reading
Ethereum Holds Key Support
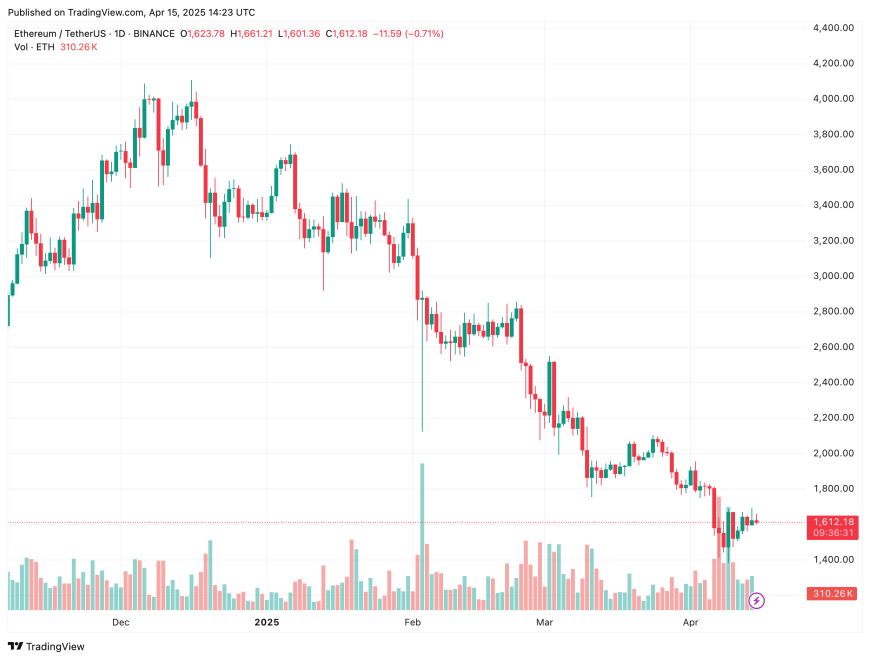
Ethereum has reclaimed the key $1,600 level after dropping below the $1,400 support for the first time since 2023. The second-largest cryptocurrency by market capitalization recently fell to a two-year low during last week’s correction, fueled by US President Donald Trump’s trade tariff war.
ETH touched $1,385 last Wednesday, retesting the 2018 all-time high (ATH) levels before recovering. Amid Trump’s 90-day tariff pause announcement, Ethereum jumped over 10% from $1,480 to $1,600, briefly nearing the $1,700 resistance. However, its price retraced to the $1,400-$1,500 support zone on Thursday amid the market’s volatility.
Over the weekend, the King of Altcoins recovered, hovering between the $1,580-$1,680 price range for the past four days. Ethereum has reclaimed the $1,600 support in the past 24 hours, fueling a bullish sentiment among some market watchers.
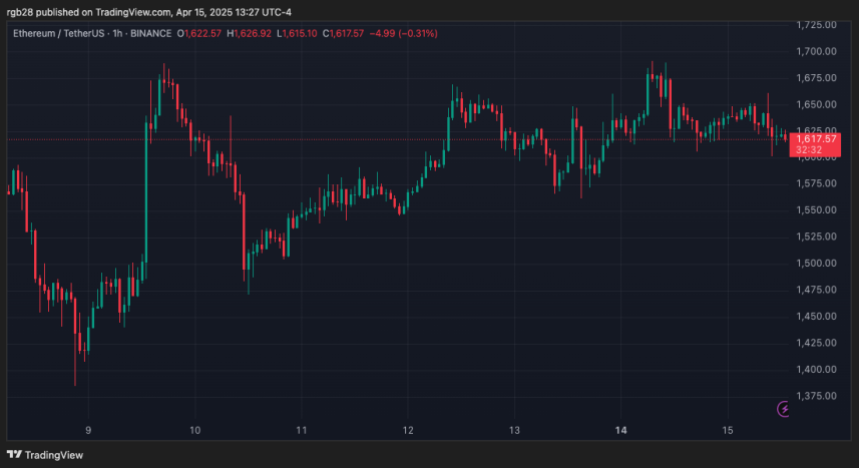
Analyst Ted Pillows noted that ETH might be getting closer to a breakout from its short-term downtrend line. According to him, investors could expect the cryptocurrency to hold the $1,550-$1,600 level now that global markets are gaining some strength.

He considers holding this range could propel Ethereum’s price toward the one-month downtrend line. A breakout and confirmation of this resistance, at around $1,670, could set the base for a 20% jump toward the $2,000 resistance level.
Is ETH Out Of The Woods?
Merlijn The Trader suggested that ETH is gearing up for a breakout. The market watcher pointed out the cryptocurrency’s two-month descending channel, which could be “history” if volume surges.
The analyst considers that as Ethereum nears the channel’s upper boundary, “all we need now is volume” for a surge above the $1,690 mark, adding that a breakout from this level would target $2,700.
He also underscored that ETH’s double top formation was completed after “smashing” the $1,432 target, signaling that it “survived the storm.” Notably, the cryptocurrency confirmed this pattern, which developed within its $2,196-$3,904 Macro Range, following its March close below the $2,100 support.
After recovering from the recent lows, “Now comes the face-melting rally no one expects. $4,000 is only the beginning.”
Meanwhile, Rekt Capital highlighted that Ethereum’s Dominance has almost equaled old All-Time Lows. He explained that since June 2023, ETH’s Dominance has dropped from 20% to 8%, historically a reverse area for the cryptocurrency.
Related Reading
“Generally, Ethereum Dominance needs to hold this green area for a chance at reversal Increasing ETH Dominance would be highly beneficial for Altcoin valuations over time,” he noted Monday.
When the ETH Dominance hit the $7.5%-8.25% range, it reversed “to become more market-dominant,” which could signal a reversal for the King of Altcoins.
As of this writing, ETH trades at $1,609, a 1% decrease in the daily timeframe.
Featured Image from Unsplash.com, Chart from TradingView.com

Base Meme Coin Wipes $15 Million After Official Promotion

ETF Issuers Bring Stability to Bitcoin Despite Tariff Chaos

Here’s What Happens If The XRP Price Closes Out This Week Above $2.25

Over 1.9M Ethereum Positioned Between $1,457 And $1,598 – Can Bulls Hold Support?

Bitcoin and Ethereum Now Accepted by Panama City Government

Ripple and the SEC Receive 60-Day Pause to Reach Settlement

2.52 Million Altcoins Are Ruining Crypto’s Future

Animoca Brands Valuation Tanks 75% In Two Years, Here’s Why

Crypto exchange BingX hacked for $43 million

Are The Big Players Losing Interest?

Hong Kong’s Securities Association Tips Authorities On Crypto Self-Regulation

Coinbase cbBTC Set to go Live on Solana
2.52 Million Altcoins Are Ruining Crypto’s Future
Animoca Brands Valuation Tanks 75% In Two Years, Here’s Why
Crypto exchange BingX hacked for $43 million
Are The Big Players Losing Interest?
Hong Kong’s Securities Association Tips Authorities On Crypto Self-Regulation
Coinbase cbBTC Set to go Live on Solana
-

 Market23 hours ago
Hedera Under Pressure as Volume Drops, Death Cross Nears
-

 Market21 hours ago
3 US Crypto Stocks to Watch Today: CORZ, MSTR, and COIN
-

 Market20 hours ago
Bitcoin Price on The Brink? Signs Point to Renewed Decline
-

 Market22 hours ago
Ethena Labs Leaves EU Market Over MiCA Compliance
-

 Market18 hours ago
XRP Price Pulls Back: Healthy Correction or Start of a Fresh Downtrend?
-
 Altcoin18 hours ago
Ripple Whale Moves $273M As Analyst Predicts XRP Price Crash To $1.90
-

 Market17 hours ago
Arbitrum RWA Market Soars – But ARB Still Struggles
-

 Bitcoin17 hours ago
Is Bitcoin the Solution to Managing US Debt? VanEck Explains
