
Ethereum
Ethereum Stays Strong Above Trendline, Targeting $3,659 Resistance Level

Ethereum (ETH) may be poised for a significant rally as the price has continued to demonstrate strong resilience above its bullish trendline. ETH’s ability to sustain its position above the trendline after a successful breakthrough suggests that a decisive move toward the $3,659 mark could be on the horizon. Therefore, traders and investors are on a steady lookout as the digital asset sets the stage for possible further gains.
This article delves into providing an in-depth analysis of Ethereum’s current momentum and the implications of its approach to this crucial resistance level by analyzing current price action and technical indicators.
ETH’s price was trading at approximately $3,503 and was up by 1.88% with a market capitalization of over $421 billion and a trading volume of over $16 billion as of the time of writing. There has been an increase of 1.90% and 14% in both ETH’s market capitalization and trading volume respectively in the last 24 hours.
Market Analysis: Ethereum’s Bullish Performance
Currently, on the 4-hour chart, ETH has demonstrated bullish resilience following a successful break above the trendline and the $3,360 resistance level. The focus is now on the $3,659 resistance level, while the price continues to trade above the 100-day Simple Moving Average (SMA). This price stability suggests that Ethereum may be poised to initiate a potential rally toward the $3,659 resistance level.

Additionally, the 4-hour Composite Trend Oscillator indicates that ETH may maintain its bullish trajectory toward the $3,659 mark. The signal line has crossed above the SMA of the indicator, and both lines are currently attempting to move back into the overbought zone.
On the 1-day chart, after a successful break above the $3,360 resistance, the price experienced a retest and is now showing a bullish move toward the $3,659 level. ETH is also trading above both the 100-day SMA and the bullish trendline. These recent price actions suggest that the cryptocurrency could experience further gains.

Finally, it can be observed that the signal line has crossed above the SMA of the indicator and has moved out of the overbought zone, with both lines attempting to move above the zero line. This formation of the composite trend oscillator suggests that Ethereum’s price might continue its bullish move toward the $3,659 mark.
Strategic Insights: Navigating ETH’s Bullish Trajectory
If Ethereum continues its bullish momentum and successfully closes above the $3,659 resistance level, it may advance further to challenge the $3,975 resistance. A breach of this level could lead to additional upward movement toward even higher price levels.
Conversely, if ETH experiences a pullback at $3,659, it may start to decline toward the $3,360 support range. Should this support level be broken, the digital asset could face further declines, potentially testing the $3,051 support target and possibly other lower levels.
Featured image from iStock, chart from Tradingview.com


Semilore Faleti is a cryptocurrency writer specialized in the field of journalism and content creation. While he started out writing on several subjects, Semilore soon found a knack for cracking down on the complexities and intricacies in the intriguing world of blockchains and cryptocurrency.
Semilore is drawn to the efficiency of digital assets in terms of storing, and transferring value. He is a staunch advocate for the adoption of cryptocurrency as he believes it can improve the digitalization and transparency of the existing financial systems.
In two years of active crypto writing, Semilore has covered multiple aspects of the digital asset space including blockchains, decentralized finance (DeFi), staking, non-fungible tokens (NFT), regulations and network upgrades among others.
In his early years, Semilore honed his skills as a content writer, curating educational articles that catered to a wide audience. His pieces were particularly valuable for individuals new to the crypto space, offering insightful explanations that demystified the world of digital currencies.
Semilore also curated pieces for veteran crypto users ensuring they were up to date with the latest blockchains, decentralized applications and network updates. This foundation in educational writing has continued to inform his work, ensuring that his current work remains accessible, accurate and informative.
Currently at NewsBTC, Semilore is dedicated to reporting the latest news on cryptocurrency price action, on-chain developments and whale activity. He also covers the latest token analysis and price predictions by top market experts thus providing readers with potentially insightful and actionable information.
Through his meticulous research and engaging writing style, Semilore strives to establish himself as a trusted source in the crypto journalism field to inform and educate his audience on the latest trends and developments in the rapidly evolving world of digital assets.
Outside his work, Semilore possesses other passions like all individuals. He is a big music fan with an interest in almost every genre. He can be described as a “music nomad” always ready to listen to new artists and explore new trends.
Semilore Faleti is also a strong advocate for social justice, preaching fairness, inclusivity, and equity. He actively promotes the engagement of issues centred around systemic inequalities and all forms of discrimination.
He also promotes political participation by all persons at all levels. He believes active contribution to governmental systems and policies is the fastest and most effective way to bring about permanent positive change in any society.
In conclusion, Semilore Faleti exemplifies the convergence of expertise, passion, and advocacy in the world of crypto journalism. He is a rare individual whose work in documenting the evolution of cryptocurrency will remain relevant for years to come.
His dedication to demystifying digital assets and advocating for their adoption, combined with his commitment to social justice and political engagement, positions him as a dynamic and influential voice in the industry.
Whether through his meticulous reporting at NewsBTC or his fervent promotion of fairness and equity, Semilore continues to inform, educate, and inspire his audience, striving for a more transparent and inclusive financial future.

Reason to trust
![]()
Strict editorial policy that focuses on accuracy, relevance, and impartiality
Created by industry experts and meticulously reviewed
The highest standards in reporting and publishing
Strict editorial policy that focuses on accuracy, relevance, and impartiality
Morbi pretium leo et nisl aliquam mollis. Quisque arcu lorem, ultricies quis pellentesque nec, ullamcorper eu odio.
Ethereum has once again fallen below the $2,000 mark, a psychological level it had briefly reclaimed earlier this week. The market-wide correction over the past 24 hours has weighed on Ethereum’s recovery momentum, and the leading altcoin has seen a dip in sentiment that could lead to a deeper decline or a sharp mid-term rebound.
Short-term sentiment is cautious, but a new analysis from a well-followed crypto analyst has brought attention to a significant technical event that opens up a bullish perspective for the Ethereum price.
Ethereum Hits 300-Week Moving Average Again: What Happened The Last Time?
Taking to social media platform X, crypto analyst CryptoBullet pointed out that Ethereum has now touched the 300-week moving average for only the second time in its history. The first instance was in June 2022, during the market-wide crash that saw the Ethereum price plummet to as low as $880 before beginning a long, slow recovery.
Related Reading
The second occurrence has come this month, March 2025, just as Ethereum continues to extend its struggles in gaining a footing above $2,000. With Ethereum touching the 300-week moving average again, we can only look back to see what happened last time to get a perspective of what to expect now.
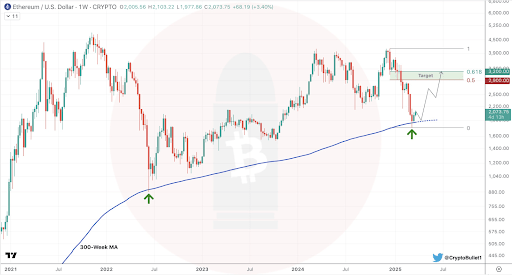
In June 2022, Ethereum’s touch of the 300-week moving average marked the beginning of a long-term recovery phase. After the bounce from that level, the Ethereum price surged more than 140% over the next eight weeks, eventually pushing above $2,100 in August 2022 before another correction.
Mid-Term Rebound In Focus For ETH, But Resistance Ahead
CryptoBullet noted the significance of this moving average, framing it as a key historical support zone. The analyst argued that regardless of bearish sentiment in the short term, this kind of macro-level support typically sets the stage for a meaningful bounce.
Related Reading
“Even if you’re a bear, you can’t deny that we hit a very important support level,” he wrote, adding that his price target for the coming bounce is between $2,900 and $3,200. Nonetheless, the bounce will depend on how the Ethereum price reacts to the level, as a continued downside move would cancel out any bullish momentum.
For now, Ethereum’s price is trapped under bearish sentiment, and bulls will need to reclaim the $2,000 zone before any sustainable bounce toward the $2,900 and $3,200 range can begin to materialize. Furthermore, the recent price correction in the past 24 hours increases the risks of the Ethereum price closing March below the 3M Bollinger bands, which is currently just around $2,000. A close below the 3M Bollinger bands could spell trouble for the leading altcoin.
However, if CryptoBullet’s analysis proves to be accurate, Ethereum may soon enter a period of stronger price action that plays out over the coming weeks. At the time of writing, Ethereum is trading at $1,907, down by 5.82% in the past 24 hours.
Featured image from Unsplash, chart from Tradingview.com

Reason to trust
![]()
Strict editorial policy that focuses on accuracy, relevance, and impartiality
Created by industry experts and meticulously reviewed
The highest standards in reporting and publishing
Strict editorial policy that focuses on accuracy, relevance, and impartiality
Morbi pretium leo et nisl aliquam mollis. Quisque arcu lorem, ultricies quis pellentesque nec, ullamcorper eu odio.
Ethereum has lost its grip on the key $2,000 level, reigniting fears of a deeper correction as selling pressure returns to the market. Since March 19, ETH has managed to hold above $1,930, but recent weakness has pushed the price dangerously close to breaking below the $1,900 mark. The drop has added fuel to bearish speculation, with traders and analysts now questioning whether a larger pullback is underway.
Related Reading
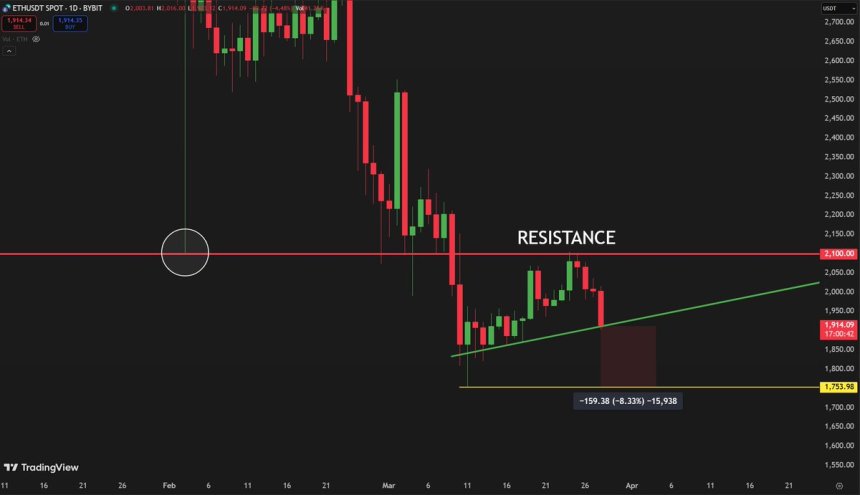
The inability to hold above psychological support levels has weighed heavily on sentiment, especially as broader market volatility continues to grow. Top analyst Carl Runefelt shared his outlook on Ethereum’s current structure, noting that the asset has repeatedly failed to overcome resistance at $2,100 — a level that now acts as a firm ceiling for bullish momentum. According to Runefelt, this repeated rejection suggests Ethereum could be in serious trouble if buyers don’t step in soon.
With momentum fading and no clear catalyst in sight, Ethereum risks slipping further if $1,900 fails to hold. Traders are watching closely for signs of a reversal, but for now, the path of least resistance appears to be downward. ETH must regain lost levels quickly to avoid confirming a broader bearish trend.
Bulls Face Key Test As Resistance Weighs on Price Action
Ethereum is under pressure as the broader crypto market faces one of its most crucial tests in months. With macroeconomic uncertainty mounting and fears of a potential recession in the United States, risk assets across the board are struggling to gain traction — and Ethereum is no exception. The current market environment remains hostile, with inflation concerns, unstable monetary policy, and global trade tensions shaking investor confidence.
ETH’s price action has been particularly underwhelming. Despite widespread expectations that Ethereum would lead a strong rally in early 2025, the asset has failed to meet bullish projections. Instead of gaining ground, ETH has stalled and is now struggling to hold support levels amid growing selling pressure.
Runefelt’s bearish outlook suggests that Ethereum has repeatedly failed to break through the $2,100 resistance level. According to Runefelt, this resistance zone is critical — and Ethereum’s inability to overcome it could be a sign of deeper weakness ahead. He warns that if Bitcoin experiences a breakdown, Ethereum could follow and potentially retest the wick near $1,750, which marked a local low during a previous correction.
With momentum fading and no clear bullish catalyst in sight, Ethereum’s price structure remains fragile. Unless bulls reclaim key levels soon, ETH could face a deeper retrace, especially if broader market sentiment continues to deteriorate.
Traders are closely watching Bitcoin and macroeconomic developments for cues, knowing that a decisive move in either direction could shape Ethereum’s next major trend. For now, the pressure is on — and Ethereum’s resilience is about to be tested.
Related Reading
ETH Bulls Struggle to Hold Key Support
Ethereum (ETH) is currently trading at $1,910 after failing to hold above the critical $2,000 level, a psychological and technical barrier that has now flipped into resistance. The breakdown has weakened short-term momentum and left bulls in a defensive position as selling pressure continues to mount.
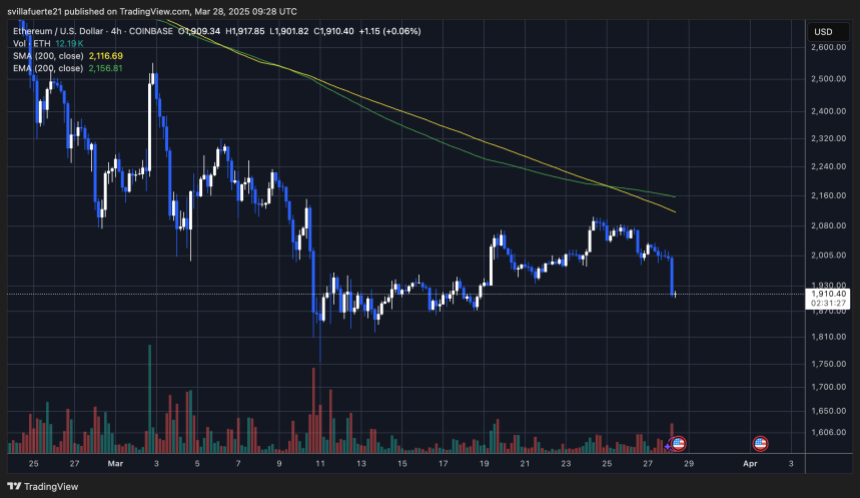
At this stage, the $1,880 level has emerged as a key support zone that bulls must defend to avoid a deeper correction. Holding this level could allow for a consolidation phase and give Ethereum a chance to stabilize before attempting another push higher. However, if ETH loses $1,880, it could spark a wave of aggressive selling, triggering a continuation of the current downtrend and potentially pushing the price toward the $1,750 range.
Related Reading
To regain control of the trend, bulls must reclaim the $2,000 mark as soon as possible. A decisive move back above this level would signal renewed strength and could open the door for a rebound toward higher resistance zones. Until then, Ethereum remains in a fragile position, with the risk of further downside growing as macroeconomic pressure and technical weakness continue to weigh on price action.
Featured image from Dall-E, chart from TradingView

Bitcoin Price Could Surge To $95,000 — But Analyst Sounds ‘Bull Trap’ Alarm

Ethereum Breakdown, Analyst Eyes $1,130–$1,200 Price Target

Did XRP Price Just Hit $21K? Live TV Display Error Goes Viral

El Salvador’s Nayib Bukele Open to White House Visit

South Carolina Could Spend 10% of Funds on Bitcoin Reserve

FDIC and CFTC Rescind Old Crypto Guidelines

2.52 Million Altcoins Are Ruining Crypto’s Future

Animoca Brands Valuation Tanks 75% In Two Years, Here’s Why

Crypto exchange BingX hacked for $43 million

Are The Big Players Losing Interest?

Hong Kong’s Securities Association Tips Authorities On Crypto Self-Regulation

Coinbase cbBTC Set to go Live on Solana
2.52 Million Altcoins Are Ruining Crypto’s Future
Animoca Brands Valuation Tanks 75% In Two Years, Here’s Why
Crypto exchange BingX hacked for $43 million
Are The Big Players Losing Interest?
Hong Kong’s Securities Association Tips Authorities On Crypto Self-Regulation
Coinbase cbBTC Set to go Live on Solana
-

 Altcoin22 hours ago
Dogecoin Price Set To Reach $1 As Once In A Year Buy Opportunity Returns
-

 Market22 hours ago
Analysts Reveal Q2 Crypto Market Outlook: BTC at $200,000?
-

 Market17 hours ago
Coinbase Users Lost $46 Million to Crypto Scams in March
-

 Altcoin17 hours ago
PiDaoSwap, Trump Media, & Grayscale
-
 Regulation22 hours ago
AVAX Price Eyes Rally To $44 As Grayscale Files For Avalanche ETF
-
 Regulation17 hours ago
US SEC Drops Charges Against Hawk Tuah Girl Hailey Welch
-

 Market23 hours ago
Hedera Falls 4% as Bears Dominate: What’s Next for HBAR?
-

 Regulation19 hours ago
FDIC Revises Crypto Guidelines Allowing Banks To Enter Digital Assets