
Ethereum
Ethereum Sell Side Liquidity Thinning On CEXes: Time For $4,000?
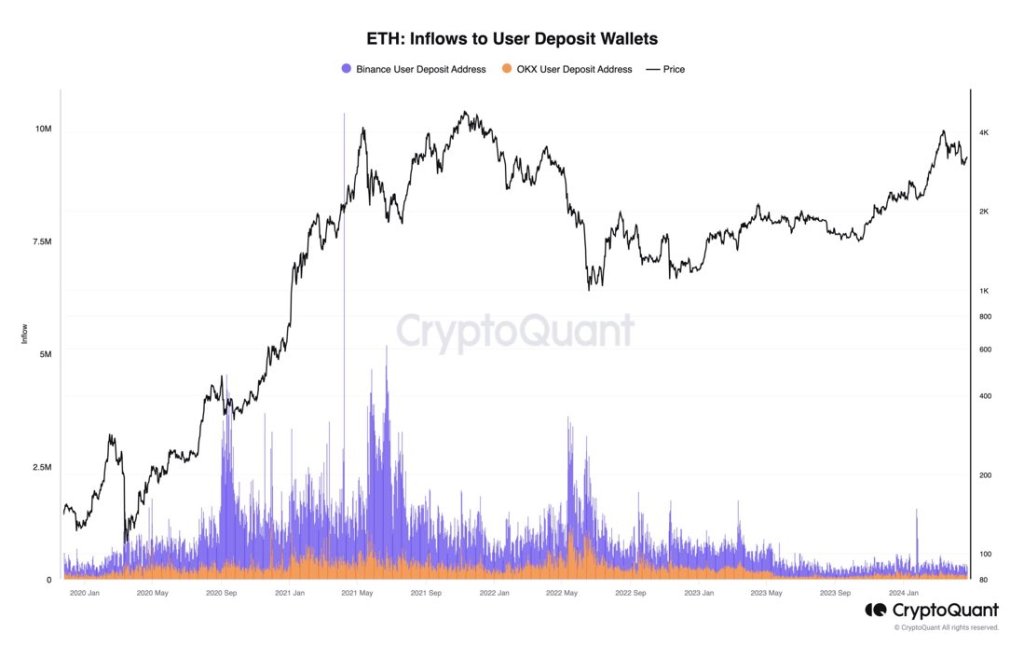
Taking to X on April 26, one analyst notes that there is a high probability of Ethereum spiking in the sessions ahead because of thinning sell-side liquidity across major centralized exchanges like Binance and Coinbase.
Thin Sell-Side, Big Potential Move For ETH
Thinning sell-side liquidity, as seen on order books across CEXes, means that few sellers are willing to liquidate. With few sellers on the market, a small upsurge in demand could theoretically see prices skyrocket.
Even so, market makers could fill this imbalance by considering how the market works. At the same time, prices are not guaranteed to rally even if they remain as they are.
Unlike new meme coins, for instance, Ethereum is extremely liquid; it is the second largest coin by market cap, only trailing Bitcoin. That means billions will be needed to push prices above the immediate resistance levels at $3,300 and $3,700, as clearly shown in the daily chart.
Ethereum has been under pressure for the better part of April following a drop from its all-time high of $4,090. Looking at the development in the daily chart, the coin is down 23% from all-time highs, finding strong rejection from the middle BB–or the 20-day moving average.
Analysts expect buyers to take over and reverse mid-April losses if a comprehensive breakout above $3,300 is marked by expanding volume. If not, ETH risks falling below $2,800, aligning with the April 12 and 13 sell-off.
Spot Ethereum ETF Launch In Hong Kong, Adoption Fuel Optimism
However, traders are generally bullish, anticipating a price rebound in the months ahead. Several factors could propel ETH prices upwards. A major catalyst is the highly anticipated launch of spot Ethereum exchange-traded funds (ETFs) in Hong Kong. Like the impact of spot Bitcoin ETFs on BTC prices, this product for ETH may prop up the coin, allowing traditional investors to gain exposure to the second world’s most valuable coin.
In the United States, the largest obstacle preventing the Securities and Exchange Commission (SEC) from approving a similar product is the uncertainty of ETH’s classification. On April 25, ConsenSys sued the regulator, pressing the regulator to classify the coin as a commodity.
Beyond the launch of this product by the end of the month, Ethereum’s core strengths remain. The ongoing adoption of Ethereum and Layer 2 scaling solutions continues. As more protocols choose to deploy on the smart contracts platform, it fosters optimism for Ethereum’s long-term viability and growth.
Feature image from Canva, chart from TradingView


Reason to trust
![]()
Strict editorial policy that focuses on accuracy, relevance, and impartiality
Created by industry experts and meticulously reviewed
The highest standards in reporting and publishing
Strict editorial policy that focuses on accuracy, relevance, and impartiality
Morbi pretium leo et nisl aliquam mollis. Quisque arcu lorem, ultricies quis pellentesque nec, ullamcorper eu odio.
Ethereum (ETH), the second-largest cryptocurrency by market capitalization, has experienced one of its most challenging starts to the year, recording its second-worst performance in the first quarter of its history.
As of now, ETH is trading just above the crucial support level of $2,000, reflecting a year-to-date decline of 43%. This stark contrast is particularly notable when compared to Bitcoin (BTC) and XRP, which have seen gains of 23% and an astonishing 279%, respectively, during the same period.
Could A 60% Surge In Q2 Bring It Back To $3,200?
Market expert Lark Davis has drawn attention to the dramatic downturn in Ethereum’s price in a recent social media update, highlighting a 38% drop in Q1 of this year for the altcoin.
This figure is alarmingly close to its worst quarterly performance of 46% recorded during the first quarter of 2018, as noted in the comparison chart shared by Davis.
Related Reading
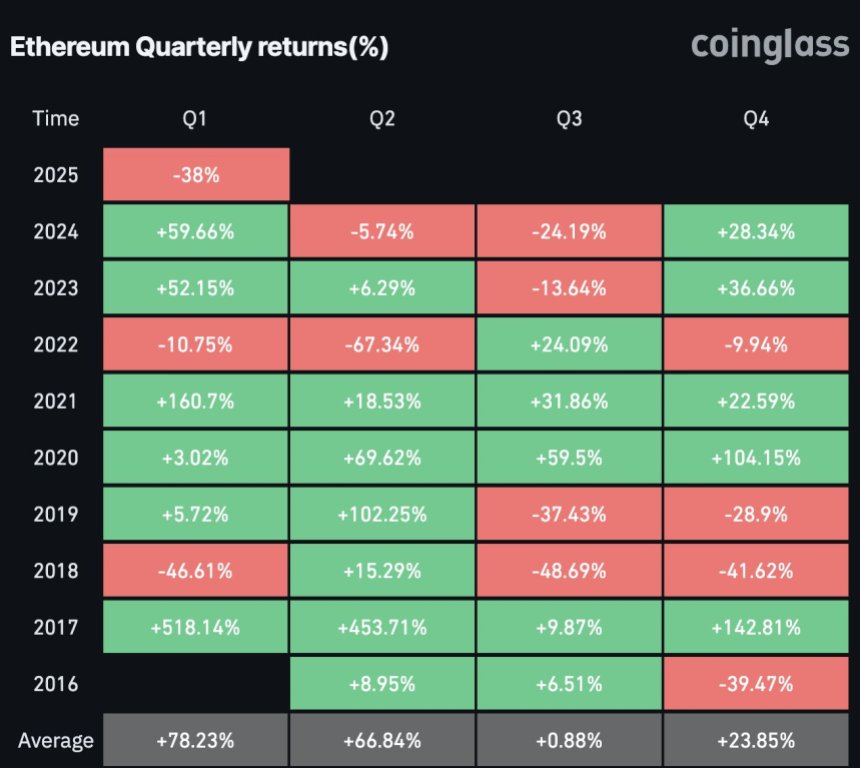
Following that troubling quarter in 2018, Ethereum saw a brief recovery of 15% in Q2, only to face more than 40% declines in the subsequent quarters, respectively, raising concerns for current investors that this pattern might occur once again in this cycle.
Despite these discouraging figures, Davis posed an interesting question regarding the potential for an “explosive” second quarter for Ethereum. Historically, since 2016, ETH has averaged a remarkable 66% surge during this period.
If this trend continues and the Ethereum price were to achieve a 60% increase in the coming months, its price could climb to $3,200 per token—levels not seen since early February of this year.
Crypto Expert Predicts 1,100% Surge For The Ethereum Price
While short-term challenges remain, many analysts retain a long-term bullish outlook for Ethereum. Crypto analyst Merlijn drew parallels between the current market conditions and Bitcoin’s past performance, suggesting that Ethereum is poised for a similar trajectory.
The analyst noted, “Accumulation, breakout, and V-shape recovery loading,” implying that a new bull run could be on the horizon for ETH, with forecasts suggesting it could reach up to $24,000 during this cycle—a major 1,100% increase.
Related Reading
However, the path to recovery is not without its hurdles. Expert Ali Martinez recently highlighted key resistance levels that Ethereum must overcome for a sustainable rebound in the short-term.
Martinez noted that ETH’s price has reclaimed its realized price of $2,040, but the next significant challenge lies at the $2,300 mark, where strong resistance has been observed for the leading altcoin.
Despite a recent recovery that saw a 10% spike in the past two weeks, Ethereum still faces notable monthly losses, down nearly 25% following a broader market correction.
Featured image from DALL-E, chart from TradingView.com

Reason to trust
![]()
Strict editorial policy that focuses on accuracy, relevance, and impartiality
Created by industry experts and meticulously reviewed
The highest standards in reporting and publishing
Strict editorial policy that focuses on accuracy, relevance, and impartiality
Morbi pretium leo et nisl aliquam mollis. Quisque arcu lorem, ultricies quis pellentesque nec, ullamcorper eu odio.
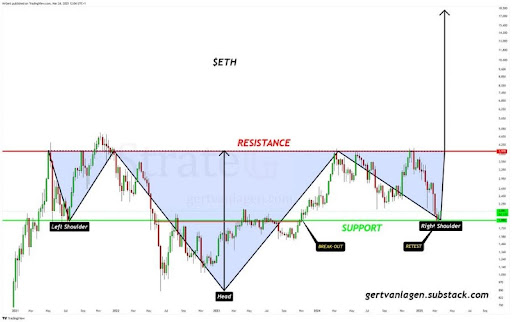
Ethereum (ETH) is showing signs of a bullish breakout, forming a complex Inverse Head and Shoulder (iH&S) pattern on the weekly timeframe. This key technical formation suggests that the Ethereum price is on track for a massive rally toward a bullish target of $18,000.
Ethereum Forms Inverse Head & Shoulder Pattern
The Ethereum price has been in a long consolidation period, experiencing a crash amid the ongoing market turmoil. Despite recording massive declines that have pushed its value significantly below all-time highs, crypto analyst Gert van Lagen on X (formerly Twitter) predicts that ETH could still reach a price target of $18,000.
Related Reading
Notably, Ethereum recently bounced off the $1,800 – $2,000 support range, which previously served as resistance during the ‘Head’ phase of the iH&S pattern. With this crucial retest confirmed, ETH may be entering the final stage of its reversal, set up to new all-time highs.
Lagen’s $18,000 bullish target is more than 8X Ethereum’s current price, underscoring the sheer magnitude of this projection. Lagen has identified the formation of the iH&S structure on the Ethereum chart, supporting his ambitious prediction with this renowned bullish chart pattern.
The Inverse Head and Shoulder is a classic bullish reversal structure, often signaling the end of a downtrend and the beginning of a strong and new uptrend. Considering the Ethereum’s price has been in a downturn, the formation of the iH&S chart pattern suggests that this prolonged decline may be finally coming to an end.
In the analyst’s chart, this left shoulder of the iH&S structure began forming from 2021 to 2022, experiencing a price peak before a pullback. From 2022 to 2023, a deeper decline occurred, marking the cycle low and the formation of the ‘Head.’ Finally, the right shoulder of the technical pattern was formed between 2024 to 2024, recording a higher low that aligned with the left shoulder.
Lagen’s price chart highlights that the most critical level to watch is the neckline of the iH&S structure, which is approximately $3,978 and acts as the primary resistance area.
How An $18,000 ETH Target Is Possible
Still looking at Lagen’s Ethereum price chart, the analyst suggests that if ETH can surpass the $3,978 resistance level with strong volume, it could validate the Inverse Head and Shoulder pattern and open the door for a rally toward $18,000. Conversely, if Ethereum fails to break above this resistance level, a prolonged consolidation or significant pullback may occur before its next breakout attempt.
Related Reading
Lagen predicts that a rejection at the resistance area could see the Ethereum price drop to $1,888 — an important support level which could prevent further declines. A drop to this support would represent a potential 52% dip from the main resistance level and an 8.52% decline from ETH’s current market value of $2,055.
Featured image from Unsplash, chart from Tradingview.com

Reason to trust
![]()
Strict editorial policy that focuses on accuracy, relevance, and impartiality
Created by industry experts and meticulously reviewed
The highest standards in reporting and publishing
Strict editorial policy that focuses on accuracy, relevance, and impartiality
Morbi pretium leo et nisl aliquam mollis. Quisque arcu lorem, ultricies quis pellentesque nec, ullamcorper eu odio.
Ethereum is trading back above the key $2,000 level after spending several volatile weeks attempting to reclaim it. Since late February, ETH has dropped more than 38%, triggering widespread panic as the price broke below major support and briefly dipped under $1,800. The decline sparked fears of a prolonged downtrend, with many questioning whether Ethereum had entered a bear market.
Related Reading
However, sentiment is beginning to shift. Investors are now looking for signs of recovery as ETH stabilizes and retests important levels. A growing number of analysts believe that the recent volatility may have been a final shakeout before a new uptrend.
Top analyst Ted Pillows shared insights on X, suggesting that Ethereum may be wrapping up its “manipulation phase.” This phase typically features erratic price action designed to exhaust both bulls and bears before the market commits to a clear direction. If the phase ends soon, Ethereum could rebound significantly in the coming weeks.
As ETH hovers near $2,000, the next few sessions will be crucial in determining whether bulls can maintain momentum or if further downside lies ahead.
Ethereum Bulls Face A Test As Expansion Phase Looms
Ethereum is showing early signs of strength as it hovers just above the critical $2,000 mark, a level that has acted as both a psychological and technical battleground for weeks. Bulls are being called into action as the broader market begins to stabilize, with ETH price action hinting at a potential recovery. However, the situation remains fragile, with uncertainty dominating sentiment and no clear trend established yet.
Speculation is split between those anticipating a deeper correction and others betting on a full-scale recovery. For now, Ethereum remains range-bound, and any breakout attempt must be backed by strong conviction to shift momentum. Bulls must defend the $2,000 level and begin targeting higher resistance zones to spark confidence in a sustained uptrend.
Pillows stated that Ethereum is likely exiting what he calls the “manipulation phase” — a confusing, price movement designed to exhaust buyers and sellers. According to Pillows, this phase is nearly over, and Ethereum’s expansion time is about to begin.
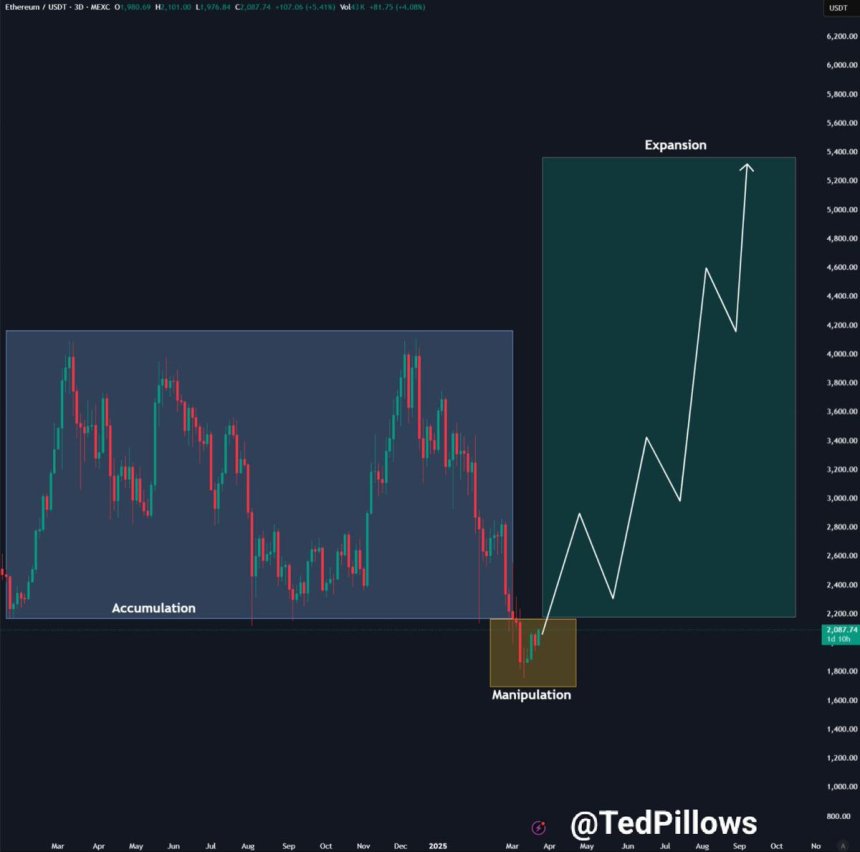
A confirmed breakout above the $2,200 level would be the catalyst for a new expansion cycle, potentially sending ETH into higher territory in the weeks ahead. Until then, price action will remain sensitive, with the next few sessions crucial in deciding Ethereum’s trajectory.
Related Reading
But Bulls Face Key Resistance Ahead
Ethereum is currently trading at $2,070 after managing to reclaim the $2,000 level—a crucial psychological and technical zone that had acted as resistance in recent weeks. This move marks an important step for bulls who are now trying to solidify momentum and prevent further downside. However, the real test lies ahead, as ETH must reclaim the $2,250 level to initiate a true recovery phase.
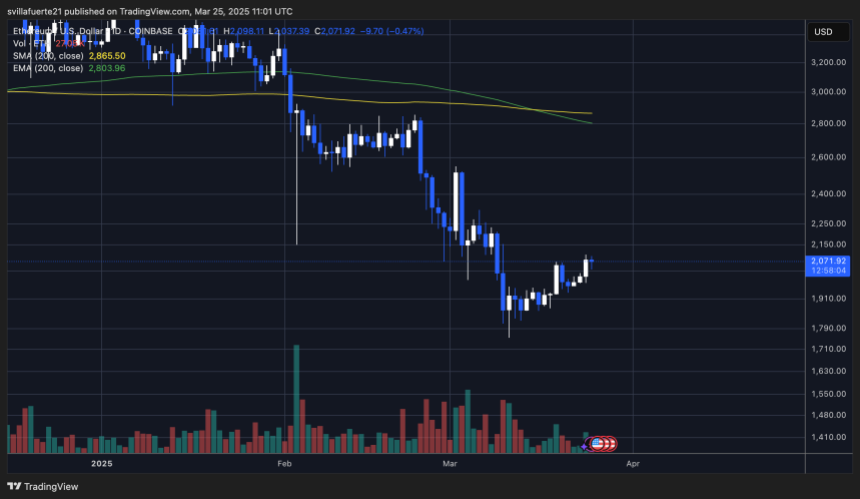
The $2,250 mark aligns with previous areas of heavy trading activity and could act as the launchpad for a broader uptrend if bulls manage to flip it into support. Successfully retaking this level would likely attract fresh demand and restore investor confidence, especially after the asset shed more than 38% of its value since late February.
Related Reading
Despite the short-term optimism, downside risks remain. If Ethereum fails to hold above $2,000, the market could experience renewed selling pressure, potentially pushing ETH back toward the $1,800 support level. Such a drop would reinforce bearish sentiment and delay any potential recovery rally.
For now, traders are watching closely to see if Ethereum can build on its current strength and reclaim higher levels in the sessions ahead.
Featured image from Dall-E, chart from TradingView

Curve Finance Founder Dumps Over 2M CRV Sparking Concerns: What’s Happening?

HBAR Price Under $0.20 Struggles To End 2-Month Downtrend
Can Ripple Resume Institutional Sales?

Cardano (ADA) Next Move—Are Traders Eyeing a Big Push Higher?

Dogecoin Foundation’s Corporate Arm Launches Official DOGE Reserve With Massive Purchase, Here’s What We Know

What It Means for Users

2.52 Million Altcoins Are Ruining Crypto’s Future

Animoca Brands Valuation Tanks 75% In Two Years, Here’s Why

Crypto exchange BingX hacked for $43 million

Are The Big Players Losing Interest?

Hong Kong’s Securities Association Tips Authorities On Crypto Self-Regulation

Coinbase cbBTC Set to go Live on Solana
2.52 Million Altcoins Are Ruining Crypto’s Future
Animoca Brands Valuation Tanks 75% In Two Years, Here’s Why
Crypto exchange BingX hacked for $43 million
Are The Big Players Losing Interest?
Hong Kong’s Securities Association Tips Authorities On Crypto Self-Regulation
Coinbase cbBTC Set to go Live on Solana
-
 Altcoin23 hours ago
Can Chainlink (LINK) Price Hit $44 Amid This Crucial Partnership?
-

 Market22 hours ago
Onyxcoin Price Awaits Reversal To End 8-Week Long Downtrend
-

 Market21 hours ago
Pi Network’s Lack of Transparency Behind Listing Delay
-
 Altcoin18 hours ago
CBOE Files 19b-4 For Fidelity’s Solana ETF With US SEC
-

 Market23 hours ago
Bitcoin Price Dips After Rally—Is This the Perfect Entry Point?
-

 Market20 hours ago
PumpSwap’s Total Trading Volume Surpasses $1 Billion
-
 Altcoin20 hours ago
BlackRock’s BUIDL Launches On Solana Signaling Rising Institutional Adoption
-

 Market19 hours ago
Cardano Holders Refuse To Liquidate, Support Price Rise to $0.85