
Ethereum
Ethereum Price To $2,000 Or $6,000? Analyst Examines Ether’s Future Trajectory

The Ethereum price performance was quite disappointing in the final weeks of 2024, struggling beneath the $3,500 level. This end-of-the-year blues somewhat flowed into the altcoin’s action in the first month of 2025, as it failed to build any serious momentum in the first 30 days of the year.
Unsurprisingly, this sluggish price action has led to the panic of several Ethereum investors, with a portion of the market pondering if to sell their tokens. A popular crypto analyst on the social media platform X has come forward with an in-depth analysis of the ETH price over the next few months.
What Does The Future Hold For ETH Price?
In a Jan. 31 post on X, crypto pundit Ali Martinez tried to answer the “Is it time to sell Ethereum and move on?” question while breaking down its recent price action and on-chain movement. According to the analyst, the future looks somewhat bleak for the price of ETH, as it stands at the risk of a deep correction in the short term.
This is based on the MVRV Ratio (160-day moving average), which tracks the ratio between a coin’s market cap and the realized cap. It helps to evaluate whether a cryptocurrency (Ethereum, in this scenario) is overvalued. According to Martinez, the ETH price recently fell beneath the MVRV (160D-MA), an occurrence that led to a 40% correction the last time.
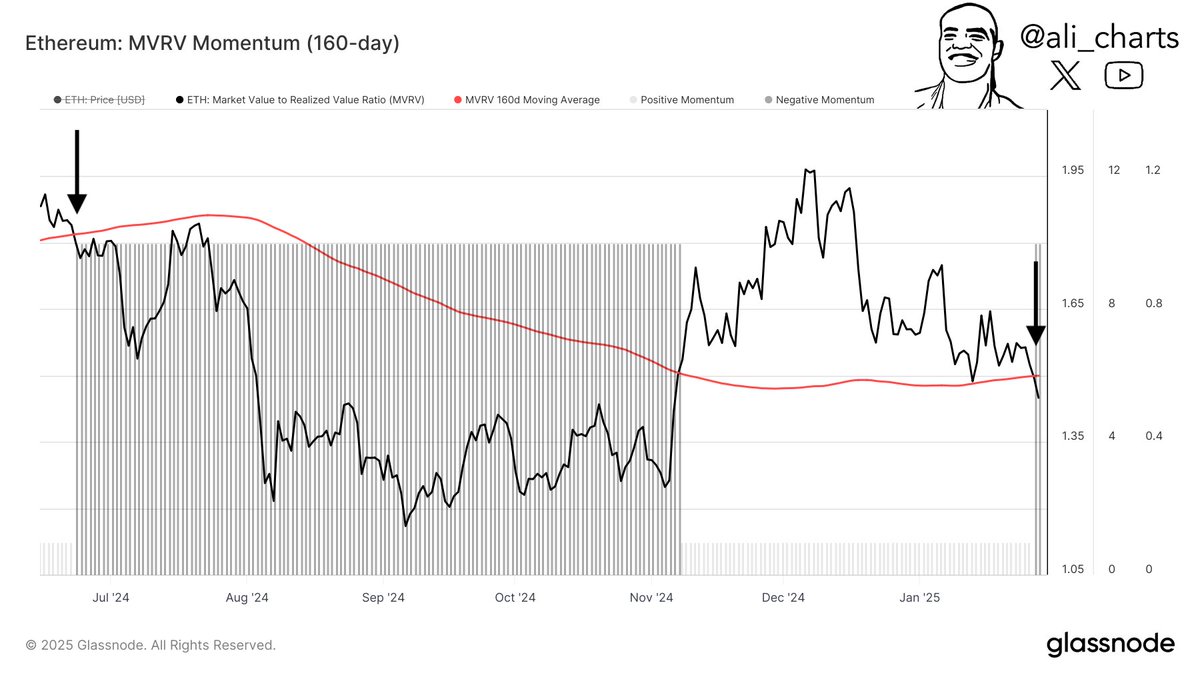
Source: Ali_charts/X
The potential of a severe price pullback has resulted in a shift in investor sentiment, with a particular investor cohort showing some level of anxiety in the market. Data from Glassnode shows that long-term Ethereum holders are beginning to sell off some of their coins, strengthening the odds of a price correction.
In the case of a correction, certain on-chain price levels could be crucial to the long-term health of the ETH price. One such price region is between $2,230 and $2,610 (where nearly 12 million wallets bought 62.27 million ETH), which could act as a major support zone against further decline.
From a technical price analysis standpoint, the ETH price appears to be forming an inverse head-and-shoulders pattern, with a major support level between $2,800 and $3,000. According to Martinez, the Ethereum price could make a play for the pattern’s neckline at $4,000 if this support region holds.
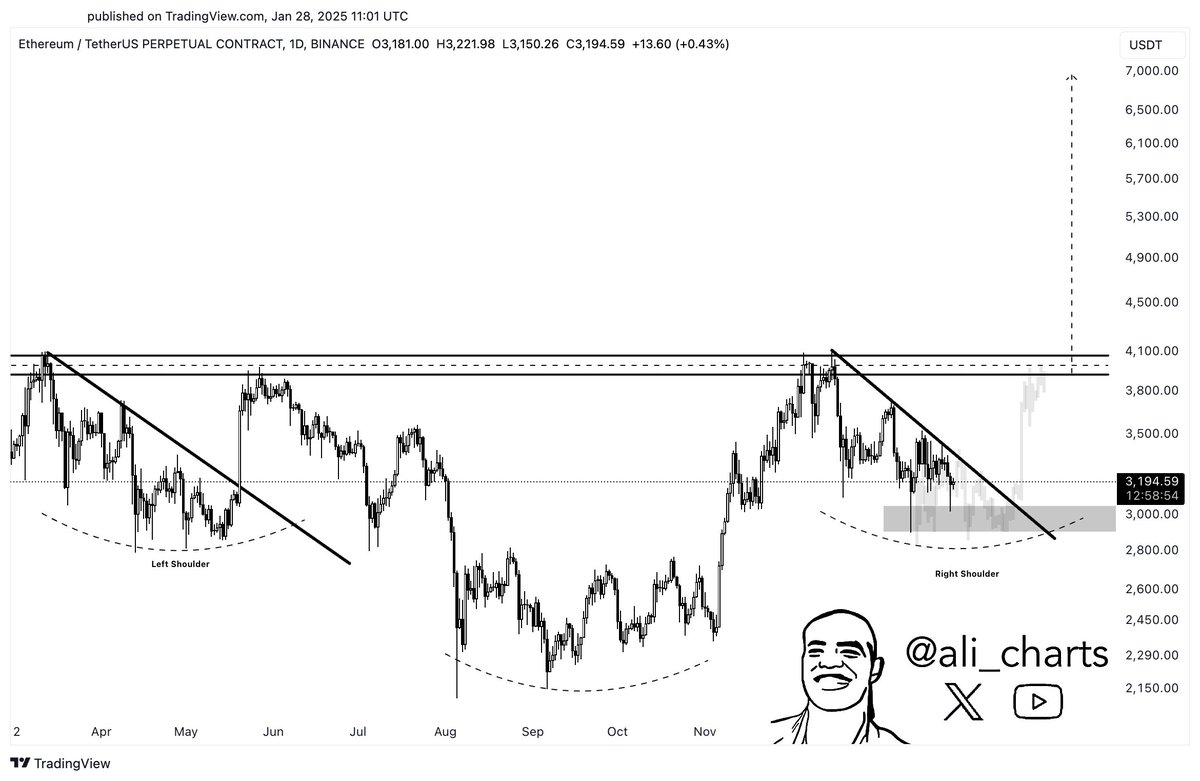
Source: Ali_charts/X
While the $4,000 level has acted as a major resistance level for four years, recent whale accumulation increases the Ethereum price’s chances of breaking this crucial region. The latest on-chain data shows that whales bought over 100,000 ETH (worth over $340 million) in the past few days.
Martinez noted that if the Ethereum price successfully breaks above the $4,000 mark, it could travel as high as $6,770 based on the MVRV pricing bands. This would represent an over 100% rally from the current price point.
Ethereum Price At A Glance
As of this writing, the price of Ethereum stands at around $3,315, reflecting over 2% jump in the past 24 hours.
The Ethereum price loses the $3,300 level on the daily timeframe | Source: ETHUSDT chart on TradingView
Featured image from iStock, chart from TradingView


On-chain data shows the Ethereum transaction fee has dropped to the lowest level in years recently. Here’s what this could mean for ETH’s price.
Ethereum Average Fees Now Valued At Just $0.168
In a new Insight post, the on-chain analytics firm Santiment has discussed the latest trend in the Average Fees of Ethereum. The “Average Fees” is a metric that, as its name suggests, keeps track of the average amount of fees that senders on the ETH network are attaching with their transactions.
This indicator’s value directly correlates to the amount of traffic that the blockchain is dealing with. The reason behind this lies in the fact that the network only has a limited capacity to handle transfers.
When the chain is busy, transfers can remain stuck in waiting until the transactions ahead of them clear out. Those who want their transactions to be processed ASAP can choose to attach a larger-than-average fee, so that the validators prioritise them.
In times of especially high traffic, this kind of competition among users can quickly drive the Average Fees up to significant levels. When there is little activity, however, senders have little incentive to pay any notable amount of fees, so the metric’s value can remain low.
It would appear that Ethereum has been witnessing the latter kind of conditions recently, as the Average Fees have registered a drop.

Looks like the value of the metric has declined to a low level in recent days | Source: Santiment
As displayed in the above graph, the Ethereum Average Fees have fallen to a low of $0.168 recently, which is the lowest that it has been since 2020. This means that activity on the network is historically low at the moment.
According to the analytics firm, this may not actually be so bad from a trading perspective, as low fee periods can often precede rebounds in the cryptocurrency’s price.
Below is a chart that shows an example of this trend in action:

The past trend in the transaction fees of ETH | Source: Santiment
As is visible in the above graph, the Ethereum Average Fees falling under the $1 mark back in 2023 led to bullish momentum for the asset. The explanation behind this pattern may lie in the fact that low-fee periods can indicate disinterest from the crowd.
Historically, ETH and other digital assets have tended to move in a way that goes contrary to the expectation of the majority. This means that a lack of optimism can lead to rebounds, while excessive hype can result in tops. From the chart, it’s apparent that ETH’s Q1 2024 top came as the metric surpassed $15, indicating a plethora of excitement.
“Generally, fee levels under $1 are a pretty promising sign that the crowd has become disinterested,” notes the analytics firm. “Just remember that there is no set guaranteed “bottom” or “top” level every time fee costs breach below or above a certain level.”
ETH Price
At the time of writing, Ethereum is trading around $1,600, up more than 1% in the last 24 hours.
Looks like the price of the asset hasn't moved much recently | Source: ETHUSDT on TradingView
Featured image from Dall-E, Santiment.net, chart from TradingView.com
Editorial Process for bitcoinist is centered on delivering thoroughly researched, accurate, and unbiased content. We uphold strict sourcing standards, and each page undergoes diligent review by our team of top technology experts and seasoned editors. This process ensures the integrity, relevance, and value of our content for our readers.

Given the continued volatility in the general crypto market, several major digital assets such as Ethereum and Bitcoin experienced a decrease in investor participation. As a result, the two crypto giants were faced with significant selling pressure, with ETH recording more losses than Bitcoin.
Ethereum Outpaces Bitcoin In Recent Losses
Over the last few days, Ethereum and Bitcoin have struggled with notable bearish pressure that has hampered their upward movements. During this volatile period, seasoned market expert and host of the Crypto Banter show, Kyle Doops, has outlined substantial losses in both assets as observed in the 6-Hour Rolling Losses metric.
Ethereum’s value has declined more precipitously than that of several of its competitors, triggering selling pressure among investors. During the recent sell-off, Ethereum holders have locked in $564 million in losses, highlighting growing investor caution and a shift in market sentiment.
According to the expert, this is one of the worst losses ETH investors have experienced since the 2023 bull began. The notable losses raise concerns about ETH’s short-term resilience and future performance as volatile market conditions constantly affect investors’ confidence in the altcoin.
Kyle Doops highlighted that while losses are decreasing, this could imply that the market is adjusting to lower pricing. With the market adapting to lower price conditions, the market expert is confident that capitulation is still present.

In another X post, Kyle Doops reported that Bitcoin is navigating rough waters as it suffers significant losses amid persistent market turbulence. This huge loss has also triggered speculations about the sustainability of BTC’s renewed upward trend to key levels like $85,000.
Data from the expert reveals that investors of the largest cryptocurrency asset experienced about $250 million in realized losses in just 6 hours after last week’s sharp drop. In the current market cycle, this loss is one of the biggest so far.
However, looking at the chart, each leg down is exhibiting less pain, which suggests that sellers might be running out of ammo. As key technical resistance levels continue to hinder BTC’s uptrend, the future of the flagship asset is becoming increasingly uncertain.
Where One Of ETH’s Strongest Support Lies
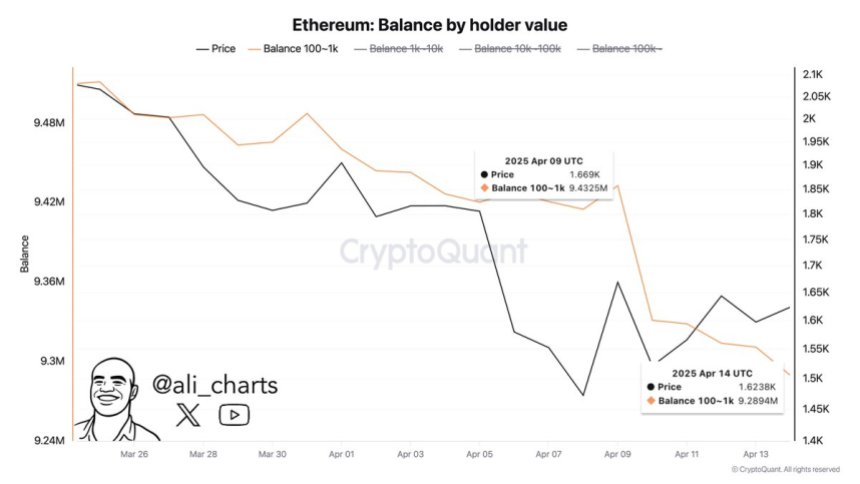
ETH has made a brief rebound to the $1,600 mark after a sudden drop on Wednesday. Delving into the price action, Ali Martinez, a crypto analyst, has underlined a crucial support zone for Ethereum, where significant investor interest was seen in spite of continued price fluctuation.
While the altcoin slowly rebounds, Ali Martinez highlighted that the $1,528.50 is a key support level in its price dynamics. This is due to the notable accumulation around this level. On-chain data shows that about 2.61 million wallet addresses purchased more than 4.82 million ETH in this zone, making it a robust area of support against downside pressure.
Featured image from Unsplash, chart from Tradingview.com
Editorial Process for bitcoinist is centered on delivering thoroughly researched, accurate, and unbiased content. We uphold strict sourcing standards, and each page undergoes diligent review by our team of top technology experts and seasoned editors. This process ensures the integrity, relevance, and value of our content for our readers.

Reason to trust
![]()
Strict editorial policy that focuses on accuracy, relevance, and impartiality
Created by industry experts and meticulously reviewed
The highest standards in reporting and publishing
Strict editorial policy that focuses on accuracy, relevance, and impartiality
Morbi pretium leo et nisl aliquam mollis. Quisque arcu lorem, ultricies quis pellentesque nec, ullamcorper eu odio.
Ethereum is trading around the $1,600 level after several days of failed attempts to reclaim higher prices. Bulls are showing signs of life, but their momentum remains weak as bearish pressure continues to dominate the market. Despite a brief recovery bounce last week, Ethereum’s broader structure still reflects a clear downtrend.
Related Reading
The crypto market remains under the shadow of macroeconomic uncertainty, as ongoing tensions between the United States and China weigh heavily on global financial sentiment. No resolution or agreement between the two economic giants has been announced, leaving investors cautious and risk-averse.
Adding to the negative sentiment, CryptoQuant data shows that Ethereum whales have offloaded approximately 143,000 ETH over the past week. This large-scale distribution reinforces fears of further downside, with long-term holders and large wallets choosing to reduce exposure rather than accumulate.
While some analysts still see potential for a turnaround if key levels are reclaimed, the current market environment remains fragile. Unless Ethereum can regain and hold above short-term resistance levels, the threat of another leg down remains very real. Traders are now closely watching price action for signs of a shift — but for now, caution continues to lead the way.
Ethereum Faces Selling Pressure As Whales Exit
Ethereum is facing a critical test as price action continues to lack clarity, and support levels remain fragile. Despite brief attempts to rebound, ETH has failed to establish a clear bottom, and the downtrend structure remains intact. The market is struggling to define a strong demand zone, making it difficult for bulls to sustain upward momentum. As selling pressure mounts, analysts are warning that Ethereum may continue to slide toward lower demand levels in the absence of strong buying interest.
Broader macroeconomic conditions continue to weigh heavily on risk assets like Ethereum. Global trade tensions, particularly the unresolved tariff standoff between the United States and China, have created uncertainty across financial markets. Combined with fears of a slowing global economy and lack of coordinated fiscal support, crypto markets remain under pressure.
Adding to the bearish sentiment, top analyst Ali Martinez shared on-chain data revealing that whales have offloaded approximately 143,000 ETH over the past week. This large-scale distribution by influential holders has significantly weakened Ethereum’s outlook, reinforcing concerns that smart money is preparing for deeper downside.
Since late December, ETH has remained in a prolonged bearish trend, with every attempt at recovery being met by renewed selling. Unless bulls reclaim key technical levels and shift market sentiment, Ethereum may continue to slide further.
Related Reading
ETH Price Stuck In Volatile Range
Ethereum is currently trading at $1,600 after enduring days of massive volatility and macroeconomic-driven uncertainty. Despite brief relief bounces, ETH remains locked in a bearish structure, unable to generate sustained momentum. For bulls to regain control, reclaiming the $1,850 resistance level is critical. This level aligns with the 4-hour 200 MA and EMA around $1,800, making it a key zone to watch for confirmation of a short-term trend reversal.

Holding above these moving averages would signal renewed strength and possibly mark the beginning of a recovery rally. However, price action continues to struggle beneath them, and failure to push above these indicators would confirm persistent weakness. In that case, Ethereum may retest the $1,500 level or even dip below it if selling pressure intensifies.
Related Reading
The current environment is shaped by global tensions and macro uncertainty, with no clear catalysts to drive a breakout in either direction. As long as ETH remains below its key moving averages, the risk of another leg down remains elevated. Bulls must act swiftly to flip sentiment and avoid a deeper correction toward long-term demand levels.
Featured image from Dall-E, chart from TradingView

HashKey Launches First XRP Tracker Fund With Ripple’s Backing

Circle Introduces On-Chain Refund Protocol to Strengthen USDC Payments

What Good Friday Options Expiry Means for Bitcoin & Ethereum

Ethereum Fee Plunges To 5-Year Low—Is This A Bottom Signal?

Dogecoin (DOGE) Under Pressure—Bearish Setup Could Trigger Sell-Off

Quantum Researchers Offer 1 Bitcoin To Break ‘Toy Version’

2.52 Million Altcoins Are Ruining Crypto’s Future

Animoca Brands Valuation Tanks 75% In Two Years, Here’s Why

Crypto exchange BingX hacked for $43 million

Are The Big Players Losing Interest?

Hong Kong’s Securities Association Tips Authorities On Crypto Self-Regulation

Coinbase cbBTC Set to go Live on Solana
2.52 Million Altcoins Are Ruining Crypto’s Future
Animoca Brands Valuation Tanks 75% In Two Years, Here’s Why
Crypto exchange BingX hacked for $43 million
Are The Big Players Losing Interest?
Hong Kong’s Securities Association Tips Authorities On Crypto Self-Regulation
Coinbase cbBTC Set to go Live on Solana
-
 Altcoin23 hours ago
How Rising Solana Network Inflows Could Drive SOL Price to $150?
-
 Bitcoin23 hours ago
Gary Gensler Explains Why Bitcoin Will Outlast Altcoins
-

 Market22 hours ago
Bitcoin Whales Withdraw $280 Million: Bullish Signal?
-

 Altcoin15 hours ago
CZ Honors Nearly $1 Billion Token Burn Promise
-

 Market23 hours ago
XRP’s $2.00 Pivot Point—A Launchpad or Breakdown Zone?
-

 Market15 hours ago
Over $700 Million In XRP Moved In April, What Are Crypto Whales Up To?
-
 Altcoin22 hours ago
How Crypto Traders Made $666K from $4.5K in One Trade?
-

 Market20 hours ago
Expanding Blockspace and Enhancing Privacy