
Ethereum
Ethereum Is Testing Key Support on the ETH/BTC Chart – A Parabolic Move Could Be Next

Ethereum experienced one of the most chaotic trading days in its history last Monday, as it plunged over 30% in less than 24 hours amid escalating U.S. trade war fears. However, the market quickly rebounded after President Trump announced negotiations with Canada and Mexico, leading to a sharp recovery across crypto assets.
Related Reading
Despite this rebound, Ethereum remains significantly weaker than other altcoins, raising concerns about how long this underperformance will last. Investors are closely watching price action, as ETH continues to trade at historically low levels relative to Bitcoin and other altcoins.
Top analyst Carl Runefelt shared a technical analysis on X, revealing that Ethereum is holding onto a key horizontal support level on the ETHBTC chart. This suggests that ETH could be at a turning point, with a potential opportunity for recovery if bulls step in. However, failure to hold this level could indicate further downside ahead.
With Ethereum lagging behind its peers, sentiment remains mixed, and market participants are waiting for a clear confirmation of trend direction. Will ETH finally start catching up, or is another leg down still on the table? The next few weeks will be crucial.
Ethereum Faces Uncertainty After Record Liquidations
Ethereum has struggled after one of the most brutal liquidation events in crypto history, with over $8 billion wiped out from the market between Sunday night and Monday. ETH was one of the hardest-hit assets, with price action looking weak and uncertain compared to Bitcoin. This has sparked concerns among analysts, who fear Ethereum’s underperformance could continue.
However, top analyst Carl Runefelt remains optimistic. He shared a technical analysis on X, revealing that Ethereum is holding a crucial horizontal support level on the ETHBTC chart around 0.028. Runefelt believes that if ETH bounces from this level, it could trigger a massive parabolic move, marking the beginning of a long-awaited altseason.
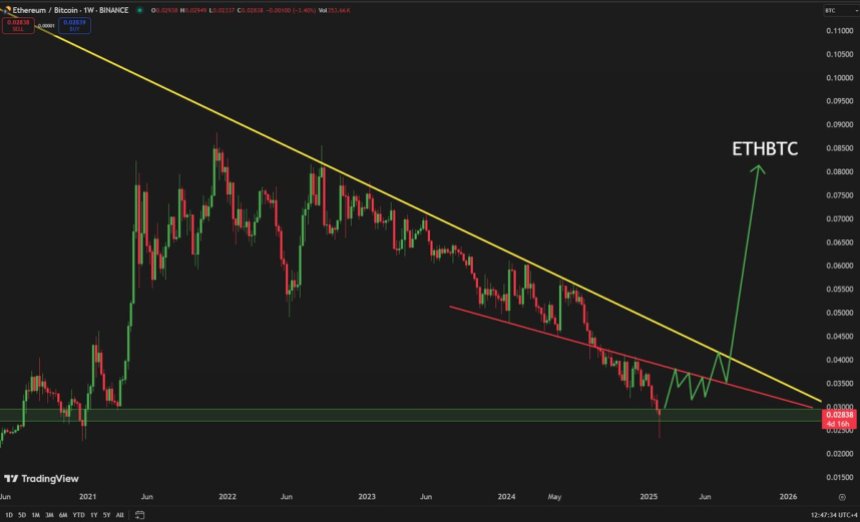
Ethereum has lagged behind BTC since late 2021, failing to reclaim its dominance despite multiple market rallies. While Bitcoin continues to flirt with all-time highs, ETH remains far from its previous peak, and many traders are now questioning whether Ethereum can regain its strength.
Related Reading
For now, Ethereum remains at a make-or-break level, with key support holding but pressure building. If ETH manages to surge from this zone, it could lead to a strong recovery and shift market sentiment. However, failure to hold support could mean further downside ahead.
Can Bulls Reclaim Momentum?
Ethereum is trading at $2,780 after testing two critical moving averages—the 200-day moving average at $2,482 and the 200-day exponential moving average at $2,288. These indicators have been key long-term support levels since July 2020, confirming that Ethereum’s macro trend remains intact despite recent volatility.
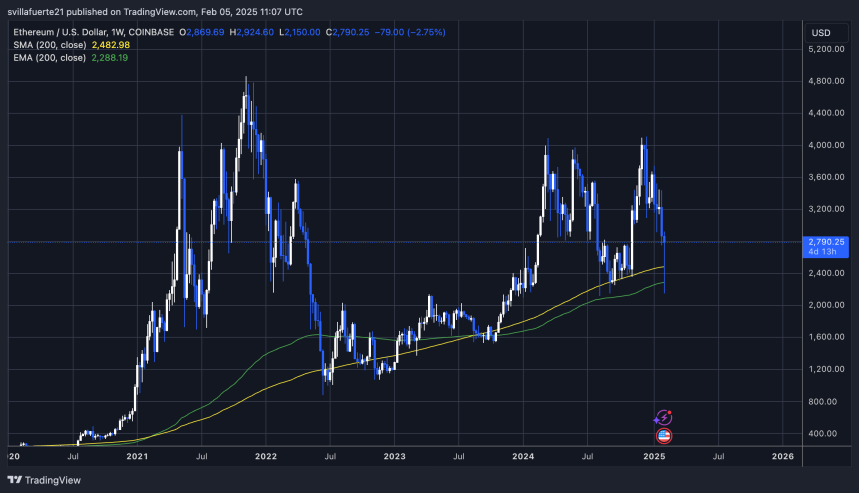
For Ethereum to reverse the short-term bearish trend, bulls must reclaim the $2,800 mark and hold it as support. This level is a psychological and technical barrier that would signal renewed strength. A push above $3,000 is the next critical step, as breaking this resistance would shift sentiment from bearish to bullish and trigger a move into key supply zones.
If Ethereum fails to reclaim these levels, the market could see another wave of selling pressure, pushing ETH back toward lower demand areas. However, historical trends suggest that when ETH holds above these moving averages, it often leads to strong rallies.
Related Reading
Investors are watching closely to see if Ethereum can recover and reestablish its bullish momentum. A breakout above $3,000 would set the stage for a push toward higher resistance levels, potentially leading to a major rally in the coming months.
Featured image from Dall-E, chart from TradingView


Ethereum (ETH) has officially lost the $2,000 mark, trading below this key level for the first time since 2023 and reaching its lowest point since October 2023. The price plummeted as low as $1,750, marking a dramatic drop from its December 2024 high of $4,100. This staggering 57% decline has created a difficult environment for bulls, as Ethereum struggles to find stability amid growing selling pressure.
The broader crypto market downturn, driven by macroeconomic uncertainty and risk-off sentiment, has left ETH in a vulnerable position, with traders unsure whether a bottom has formed or if further downside is ahead. The sharp decline in Ethereum’s value has intensified bearish sentiment, making it one of the worst-performing major altcoins over the past few months.
According to Glassnode data, Ethereum is testing key levels below $2,000 and above $1,800 based on the MVRV Pricing Bands. Historically, this range has acted as a major support zone, and its ability to hold will be critical in determining Ethereum’s short-term price direction. If ETH fails to stabilize, the market could be in for another wave of selling, potentially pushing prices even lower.
Ethereum Tests Critical Support As Market Struggles
The entire crypto market has suffered a major breakdown, mirroring the decline in U.S. stock markets as trade war fears and uncertainty surrounding U.S. President Trump’s policies weigh heavily on investor sentiment. Macroeconomic instability and volatility have been the primary market drivers since the U.S. elections in November 2024, and current conditions suggest that this trend is far from over.
Rising global trade war concerns and erratic decision-making by the U.S. administration have further fueled fear and uncertainty, sending the U.S. stock market to its lowest levels since September 2024. This risk-off environment has translated into increased selling pressure across the crypto market, with Ethereum (ETH) struggling to hold critical support levels.
Top analyst Ali Martinez shared insights on X, highlighting that Ethereum is now testing key levels based on the MVRV Pricing Bands. According to on-chain data, ETH’s Realized Price currently sits at $2,060, a level that has acted as crucial support in previous cycles. If Ethereum fails to hold above this mark, the next major downside target is around $1,440, which would represent a substantial drop from current levels.
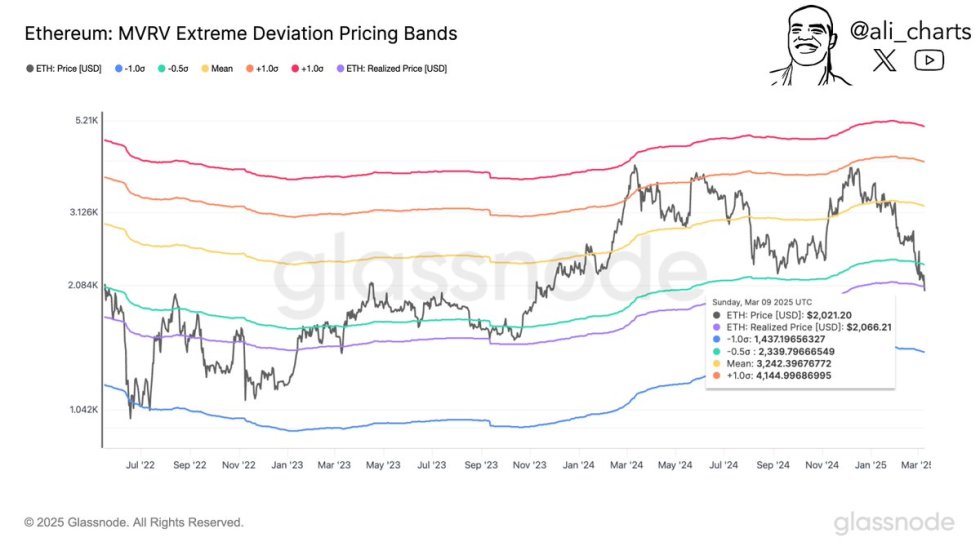
With market conditions still fragile, the next few trading sessions will be crucial in determining Ethereum’s short-term trajectory. If ETH can hold above $2,060, it may have a chance to stabilize and attempt a recovery. However, if selling pressure intensifies, the market could see Ethereum test significantly lower price levels, adding to the growing uncertainty among investors.
ETH Struggles Below $2,000
Ethereum is currently trading at $1,900, following days of heavy selling pressure that have led to significant losses. ETH has failed to hold key levels, with the price dropping as low as $1,750 just a few hours ago, marking one of its lowest points in months. With the market under continued bearish control, bulls are now racing to reclaim the $2,000 mark in an effort to stabilize price action and shift momentum toward a potential recovery phase.
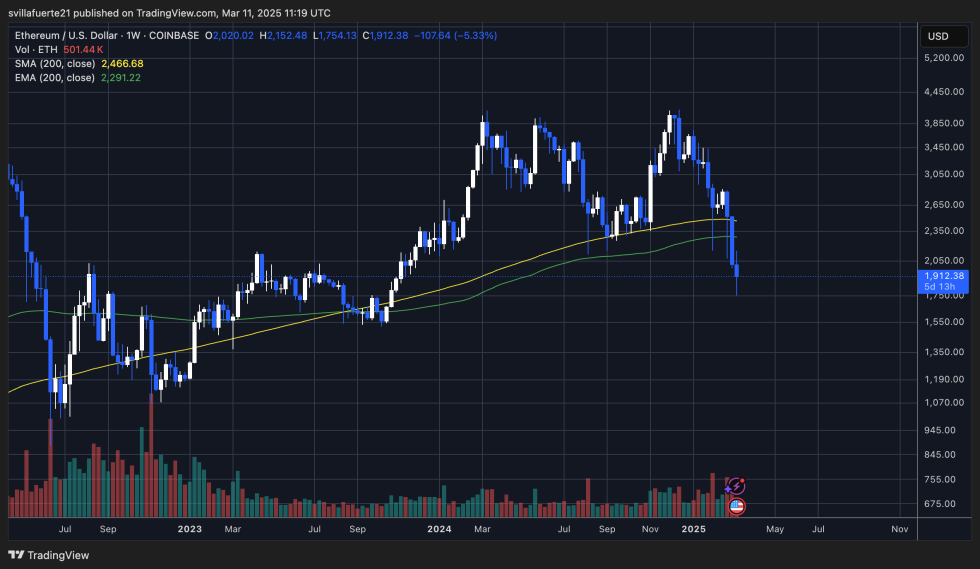
For Ethereum to regain strength, it must hold above current levels and push past $2,000 quickly. A break above this key resistance zone would indicate renewed buying interest, reducing selling pressure and allowing ETH to attempt a more sustained recovery. However, if ETH fails to reclaim $2,000, the market is likely to see a continuation of the downtrend, with further declines expected.
With Ethereum in a fragile position, the next few days will be crucial in determining whether bulls can step in to reverse the trend or if ETH will slide into deeper correction territory. Traders are closely watching price movements, as Ethereum remains at risk of further downside if key levels are not regained.
Featured image from Dall-E, chart from TradingView
Editorial Process for bitcoinist is centered on delivering thoroughly researched, accurate, and unbiased content. We uphold strict sourcing standards, and each page undergoes diligent review by our team of top technology experts and seasoned editors. This process ensures the integrity, relevance, and value of our content for our readers.

Reason to trust
![]()
Strict editorial policy that focuses on accuracy, relevance, and impartiality
Created by industry experts and meticulously reviewed
The highest standards in reporting and publishing
Strict editorial policy that focuses on accuracy, relevance, and impartiality
Morbi pretium leo et nisl aliquam mollis. Quisque arcu lorem, ultricies quis pellentesque nec, ullamcorper eu odio.
The cryptocurrency market is facing a seemingly never-ending decline, with Ethereum (ETH) and Dogecoin (DOGE) leading the losses among large-cap digital assets. This correction comes as the broader market sentiment turns bearish and cautious while Bitcoin (BTC) experiences persistent volatility and moves into bear market territory.
Ethereum And Dogecoin Market Cap Takes A Hit
Ethereum, the second-largest cryptocurrency by market capitalization, has recorded a significant drop in its market cap in the last 24 hours. While the price of Ethereum has declined to $1,910, its market cap has also gone down approximately 7.8%.
Related Reading
A combination of factors has contributed to this unfortunate drop in valuation, including investor caution ahead of key economic reports and ongoing bearish sentiments. While Ethereum’s trading volume seems to be the only metric in the green, jumping by 80%, liquidations persist as traders exit their positions ahead of further losses.
On a similar note, Dogecoin, the number one meme coin, has experienced steep losses in both its value and market cap. Despite its 30.5% increase in trading volume, Dogecoin’s market cap has fallen by 6.6%. This decline follows a recent surge in meme-based cryptocurrencies earlier this year, which appears to be losing momentum.
As of writing, the Dogecoin price is trading at $0.16, reflecting a deep correction of 16.8% in the last seven days and a massive 37% crash over the past month.
Notably, the decline in Dogecoin and Ethereum’s market cap is the highest in the last 24 hours, with coins in the top 10 experiencing a less than 2% drop. This massive drop in both cryptocurrencies comes as analysts confirm that Bitcoin has entered bear market territory.
Bitcoin And Altcoins Enter Bear Market
According to crypto analyst Tony Severino, Bitcoin may have entered bear market territory as the pioneer cryptocurrency faces decreasing momentum. Severino’s analysis applies the Elliott Wave Theory, which claims that the bear market for altcoins started in 2022, coinciding with Bitcoin’s Wave 5.
Related Reading
During this period, the market saw a rise in interest rates and Quantitative Tightening (QT), where central banks reduced liquidity in financial markets. Since altcoins thrive when there is excess liquidity, economic tightening has led to weak performance for these digital currencies.
Severino argues that Bitcoin’s Wave 5 lacked the usual strength of a true bull market top. Based on the Elliott Wave Theory, the fifth wave has always been weaker than the third in terms of price speed, volume, and breadth.
The analyst also referenced a textbook that explains that Wave 5 tends to be sideways and weak, often preceding the bear market as it indicates waning momentum. The overall conclusion of Severino’s analysis is that the altcoin bear market, which began more than three years ago, has never really ended since economic conditions haven’t returned to what they were before 2022.
Featured image from Unsplash, chart from Tradingview.com


- Ether dropped 9%, XRP fell 2%, and Dogecoin lost over 8% in 24 hours
- Investors react to Trump’s comments about a possible recession
- The US stock market lost more than $1.7 trillion in value
Crypto prices have fallen across the board, with Bitcoin dropping below $77,000 as investors continued to react to US President Donald Trump’s tariff policies and the Bitcoin reserve plan.
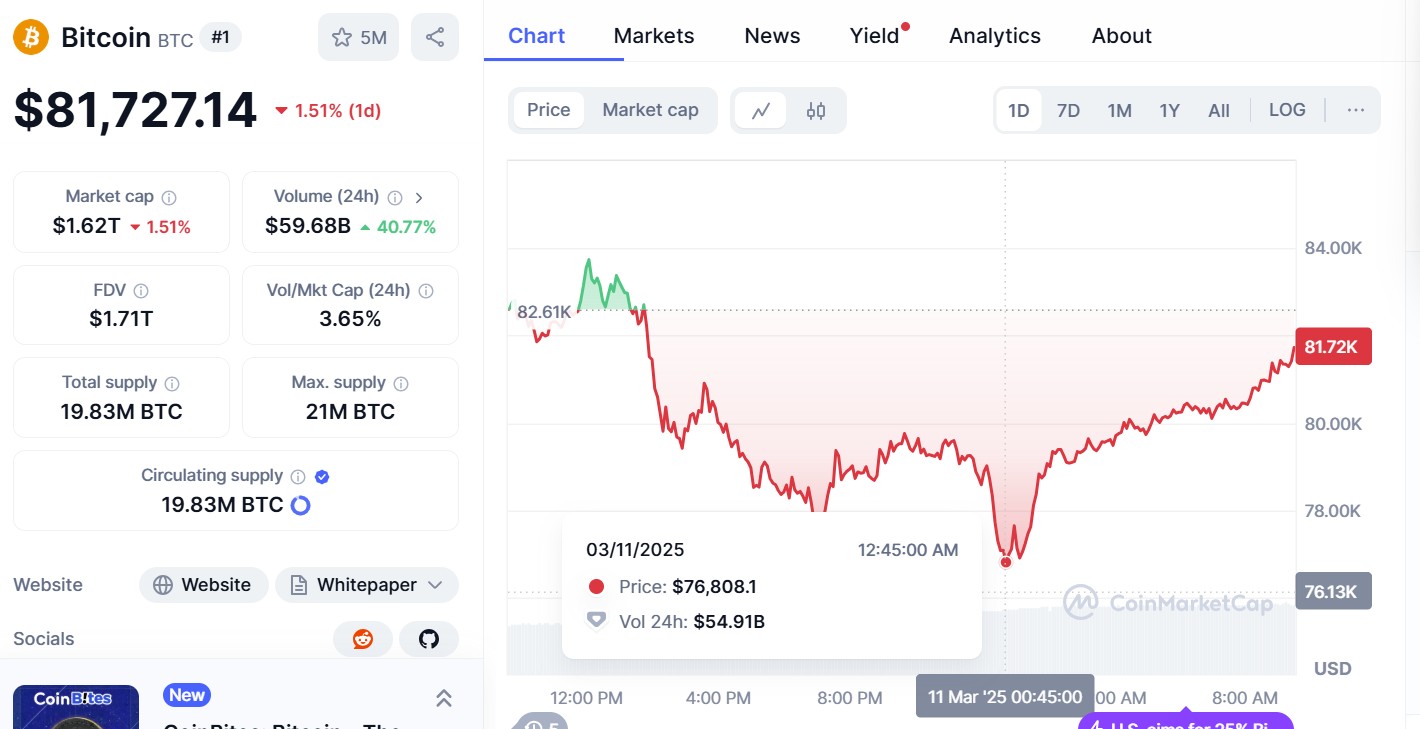
In the early hours of Tuesday, March 11, Bitcoin fell to $76,000, a figure not seen since last September. In a post on X, crypto trader Ali said:
“If #Bitcoin $BTC holds $80,000, the bull case remains strong. Losing this level, however, could put $69,000 in play as the next key support!”
If #Bitcoin $BTC holds $80,000, the bull case remains strong. Losing this level, however, could put $69,000 in play as the next key support! pic.twitter.com/PuqTrgKF0j
— Ali (@ali_charts) March 11, 2025
Bitcoin has risen slightly and is back up around $81,600 at the time of publishing, according to CoinMarketCap. Ether, on the other hand, was down over 9% in 24 hours to $1,920, XRP had fallen more than 2%, at $2.13, and Dogecoin was down over 8.81% to $0.1607.
The market reacts
News of the continued market sell-off comes as investors react to Trump’s trade tariffs, the announcement of the US Strategic Bitcoin Reserve, and the possibility of a recession.
Following Trump’s remarks, the US stock market lost more than $1.7 trillion in value yesterday. Elon Musk’s Tesla saw its shares drop by at least 15% to $222, losing over half its value from its December peak at $479.86. In a post on X, Musk said: “it will be fine long-term.”
Market conditions haven’t been helped by Trump’s trade tariffs on Canada, China, and Mexico. Last month, it was confirmed that Trump was imposing a 25% trade tariff on Canada and Mexico; however, this has been delayed until April 2. China had a 20% tariff levied against it.
BitMEX co-founder Arthur Hayes took to X to ask people to be “patient.”
“$BTC likely bottoms around $70k. 36% correction from $110k ATH, v normal for a bull market,” adding:
“Traders will try to buy the dip, if you are more risk averse wait for the central banks to ease then deploy more capital. You might not catch the bottom but you also won’t have to mentally suffer through a long period of sideways and potential unrealised losses.”

Crypto Market Fear Grows as Trump Announces New Tariffs

BTC Brushes $83K, XRP Jumps 7%, & KAS Adds 16%

Bitcoin Price Recovers Some Losses—Is a Full Rebound in Sight?

SEC Delays XRP and Solana ETF Approvals
Solana (SOL) Plunges 38% In a Month

Will Ethereum Price Crash Below $1,500 Before Market Rebound

2.52 Million Altcoins Are Ruining Crypto’s Future

Animoca Brands Valuation Tanks 75% In Two Years, Here’s Why

Crypto exchange BingX hacked for $43 million

Are The Big Players Losing Interest?

Hong Kong’s Securities Association Tips Authorities On Crypto Self-Regulation

Coinbase cbBTC Set to go Live on Solana
2.52 Million Altcoins Are Ruining Crypto’s Future
Animoca Brands Valuation Tanks 75% In Two Years, Here’s Why
Crypto exchange BingX hacked for $43 million
Are The Big Players Losing Interest?
Hong Kong’s Securities Association Tips Authorities On Crypto Self-Regulation
Coinbase cbBTC Set to go Live on Solana
-

 Market19 hours ago
Ethereum Price Turns Bearish Below $2,000—More Losses Ahead?
-

 Ethereum18 hours ago
Bitcoin drops to $76k after Trump fails to rule out a recession
-

 Market24 hours ago
Bitcoin Plunges Below $80,000 Amid Rising US Recession Fears
-
 Market18 hours ago
Arbitrum Buyback Plan Arrives Ahead of Major ARB Token Unlock
-

 Market17 hours ago
Analyst Says Only Buy XRP If It Reaches This Level
-
 Altcoin16 hours ago
Wake-Up Call for Meme Coin Investors?
-

 Market22 hours ago
Base’s GrokCoin Endorsement Ignites Tensions with Developers
-

 Market16 hours ago
Bitcoin’s Potential Bottom: Expert Predictions