
Ethereum
Ethereum Holdings Balloon To 30%

The past few months have seen Ethereum whales, the cryptocurrency world’s Goliaths, flexing their financial muscles. According to a recent report by Santiment, on-chain data reveals a surge in whale activity, possibly fueled by the green light for spot Ethereum exchange-traded funds (ETFs) from the US Securities and Exchange Commission (SEC).
Related Reading
A Whale Of A Time: Accumulation Anchors Ahead
The SEC’s surprise approval on May 23rd of 19b-4 forms for ETF applications from heavyweights like BlackRock and Fidelity stirred the cryptoverse nest. This long-awaited decision, following months of radio silence from regulators, seems to have been the harbinger of a buying spree for Ethereum’s biggest players.
Santiment’s report dives deep, revealing a nearly 30% increase in holdings by wallets containing at least 10,000 ETH over the past 14 months. This translates to a staggering 21 million ETH, currently valued at a cool $83 billion, scooped up by these deep-pocketed investors.
With Ethereum even surpassing Bitcoin in terms of percentage gains last month, it’s no surprise that the accumulation party shows no signs of stopping.
Profit Feast Before The Main Course?
The data suggests a recent uptick in whale transactions exceeding $100,000 and a whopping $1 million, reaching year-to-date highs after the ETF approval. This surge in activity could be interpreted as whales taking advantage of the bullish sentiment to lock in some profits.
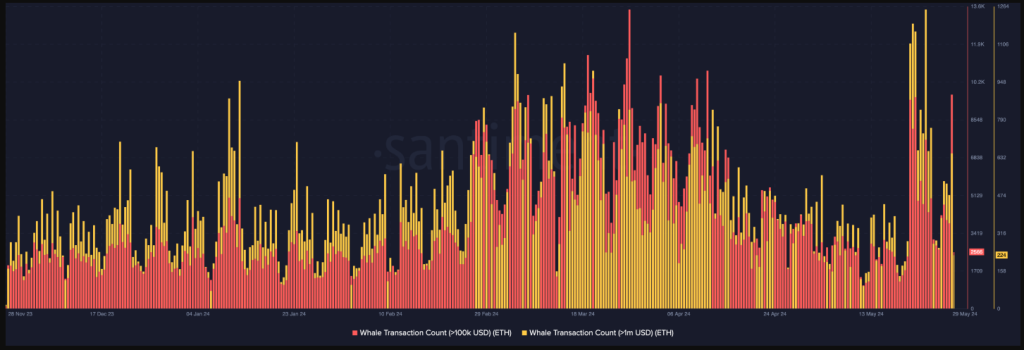
However, Santiment suggests this might be a strategic pit stop before diving back into the buying pool. As long as these “10K+ ETH wallets are still moving north,” the report argues, Ethereum’s price has the potential to continue outperforming its bigger brother, Bitcoin, even amidst market volatility.
Profitable Seas For Ethereum Sailors
The good news extends beyond whale activity. An analysis by NewsBTC revealed a positive trend in daily Ethereum transactions. Measured over a seven-day moving average, the ratio of profitable transactions to those ending in a loss sits at a healthy 1.87. This indicates that for every losing trade, there are nearly two winning ones, suggesting a wave of optimism among Ethereum investors.
Ethereum Price Prediction
Meanwhile, the predicted yearly low Ethereum price projection for 2025 is $ 3,716, based on the historical price patterns of Ethereum and the BTC halving phases. According to predictions, Ethereum’s price could rise to $6,722 in the upcoming year.
Related Reading
At the moment, the price projection for Ethereum in 2025 ranges from $3,716 on the low end to $6,722 on the high side. If ETH hits the higher price objective, Ethereum’s value might increase by 80% by 2025 compared to its current value.


Reason to trust
![]()
Strict editorial policy that focuses on accuracy, relevance, and impartiality
Created by industry experts and meticulously reviewed
The highest standards in reporting and publishing
Strict editorial policy that focuses on accuracy, relevance, and impartiality
Morbi pretium leo et nisl aliquam mollis. Quisque arcu lorem, ultricies quis pellentesque nec, ullamcorper eu odio.
Ethereum is currently trading at a critical resistance level as bulls attempt to regain momentum and push for a fresh high. The broader market remains under pressure as global uncertainty escalates, largely fueled by ongoing trade tensions between the United States and China. Last week, US President Donald Trump announced a 90-day tariff pause on all countries except China, intensifying concerns about an extended trade conflict that could destabilize global financial markets.
Related Reading
In this high-stakes environment, Ethereum’s price action is drawing close attention from investors and analysts. Top crypto analyst Ali Martinez shared that historically, the best Ethereum buying opportunities have emerged when the price drops below the lower MVRV (Market Value to Realized Value) Price Band—a level that signals potential undervaluation. Notably, ETH is now trading precisely in that zone.
This alignment between technical conditions and macroeconomic instability suggests that Ethereum could be entering a phase of accumulation, with long-term investors looking to capitalize on discounted prices. However, sustained upward momentum will depend on whether bulls can overcome immediate resistance and whether macro conditions improve. The coming days could prove pivotal for ETH as it tests both technical and psychological thresholds.
Ethereum Dips Into Historical Opportunity Zone
Ethereum is currently trading below key resistance levels after enduring several weeks of selling pressure and weak market performance. Since losing the crucial $2,000 support level, ETH has fallen roughly 21%, a clear indication that bulls have yet to regain control. Broader macroeconomic pressures, especially rising global tensions and uncertain trade conditions between the US and China, have further dampened market sentiment. These conditions have driven many investors to exit riskier assets like cryptocurrencies, leading to elevated volatility and reduced market participation.
Despite this downtrend, some analysts believe Ethereum could be nearing a pivotal turnaround zone. According to Martinez, one of the best historical signals for Ethereum accumulation has been price action dipping below the lower bound of the MVRV Price Band—a metric that compares market value to realized value to assess whether an asset is over- or undervalued. Currently, Ethereum is trading beneath that lower band.
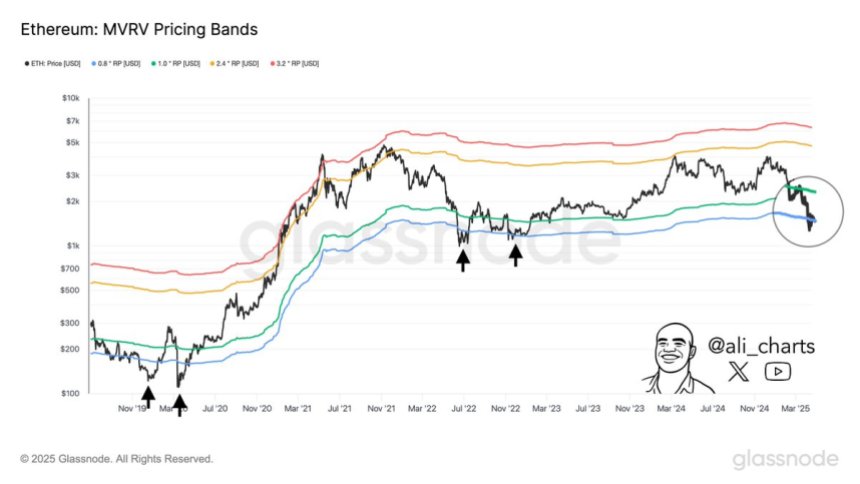
Martinez emphasizes that this positioning has typically preceded strong upside reversals, especially during periods of extreme market pessimism. While short-term volatility may persist, ETH’s entry into this zone could present a rare opportunity for long-term investors to accumulate at historically discounted levels—if market conditions stabilize and sentiment shifts.
Related Reading
ETH Stalls In Tight Range
Ethereum is currently trading at $1,610 after nearly a week of low volatility and sideways action. Since last Tuesday, ETH has remained locked in a tight range between $1,550 and $1,630, reflecting the market’s uncertainty and hesitation to take a clear directional stance. This narrow trading zone highlights a period of price compression, often a precursor to a larger move in either direction.
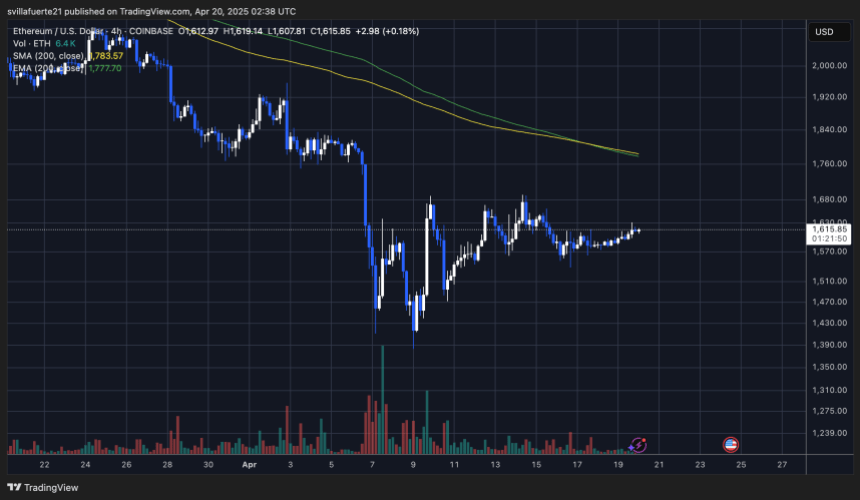
For bulls to regain momentum and shift sentiment, Ethereum must reclaim the $1,700 level and push decisively above the $2,000 mark. These levels not only serve as key psychological barriers but also represent critical zones of previous support that have now turned into resistance. A breakout above $2,000 would likely trigger renewed buying interest and set the stage for a potential recovery rally.
Related Reading
However, if bearish pressure builds and the $1,550 floor is breached, Ethereum could quickly test the $1,500 support zone. A breakdown below that level would confirm further downside risk, potentially accelerating sell-offs and deepening the current correction. Until a breakout or breakdown occurs, traders should prepare for more consolidation and volatility as the market awaits a macro or technical catalyst.
Featured image from Dall-E, chart from TradingView


Ethereum has staged an impressive comeback, surging 21% from its $1,380 low to current levels following a week of intense selling pressure. The rally began last Wednesday, triggered by a major geopolitical development: US President Donald Trump announced a 90-day pause on reciprocal tariffs for all countries except China, which now faces a steep 145% tariff. The announcement injected a wave of optimism across global markets, with Ethereum among the top beneficiaries.
Related Reading: Bitcoin Whales Haven’t Made Their Exit Yet – Is The Bull Cycle Still Intact?
Despite this bullish recovery, ETH remains below critical resistance levels, and the broader price structure continues to form a consolidation pattern. The market now awaits confirmation of whether this rebound will evolve into a full reversal or simply a relief rally amid continued macroeconomic uncertainty.
Crypto analyst Ali Martinez shared a technical chart on X, highlighting that Ethereum is currently consolidating within a symmetrical triangle on the hourly chart. According to Martinez, this pattern typically signals an imminent breakout, and if ETH breaks upward, it could trigger a 17% move to the upside.
As traders and investors watch closely, Ethereum’s next directional move will likely depend on both technical confirmations and broader sentiment around US-China trade tensions and their impact on risk assets.
Ethereum Faces Critical Resistance Amid Macroeconomic Uncertainty
Ethereum is trading at a pivotal resistance level that could determine the next major move in the market. After rebounding 21% from its $1,380 low, ETH now sits just below key levels that, if reclaimed, could spark a broader recovery rally. Despite this strong bounce, macroeconomic tensions remain in focus, with ongoing uncertainty around US tariffs and foreign policy—especially the 145% tariff on China—keeping investors cautious.
The crypto market, like equities, continues to be shaped by global developments. While some analysts believe Ethereum has already priced in the worst of the downturn, others argue that the recent rally is only a temporary relief within the early stages of a broader bear market. The debate reflects the current state of sentiment: mixed and driven more by short-term reactions than long-term conviction.
However, from a technical standpoint, Ethereum may be setting up for a decisive move. According to Martinez, ETH is currently consolidating within a symmetrical triangle on the hourly chart. This pattern often precedes a breakout, and Martinez suggests that a 17% move could follow. If Ethereum breaks to the upside, it could push the price back toward the $2,000 level—a psychological and technical milestone for the asset.

For now, all eyes are on whether bulls can maintain momentum and breach the upper trendline of the triangle. A strong breakout could signal a shift in the broader market narrative, transforming current consolidation into the foundation for a sustained rally. Still, given the unstable macro environment, traders remain cautious, watching for confirmation before fully committing to a bullish thesis.
ETH Bulls Face Key Resistance Ahead
Ethereum is trading at $1,670 after briefly setting a fresh 4-hour high around $1,691—slightly above the previous peak. This minor breakout signals that bullish momentum is building, but it remains fragile. To confirm a full reversal and begin a true recovery rally, ETH must reclaim the $1,875 level, which aligns with both the 4-hour 200-day moving average (MA) and the exponential moving average (EMA).
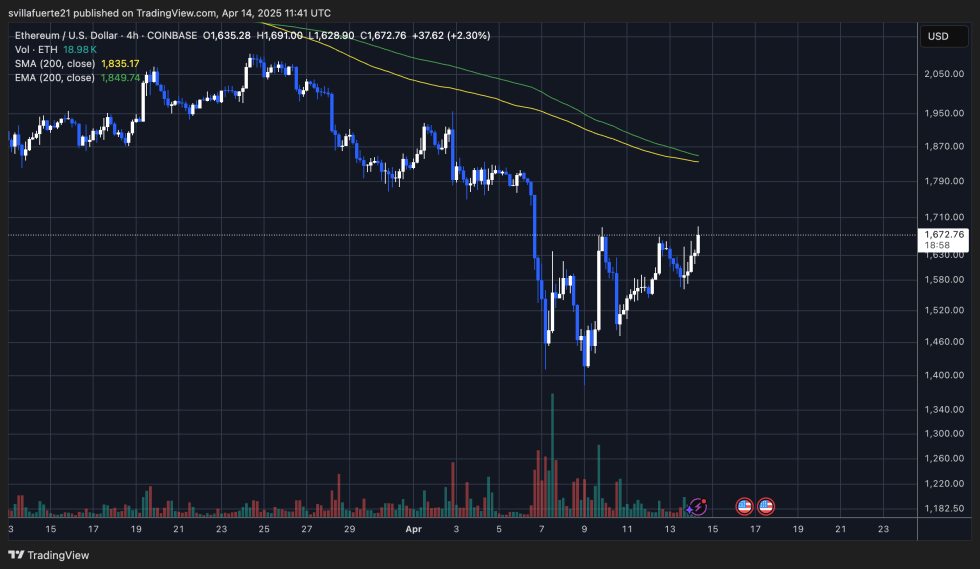
These indicators have acted as strong dynamic resistance throughout Ethereum’s recent downtrend, and only a decisive break above them would validate bullish control and potentially trigger a surge back toward the $2,000 level. A move past $1,875 would also indicate a shift in short-term market structure, giving bulls the confidence needed to drive higher highs.
However, if Ethereum fails to push through this critical resistance zone, the asset risks returning to lower demand levels. A rejection at these moving averages could send ETH back to $1,500 or even lower, especially if broader market sentiment deteriorates. With macroeconomic uncertainty and tariff-related volatility still looming, bulls need to act fast—or risk losing the progress made during this recovery attempt. For now, all eyes are on the $1,875 threshold.
Featured image from Dall-E, chart from TradingView
Editorial Process for bitcoinist is centered on delivering thoroughly researched, accurate, and unbiased content. We uphold strict sourcing standards, and each page undergoes diligent review by our team of top technology experts and seasoned editors. This process ensures the integrity, relevance, and value of our content for our readers.

Compared to other major crypto assets in the market, Ethereum’s price performance is still lagging, and it has been unable to make any significant upward move in months. Given the prolonged waning price performance, on-chain data shows that a substantial portion of ETH investors are currently in the red.
ETH Realized Price Nears Breaking Point
FundingVest, an on-chain data analyst and verified author, revealed that Ethereum’s market dynamics have reached a decisive moment. In the post on the X (formerly Twitter) platform, FundingVest highlighted that ETH’s accumulation addresses are now at a pivotal juncture as the altcoin’s realized price teeters on a critical make-or-break level.
After navigating the ETH Realized Price For Accumulation Addresses metric, it appears that the asset has broken below the cost basis of accumulation wallet addresses. This make-or-break moment is likely to determine whether Ethereum experiences more selling pressure that would shake the network’s faith or regain its upward momentum.
Presently, ETH is trending under the realized price of long-term holders, a crucial level that usually serves as solid support for the altcoin in bullish cycles. One thing is certain: When the price falls below the long-term holders’ realized price, caution is advised, as this development might lead to significant losses in the future. Meanwhile, a quick reclaim above this level hints at a potential bullish reversal in price.
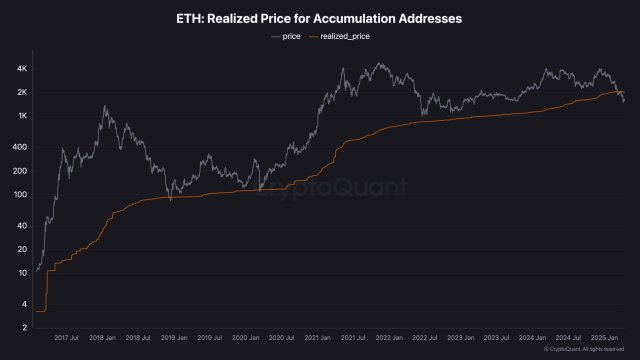
According to the expert, this indicates mounting strain on wallets that amassed significant wealth between the 2020 and 2021 market cycles. Dips below the long-term holders’ realized price are uncommon and frequently brief in the past.
However, persistent weakness in the zone can point to a more significant change in the market. With ETH’s current market price dropping below the average cost basis of these accumulators, this raises questions about its sustainability and prospects.
ETH Supply In Profit Drops Below Levels Of Past Bear Market
ETH continues to face bearish pressure, limiting its potential for a major price rally. This persistent downward movement led to a historic low in the percentage of Ethereum supply in profit, indicating a weak market sentiment.
Crypto analyst and trader Venturefounder reported that the ETH percentage supply in profit has fallen to 40%. According to the expert, this level is lower than the last bear market cycle bottom, around 42% when the altcoin was trading at the $800 mark.
Considering the sharp drop, Venturefounder claims it is already a clear signal to deploy. Although the drop in supply profit calls for alarm, there is still a positive side to the development, especially if it falls to about 30%. Should it ever reach 30%, which is the green zone on the chart, the expert noted that it will create generational buy opportunities for investors.
Venturefounder also revealed in another post that the ETH Realized Price Multiple has declined to its last cycle bottom level. The expert considers this drop another on-chain buy signal for the altcoin.
Featured image from Pixabay, chart from Tradingview.com
Editorial Process for bitcoinist is centered on delivering thoroughly researched, accurate, and unbiased content. We uphold strict sourcing standards, and each page undergoes diligent review by our team of top technology experts and seasoned editors. This process ensures the integrity, relevance, and value of our content for our readers.

XRP Futures Traders Increase Bets on Upside

Optimism, Aztec, and Huma Finance

Solana Staking Cap Surpasses Ethereum, But Is This Sustainable?

Dollar Dips While Bitcoin Hits New Heights

Ethereum Price Clings to Support—Upside Break Could Trigger Rally

Expert Reveals Why BlackRock Hasn’t Pushed for an XRP ETF

2.52 Million Altcoins Are Ruining Crypto’s Future

Animoca Brands Valuation Tanks 75% In Two Years, Here’s Why

Crypto exchange BingX hacked for $43 million

Are The Big Players Losing Interest?

Hong Kong’s Securities Association Tips Authorities On Crypto Self-Regulation

Coinbase cbBTC Set to go Live on Solana
2.52 Million Altcoins Are Ruining Crypto’s Future
Animoca Brands Valuation Tanks 75% In Two Years, Here’s Why
Crypto exchange BingX hacked for $43 million
Are The Big Players Losing Interest?
Hong Kong’s Securities Association Tips Authorities On Crypto Self-Regulation
Coinbase cbBTC Set to go Live on Solana
-
 Market21 hours ago
1 Year After Bitcoin Halving: What’s Different This Time?
-

 Market22 hours ago
VOXEL Climbs 200% After Suspected Bitget Bot Glitch
-

 Market20 hours ago
Tokens Big Players Are Buying
-

 Market19 hours ago
Dogecoin Defies Bullish Bets During Dogeday Celebration
-
 Altcoin23 hours ago
Binance Traders Go Big On Dogecoin—Majority Holding Long Positions
-

 Market17 hours ago
Will XRP Break Support and Drop Below $2?
-

 Market23 hours ago
How Token Launch Frenzy Is Delaying 2025 Altcoin Season
-
 Altcoin19 hours ago
Expert Predicts Pi Network To Reach $5 As Whales Move 41M Pi Coins Off Exchanges