
Ethereum
Ethereum FUD Spikes After 13% Price Drop: Bottom Signal?


Data shows the sentiment around Ethereum (ETH) has recently soured on social media, something that could actually help the coin reverse its price.
Ethereum Positive/Negative Sentiment Has Declined Recently
According to data from the analytics firm Santiment, traders on social media have become bearish toward Ethereum following the price drawdown. The indicator of relevance here is the “Positive/Negative Sentiment,” which tells us about whether the social media users are bullish or bearish toward a given coin.
The metric works by going through the major social media platforms to filter for posts/threads/messages that contain at least one mention of the asset. It then puts these posts through a machine-learning model to determine whether the comments are positive or negative.
Finally, the indicator takes the ratio between the two types of posts, in order to represent a ‘net’ situation for traders as a whole. This metric’s value being greater than 1 implies positive posts outpace the negatives ones, while it being under the mark suggests a bearish sentiment is held by the majority.
Now, here is the chart shared by the analytics firm that shows the trend in the Ethereum Positive/Negative Sentiment over the last few months:

Looks like the value of the metric has slipped under the 1 level in recent days | Source: Santiment on X
As displayed in the above graph, the Ethereum Positive/Negative Sentiment witnessed some very large spikes during the last couple of months of 2024. The peak of the metric during that period corresponded to positive comments outweighing negative ones by more than three times.
The overwhelming bullish sentiment was a result of the sharp rally that ETH observed alongside the rest of the cryptocurrency sector. Interestingly, the run ran out of steam not too long after optimism spiked among the social media users.
This pattern of the ETH price moving contrary to the expectations of the majority has actually been witnessed time and again, not just for ETH, but digital assets in general.
From the chart, it’s visible that with the bearish price action that has followed in the last couple of months, the Positive/Negative Sentiment has seen a notable cooldown.
After the latest continuation of the decline, that has taken Ethereum under the $2,000 level, the indicator’s value has dropped below the neutral 1 mark, indicating the traders on the social media platforms now believe in a bearish outcome for the asset.
As mentioned before, though, it’s been a historical pattern that the coin’s price tends to go opposite to the crowd’s opinion. Thus, in this view, the dominance of fear on social media could be something that can help ETH attain a bottom.
It only remains to be seen, however, whether the current sentiment is negative enough for this effect to take hold, or if the mood will have to worsen still for a rebound to occur.
ETH Price
At the time of writing, Ethereum is floating around $1,900, down more than 13% in the last seven days.
The trend in the price of the coin during the last month | Source: ETHUSDT on TradingView
Featured image from Dall-E, Santiment.net, chart from TradingView.com
Editorial Process for bitcoinist is centered on delivering thoroughly researched, accurate, and unbiased content. We uphold strict sourcing standards, and each page undergoes diligent review by our team of top technology experts and seasoned editors. This process ensures the integrity, relevance, and value of our content for our readers.


Reason to trust
![]()
Strict editorial policy that focuses on accuracy, relevance, and impartiality
Created by industry experts and meticulously reviewed
The highest standards in reporting and publishing
Strict editorial policy that focuses on accuracy, relevance, and impartiality
Morbi pretium leo et nisl aliquam mollis. Quisque arcu lorem, ultricies quis pellentesque nec, ullamcorper eu odio.
Ethereum is trading above the $1,600 mark after a turbulent period marked by heightened volatility and growing uncertainty surrounding global trade policies. As US President Donald Trump’s tariff measures continue to shake investor sentiment, crypto markets have struggled to find direction. Ethereum, like the broader market, is attempting to stabilize after weeks of aggressive selling pressure and macroeconomic headwinds.
Related Reading
Despite signs of weakness, bulls are now trying to regain control. However, price action still suggests the downtrend may not be over yet. ETH must reclaim key levels to confirm short-term momentum for any meaningful recovery to unfold. Until then, caution dominates the market outlook.
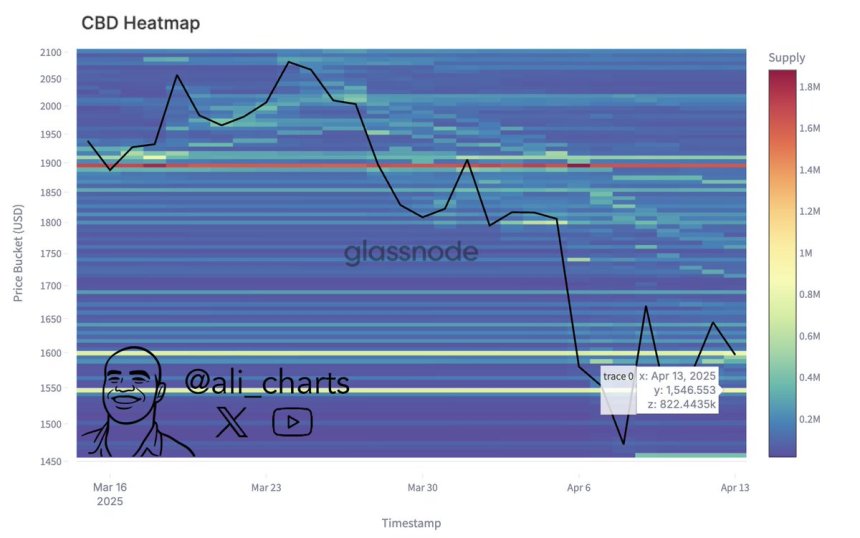
Glassnode data provides a hopeful perspective for Ethereum bulls. According to on-chain metrics, the most critical support level currently sits at $1,546.55—where whales accumulated over 822,440 ETH. This level could serve as a strong foundation for a bounce if tested again, as historically, zones with heavy accumulation tend to attract renewed buying interest.
The coming days will be crucial for Ethereum’s trajectory. Holding above this support while pushing into higher resistance could be the catalyst needed to reignite bullish sentiment and reverse recent losses.
Ethereum Tests Key Resistance As Bulls Eye Recovery
Ethereum has surged more than 20% since last Wednesday’s low near $1,380, generating renewed optimism among investors hoping for a broader market recovery. Currently trading around key resistance levels, ETH appears to be forming a base for a potential breakout that could mark the beginning of a new upward phase. However, the path forward remains uncertain as global macroeconomic conditions continue to weigh heavily on market sentiment.
Growing speculation of a policy shift following US President Donald Trump’s announcement of a 90-day tariff pause for all countries except China sparked the recent surge. This decision triggered a temporary risk-on sentiment across global markets, with cryptocurrencies benefiting from the momentum. Still, concerns about long-term US foreign policy and lingering trade tensions have left many investors cautious.
While some analysts believe that Ethereum has already priced in the worst of the selloff, others warn that we may only be in the early stages of a broader bear cycle. Despite the divergence in outlooks, on-chain data suggests that a major support level has formed.
According to analyst Ali Martinez, the most critical support for Ethereum sits at $1,546.55—an area where more than 822,440 ETH were previously accumulated. This level is being closely monitored as a potential pivot zone. If bulls can maintain price action above this threshold and successfully push through current resistance, it could trigger a strong continuation rally and restore confidence in the altcoin market.
Until then, Ethereum remains at a crossroads, with the next move likely to be shaped by a combination of market momentum, geopolitical developments, and investor conviction.
Related Reading
ETH Price Struggles at Resistance: Bulls Must Reclaim $1,875
Ethereum is trading at $1,630 after setting a fresh 4-hour high around $1,691, slightly above the previous local peak. The short-term price structure suggests that bulls are trying to regain momentum, but the recovery remains uncertain without a clear breakout above key resistance levels. For Ethereum to confirm a true reversal and enter a bullish recovery phase, it must reclaim the $1,875 level — a zone that aligns with both the 4-hour 200-day moving average (MA) and exponential moving average (EMA).
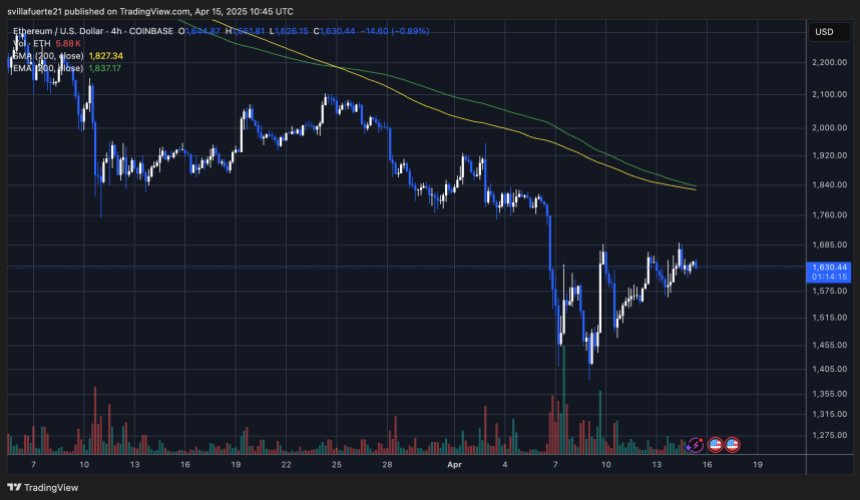
This critical level has acted as a major barrier since the downtrend began, and breaking above it would signal a shift in trend and market sentiment. However, failing to push beyond this range could send ETH back to retest the $1,500 support zone or even lower.
Related Reading
The $1,600 level now acts as a key psychological and technical threshold. Holding above it is essential for bulls to keep short-term momentum alive and prevent another sharp selloff. As macroeconomic uncertainty and market volatility continue, Ethereum’s next move depends heavily on whether bulls can defend current support and build enough strength to break above the $1,875 resistance zone.
Featured image from Dall-E, chart from TradingView

The US Securities and Exchange Commission (SEC) has announced a delay in its decision regarding the approval of staking for Ethereum ETFs from asset manager Grayscale. This setback comes as the SEC awaits the confirmation of pro-crypto commissioner Paul Atkins, whose appointment has yet to be finalized.
SEC Postpones Staking Approval On Ethereum ETFs
On February 14, 2025, NYSE Arca, Inc. submitted a proposed rule change to the SEC, seeking to amend the listing and trading rules for Grayscale’s Ethereum Trust ETF and Grayscale Ethereum Mini Trust ETF to allow staking.
The proposal was published for public comment on March 3, 2025. Under the Securities Exchange Act of 1934, the SEC is required to act on such proposals within 45 days, although it can extend this period for good cause.
The original deadline for the SEC’s decision was April 17, 2025, but the Commission has now extended this timeframe to June 1, 2025, to allow for a thorough evaluation of the proposal.
In a parallel move, Fox journalist Eleanor Terret reported that the SEC is also delaying its decision on whether to permit WisdomTree and VanEck to conduct in-kind creations and redemptions for their Bitcoin and Ethereum spot ETFs until June 3, 2025.
As reported by Terret, the in-kind process allows for direct exchanges of the underlying assets—Bitcoin and Ethereum—rather than converting them into cash, which was previously mandated by the SEC under Gary Gensler’s leadership.
New Era For Crypto?
Atkins’ delayed arrival at the SEC is partly due to procedural steps that require President Trump’s approval and a formal swearing-in. While this sign-off is expected to occur soon, it has left the agency in a state of transition, with implications for the future of crypto regulation.
However, this shift in regulatory approach signals a potential turning point for the cryptocurrency industry. Under Gensler’s tenure, the SEC was criticized for its stringent, enforcement-heavy stance towards cryptocurrency, which stifled innovation and created uncertainty for many market participants.
Conversely, the anticipated arrival of Atkins, known for his pro-crypto perspective, may herald a new era of more favorable regulatory conditions.
Atkins’ position could pave the way for the approval of numerous altcoin ETFs filed by various asset managers, aimed at providing broader exposure to cryptocurrencies like XRP, Cardano, and Solana.
ETH, the second largest cryptocurrency on the market, is trading at $1,630 on Monday, up 6% on a weekly basis. On longer time frames, the token is still down 15% after the sell-off in February and March that saw the price of ETH drop towards $1,380.
Featured image from DALL-E, chart from TradingView.com
Editorial Process for bitcoinist is centered on delivering thoroughly researched, accurate, and unbiased content. We uphold strict sourcing standards, and each page undergoes diligent review by our team of top technology experts and seasoned editors. This process ensures the integrity, relevance, and value of our content for our readers.

Reason to trust
![]()
Strict editorial policy that focuses on accuracy, relevance, and impartiality
Created by industry experts and meticulously reviewed
The highest standards in reporting and publishing
Strict editorial policy that focuses on accuracy, relevance, and impartiality
Morbi pretium leo et nisl aliquam mollis. Quisque arcu lorem, ultricies quis pellentesque nec, ullamcorper eu odio.
Ethereum might be on track to facing renewed pressure, according to an interesting technical outlook. Despite short bursts of recovery attempts, the broader market structure is still trying to flip in favor of bulls, but price movement shows that the bears are still in control. Notably, a recent technical analysis posted by crypto analyst Youriverse on the TradingView platform highlights a potential sharp drop in the price of Ethereum towards $1,400 if the current downward trend continues.
Strong Rejection From Key Fibonacci Zone Hints At Persistent Resistance
Technical analysis shows that the Ethereum price chart is currently characterized by a noticeable Fair Value Gap (FVG) on the 4-hour timeframe. This interesting gap was left behind after a steep 10% drop last Sunday, marking a strong area of seller dominance.
Related Reading
This gap represents a zone of clear imbalance where selling activity outweighs buying pressure and has influenced Ethereum’s price action throughout the past seven days. Earlier last week, Ethereum retraced into this gap, reaching the midpoint, but was met with swift rejection. This swift rejection showed the intense selling pressure present within this Fair Value Gap.
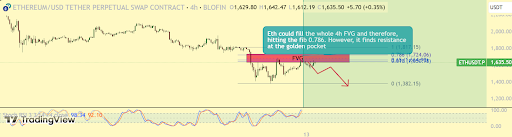
Interestingly, the Ethereum price has returned to this Fair Value Gap again, and another rejection here could send it back to a bottom below $1,400. Furthermore, Ethereum is trading within an area identified as the “golden pocket” of the Fibonacci extension indicator, which is drawn from the $1,383 bottom on April 9. Unless price action breaks decisively above this level and heads toward the next Fib level of 0.786 at $1,724, there is still a risk of a significant rejection that could lead to further downside below $1,400.
Stochastic RSI Weakness Suggests Possible Downturn Ahead For Ethereum
In addition to the Fair Value Gap and Ethereum’s struggle within the golden pocket of the Fibonacci retracement zone, the Stochastic RSI is now introducing another layer of bearish pressure to the current outlook. This momentum oscillator, which measures the relative strength of recent price movements, is approaching the overbought region on the daily timeframe.
Related Reading
Ethereum’s approach of overbought zone with the Stochastic RSI is due to inflows that have pushed the crypto’s price from the $1,383 bottom on April 9. Now that the Stochastic RSI is moving into the overbought zone, it adds to the bearish outlook that it could reject at the Fair Value Gap and start a new downside correction very soon.
So far, the Ethereum price was rejected at $1,650 in the past 24 hours, which further supports the bearish continuation thesis. If the selling pressure builds again, as suggested by both the weakening RSI and persistent resistance at the Fair Value Gap, the analyst warns of a breakdown that could drag the price to as low as $1,400, or even lower.
At the time of writing, Ethereum is trading at $1,627.
Featured image from Unsplash, chart from Tradingview.com

Bitcoin Price on The Brink? Signs Point to Renewed Decline

3 US Crypto Stocks to Watch Today: CORZ, MSTR, and COIN

Ethena Labs Leaves EU Market Over MiCA Compliance

Hedera Under Pressure as Volume Drops, Death Cross Nears

Solana (SOL) Jumps 20% as DEX Volume and Fees Soar

Ethereum Metrics Reveal Critical Support Level – Can Buyers Step In?

2.52 Million Altcoins Are Ruining Crypto’s Future

Animoca Brands Valuation Tanks 75% In Two Years, Here’s Why

Crypto exchange BingX hacked for $43 million

Are The Big Players Losing Interest?

Hong Kong’s Securities Association Tips Authorities On Crypto Self-Regulation

Coinbase cbBTC Set to go Live on Solana
2.52 Million Altcoins Are Ruining Crypto’s Future
Animoca Brands Valuation Tanks 75% In Two Years, Here’s Why
Crypto exchange BingX hacked for $43 million
Are The Big Players Losing Interest?
Hong Kong’s Securities Association Tips Authorities On Crypto Self-Regulation
Coinbase cbBTC Set to go Live on Solana
-

 Market18 hours ago
Can Pi Network Avoid a Similar Fate?
-

 Market21 hours ago
XRP Price Could Regain Momentum—Is a Bullish Reversal in Sight?
-

 Altcoin13 hours ago
Whispers Of Insider Selling As Mantra DAO Relocates Nearly $27 Million In OM To Binance
-

 Market23 hours ago
Trump’s Tariffs Spark Search for Jerome Powell’s Successor
-

 Ethereum21 hours ago
SEC Delays Decision On Staking For Grayscale’s Ethereum ETFs
-

 Market20 hours ago
Cardano Buyers Eye $0.70 as ADA Rallies 10%
-
 Bitcoin19 hours ago
Bitcoin Poised for Summer Rally as Gold Leads and Liquidity Peaks
-

 Market12 hours ago
Trump Family Plans Crypto Game Inspired by Monopoly
