
Ethereum
Ethereum Breaks Below Parallel Channel – Is ETH Collapsing To $1,250?

Ethereum has experienced a massive drop, reaching its lowest level since late November 2023. The entire market has been hit by extreme volatility, uncertainty, and aggressive price swings, with ETH losing over 20% of its value in just hours. Investors fear that this correction could extend further as Ethereum struggles to reclaim key demand levels.
Related Reading
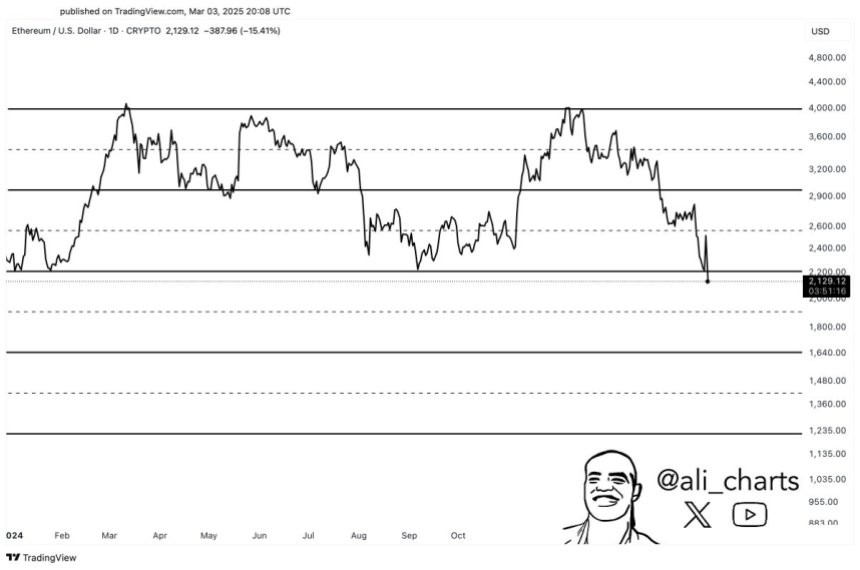
Analysts are closely monitoring Ethereum’s price action, as the next few days could determine the short-term outlook for the second-largest cryptocurrency. Top analyst Ali Martinez shared a technical analysis on X, suggesting that Ethereum is on the verge of breaking out of a parallel channel to the downside. If this push below the $2,000 mark happens, ETH could be set for a deeper correction before any recovery attempts.
Ethereum’s weakness raises concerns about the broader crypto market, as altcoins have also been hit hard during this latest sell-off. Sentiment remains bearish, and traders are waiting for confirmation of whether ETH will regain strength or continue dropping toward lower demand zones. The next few trading sessions will be crucial in determining whether Ethereum can hold above critical support or if further downside is inevitable.
Ethereum Faces More Downside Risk
Ethereum’s price action has been underwhelming as the broader crypto market struggles to find stability. Despite brief rallies and sharp declines, ETH has failed to establish a clear trend, leaving investors uncertain about its future direction. The asset has been stuck in a prolonged downtrend, consistently setting new lows and reinforcing the bearish sentiment across the market.
Currently, Ethereum is trading at bear market prices with little to no signs of a sustainable recovery. As the market structure weakens, many investors expect ETH to drop even further. Analyst Martinez has highlighted a concerning development, noting that Ethereum appears to be breaking down from a parallel channel that has contained price for months. ETH could be on track for a sharp move toward $1,250, a level that would signal a deeper market collapse.
A drop to $1,250 would not only reinforce Ethereum’s bearish outlook but also serve as a key signal for a broader market breakdown. This scenario could lead to panic selling across the board, dragging other major assets lower and confirming an extended bear market. Despite occasional price swings, Ethereum remains at a critical juncture, with bulls struggling to reclaim key support levels. Unless ETH can reclaim lost ground and establish a strong support base, the risk of further downside remains high.
Related Reading
With Ethereum failing to show strength amid market volatility, investors remain cautious, anticipating lower price levels before any meaningful recovery can take place. The coming days will be crucial in determining whether ETH can stabilize or if Martinez’s $1,250 target will become a reality, confirming the bearish outlook for the entire crypto market.
ETH Testing Critical Demand Level
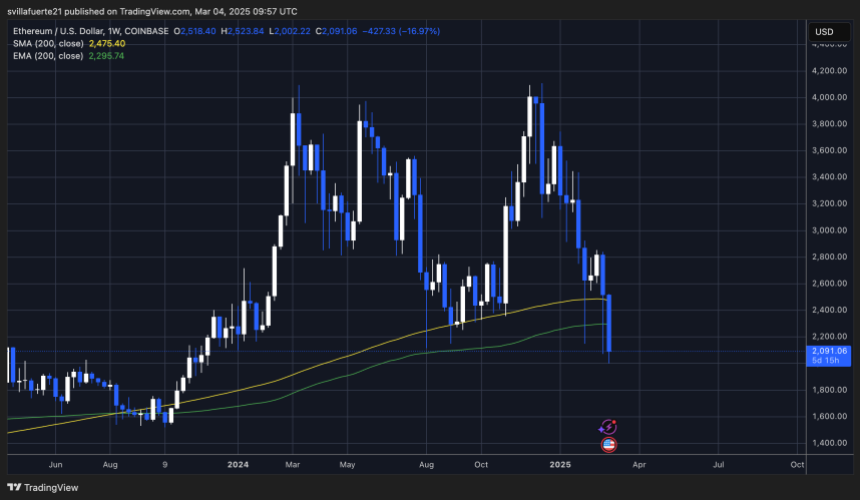
Ethereum is trading at $2,090 after a period of weak price action, marking a 30% decline since February 24. This significant drop has left investors questioning whether ETH can maintain its long-term bullish structure or if a deeper correction is imminent.
Currently, Ethereum is at a critical support level that must hold to sustain any hope of a bullish continuation. A breakdown below this level would likely confirm a bear market scenario, pushing ETH toward lower price levels as selling pressure intensifies. The uncertainty surrounding Ethereum’s price action has left traders cautious, as any further weakness could accelerate the decline.
However, a recovery remains possible if ETH can reclaim the $2,500 resistance level. Such a move would signal renewed buying momentum and could spark a strong recovery, potentially reversing the recent bearish trend. If Ethereum manages to flip $2,500 into support, it would indicate renewed confidence in the asset and set the stage for higher price targets.
Related Reading
For now, all eyes are on Ethereum’s ability to defend $2,090. The coming days will be crucial in determining whether ETH can stabilize or if the market is heading toward a more prolonged bearish phase.
Featured image from Dall-E, chart from TradingView


Reason to trust
![]()
Strict editorial policy that focuses on accuracy, relevance, and impartiality
Created by industry experts and meticulously reviewed
The highest standards in reporting and publishing
Strict editorial policy that focuses on accuracy, relevance, and impartiality
Morbi pretium leo et nisl aliquam mollis. Quisque arcu lorem, ultricies quis pellentesque nec, ullamcorper eu odio.
On-chain data shows Ethereum has broken under all major investor cost basis levels, except for one. Here’s where this price level is currently situated.
Ethereum Has Only Realized Price Of Mega Whales To Rely On Now
In a CryptoQuant Quicktake post, analyst MAC_D has discussed about where the next major support level could lie for Ethereum. The line in question is a version of the Realized Price.
The “Realized Price” is an on-chain indicator that, in short, keeps track of the average cost basis of investors belonging to a given ETH cohort. When this metric is under the spot price, it means the average member of the group is holding coins at a net loss. On the other hand, it being above the asset’s value suggests the cohort as a whole is in a state of net profit.
Related Reading
Investor cost basis is considered an important topic in on-chain analysis, as holders can be more likely to show some kind of move when their profit-loss status is challenged.
Whether investors react by buying or selling can come down to which direction the retest of their acquisition level is occurring from. When it’s from above, holders may decide to accumulate more if the atmosphere is bullish, as they can consider the pullback to be just a ‘dip.’ This provides support to the asset, thus defending their cost basis.
Similarly, investors who were underwater just prior to the retest might believe the surge wouldn’t last and they would fall back into losses again. So, they could make the decision to exit, to at least escape with their entire investment back.
A cost basis level that has shown particular importance for not just Ethereum, but digital assets in general is the Realized Price of the entire network. As the chart shared by the quant shows, this level is currently situated around $2,250 for ETH.

From the graph, it’s apparent that the line provided support to Ethereum last year, but it has failed recently as the coin’s price has significantly fallen under it. This means that the average holder on the blockchain is now sitting on a notable loss.
With this major level gone, the Realized Price of the individual cohorts could help point to where the next support could be. Here is a chart displaying the trend in the indicator for investors holding between 100 to 1,000 ETH, 1,000 to 10,000 ETH, 10,000 to 100,000 ETH, and more than 100,000 ETH:

As is visible in the graph, Ethereum has put three of the cohorts underwater with the latest crash. Now, only the largest of holders in the sector, those with over 100,000 ETH in their balance, are still in the green.
Related Reading
Back in the 2022 bear market, ETH found support at the Realized Price of these humongous whales. Thus, it’s possible that this line could once again be of relevance to ETH.
At present, the cohort has its average acquisition level at $1,290, so it will take more bearish action before a retest can take place.
ETH Price
At the time of writing, Ethereum is trading around $1,500, down more than 16% in the last 24 hours.
Featured image from Dall-E, CryptoQuant.com, chart from TradingView.com
Keshav is currently a senior writer at NewsBTC and has been attached to the website since June 14, 2021.
Keshav has been writing for many years, first as a hobbyist and later as a freelancer. He has experience working in a variety of niches, even fiction at one point, but the cryptocurrency industry has been the longest he has been attached to.
In terms of official educational qualifications, Keshav holds a bachelor’s degree in Physics from one of the premier institutes of India, the University of Delhi (DU). He started the degree with an aim of eventually making a career in Physics, but the onset of COVID led to a shift in plans. The virus meant that the college classes had to be delivered in the online-mode and with it came free time for him to explore other passions.
Initially only seeking to make some beer money, Keshav unexpectedly landed clients offering real projects, after which there was no looking back. Writing was something he had always enjoyed and to be able to do it for a living was like a dream come true.
Keshav completed his Physics degree in 2022 and has been focusing on his writing career since, but that doesn’t mean his passion for Physics has ended. He eventually plans to re-enter university to obtain a masters degree in the same field, but perhaps only to satiate his own interest rather than for using it as a means to find employment..
Keshav has found blockchain and its concepts fascinating ever since he started going down the rabbit-hole back in 2020. On-chain analysis in particular has been something he likes to research more about, which is why his NewsBTC pieces tend to involve it in some form.
Being of the science background, Keshav likes if concepts are clear and consistent, so he generally explains the indicators he talks about in a bit of detail so that the readers can perhaps come out having understood and learnt something new.
As for hobbies, Keshav is super into football, anime, and videogames. He enjoys football not only as a watcher, but also as a player. For games, Keshav generally tends towards enjoying singleplayer adventures, with EA FC (formerly FIFA) being the only online game he is active in. Though, perhaps due to being ultra-focused on the game, he is today a semi-pro on the EA FC scene, regularly participating in tournaments and sometimes even taking back prize money.
Because of his enthusiasm for anime and games, he also self-learned Japanese along the way to consume some of the untranslated gems out there. The skill didn’t merely remain as just a hobby, either, as he put it to productive use during his exploration for small-time gigs at the start of COVID, fulfilling a couple of Japanese-to-English translation jobs.
Keshav is also big into fitness, with agility and acceleration-related workouts making a big part of his program due to the relevance they have in football. On top of that, he also has a more traditional strength based program for the gym, which he does to maintain an overall fitness level of his body.
Ethereum
Ethereum Bears Loses Steam On Binance As Selling Pressure Weakens, Bulls Eyeing A Recovery?


Ethereum faced heightened selling pressure for a lengthy period due to the volatility in the broader crypto market, causing its price to undergo a sharp pullback close to the $1,400 mark. However, recent trends show that ETH seems to be entering a calmer phase as bulls are gradually taking control of the market in anticipation of a rebound.
Decreasing Ethereum Sell-Side Pressure On Binance
Although Ethereum’s price has declined sharply below key support levels, investors’ sentiment is starting to shift toward a more positive outlook. A report from Darkfost, an on-chain data and technical expert, reveals bullish behavior from investors on one of the world’s largest cryptocurrency exchanges, Binance.
As reported by Darkfost, ETH is showing early signs of a potential turnaround to a calmer phase on Binance, as selling pressure appears to be slowly fading. This suggests a decrease in the amount of ETH being offloaded by traders and investors on the platform, marking an encouraging moment for the altcoin and its price trajectory.
The drop in sell-side pressure on the crypto exchange is a sign that bears or sellers are losing control of the market after a period of intense downward movement in ETH’s price. Darfost revealed the development after a thorough examination of the Ethereum Taker Buy Sell Ratio metric on Binance.

Specifically, the taker buy-sell ratio is a key metric that compares the volume of buy orders to the volume of sell orders in the order book. Furthermore, it aids in visualizing the prevailing tendency, which appears to be changing at the moment.
A 7-day Simple Moving Average (SAM) view of the taker buy-sell ratio shows that the volume has flipped into positive territory, rising above level 1. Looking at the chart, the recent move above the level marks the third time since the beginning of this year, indicating investors’ resilience in volatile periods.
In the meantime, the easing selling pressure may act as a launchpad for price stabilization or a price recovery in the short term as bullish momentum picks up. Darkfost highlighted that it might contribute to the formation of a bottom and, at the very least, temporarily stop the bloodbath in Ethereum if the pattern persists.
However, the expert noted that the trend is still too weak to make any clear conclusions, even though it is an encouraging sign for Ethereum’s price dynamics. Thus far, Investors are closely monitoring whether bulls can take advantage of the change and propel ETH toward a short-term recovery.
ETH Breaks Out Of A Multi-Year Pattern
The easing selling pressure might have raised the possibility of ETH experiencing a rebound in the short term. However, the altcoin‘s pullback is more likely to extend after its recent drop below a key chart pattern.
Following his examination of Ethereum’s price action, Ali Martinez, a seasoned crypto analyst, has identified a massive multi-year Triangle formation, which ETH has fallen below. According to the analyst, its break below the pattern would lead to an extension of the ongoing pullback, with ETH dropping as low as $1,105 in the upcoming months.
Featured image from Unsplash, chart from Tradingview.com
Editorial Process for bitcoinist is centered on delivering thoroughly researched, accurate, and unbiased content. We uphold strict sourcing standards, and each page undergoes diligent review by our team of top technology experts and seasoned editors. This process ensures the integrity, relevance, and value of our content for our readers.

XCN Price’s Month-Long Bearishness Meets Whale Conviction
XRP Price, Traders Retreat Despite The US ETF Buzz

Bitcoin Whale Activity Peaks Amid Market Uncertainty

Ripple To Acquire Hidden Road For $1.25 Billion

Ripple Buys Hidden Road for $1.25 Billion to Boost XRP Ledger
Trump-Backed WLFI Proposes Airdrop Test for USD1 Stablecoin

2.52 Million Altcoins Are Ruining Crypto’s Future

Animoca Brands Valuation Tanks 75% In Two Years, Here’s Why

Crypto exchange BingX hacked for $43 million

Are The Big Players Losing Interest?

Hong Kong’s Securities Association Tips Authorities On Crypto Self-Regulation

Coinbase cbBTC Set to go Live on Solana
2.52 Million Altcoins Are Ruining Crypto’s Future
Animoca Brands Valuation Tanks 75% In Two Years, Here’s Why
Crypto exchange BingX hacked for $43 million
Are The Big Players Losing Interest?
Hong Kong’s Securities Association Tips Authorities On Crypto Self-Regulation
Coinbase cbBTC Set to go Live on Solana
-

 Market24 hours ago
XRP and Bitcoin Briefly Rallies After Rumors of 90-Day Tariff Pause
-

 Market23 hours ago
Is $0.415 the Key to Further Gains?
-

 Ethereum22 hours ago
Ethereum Capitulation May Be Nearing End – Will A Fed Pivot Spark A Recovery?
-

 Market21 hours ago
MANTRA Launches $108 Million RWA Fund As OM Price Surges
-

 Market20 hours ago
Crypto Whales Are Buying These Altcoins Post Market Crash
-
 Altcoin23 hours ago
Peter Schiff Predicts Ethereum Price To Drop Below $1,000, Compares It To Bitcoin And Gold
-

 Market22 hours ago
AAVE Buybacks & Key Events This Week
-

 Ethereum21 hours ago
Ethereum Bears Loses Steam On Binance As Selling Pressure Weakens, Bulls Eyeing A Recovery?