
Bitcoin
US-China Trade War Rattles Crypto – What’s Next for Bitcoin?

China recently announced a 10% tariff on US crude oil and agricultural machinery in response to US tariffs on all Chinese imports, reigniting fears of another prolonged trade war.
The ongoing trade dispute between the US and China has escalated further, triggering significant volatility in global markets, including cryptocurrencies.
Market Fallout and Crypto Reaction to US-China Trade Wars
China imposed a 15% tariff on US coal and LNG while adding a 10% levy on crude oil and farm equipment. The move comes after US President Donald Trump reintroduced aggressive trade policies to curb China’s economic influence.
While market sentiment initially soured, some analysts argue that China’s latest tariffs may not have as severe an impact as initially feared. According to The Crypto Lark Davis, China imports relatively little from the US in the affected categories.
“China imports 6% of its LNG from the USA. 4 million tons versus USA total export globally of 87 million tons in 2024. Coal the USA ships about 6% of its coal exports to China. For agricultural equipment, could not find any firm numbers so it seems to be small. This is not the equivalent of the Mexico and Canada trade disputes,” Davis explained.
Davis believes the market’s reaction may be overblown and warns against panic-driven selling. Borovik, another popular user on X, echoes this sentiment, stating that traders dumping crypto in response to the tariffs will likely regret it in 48 hours as the market stabilizes.
In contrast to the US-China tensions, a temporary trade reprieve between the US and Canada eased market concerns. As BeInCrypto reported, Trump agreed to delay tariffs on Mexico and Canada for 30 days. In return, there will be enhanced border enforcement against drug trafficking and illegal migration.
The development prompted a quick recovery for Bitcoin, which briefly reclaimed above the $100,000 milestone. This suggested that crypto markets remain highly reactive to geopolitical shifts. However, analysts remain cautious, with many expecting continued volatility as the trade war evolves.
Andrew Kang, a well-known crypto market analyst, warned that Ethereum (ETH) prices could retreat to the $2,200-$2,400 range if the trade war intensifies. As of this writing, the Ethereum price was $2,722, up by almost 8% since the Tuesday session opened.
“Back to 2200-2400 if China trade war is real,” Kang wrote.
In hindsight, over $2 billion had been wiped out from the crypto market on Monday in a historic liquidation event. Despite the panic, seasoned investor Robert Kiyosaki remains bullish on Bitcoin. He labeled the price drop a “buying opportunity,” emphasizing that crypto remains a hedge against inflation and economic instability caused by geopolitical tensions.
The historical resilience of Bitcoin and cryptocurrencies in turbulent times remains a key talking point.
Jeff Park, head of Alpha Strategies at Bitwise Asset Management, foresees Bitcoin’s inevitable rise despite short-term fluctuations. He argues that the crypto market is becoming a haven for investors seeking alternatives amid global trade uncertainty.
“Tariffs might be just a temporary tool, but the permanent conclusion is that Bitcoin is not only going higher—but faster,” Park wrote.
While the trade war introduces fresh volatility, seasoned traders highlight the importance of strategic decision-making. As the US and China continue their economic standoff, the crypto market will likely experience further swings. However, long-term holders and institutional investors may find opportunities in the chaos.
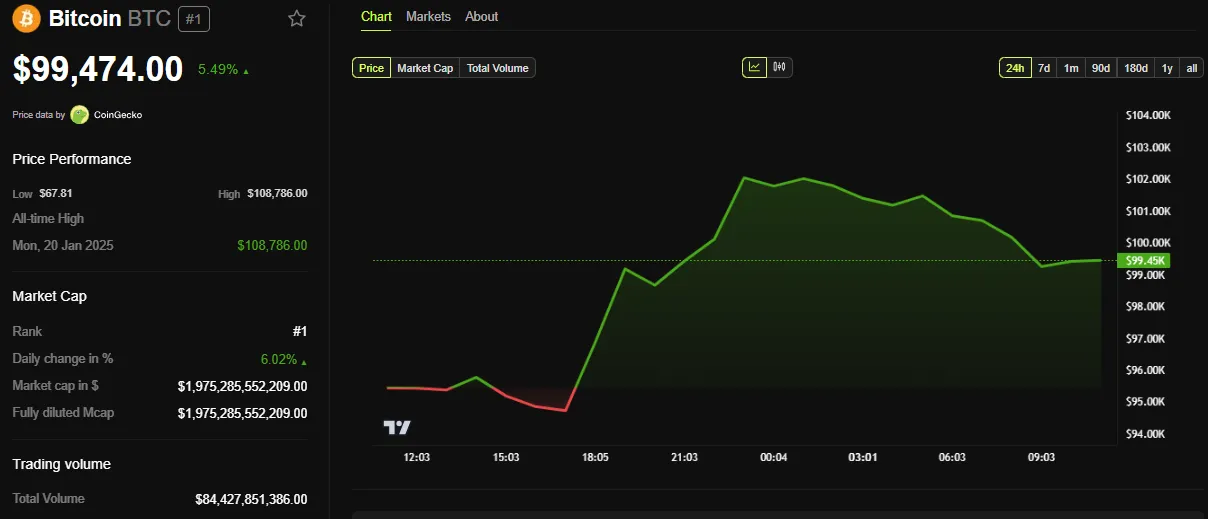
BeInCrypto data shows BTC was trading at $99,474 as of this writing, up by almost 6% since Tuesday’s session opened.
Disclaimer
In adherence to the Trust Project guidelines, BeInCrypto is committed to unbiased, transparent reporting. This news article aims to provide accurate, timely information. However, readers are advised to verify facts independently and consult with a professional before making any decisions based on this content. Please note that our Terms and Conditions, Privacy Policy, and Disclaimers have been updated.


Bolivia’s Ministry of Trade and Imports has rejected a state-backed plan to use cryptocurrency for fuel imports.
This move, which marks a stunning policy reversal, signals a retreat from the government’s recent push to adopt digital assets as a workaround for dollar shortages.
Bolivia Rejects Crypto-for-Fuel Scheme Amid Energy Sector Turmoil
The initial plan, announced in March by Bolivia’s state-owned energy giant YPFB, aimed to use crypto to secure fuel imports. This was in response to acute shortages of both US dollars and refined fuel.
As reported by Reuters on March 13, the proposal had received government backing at the time.
But in a statement released Tuesday, Director of Trade and Imports Marcos Duran clarified that YPFB will not be permitted to use crypto for international transactions.
“YPFB must use Bolivia’s own resources and dollar-based financial transfers,” Duran said.
Head of digital assets at VanEck, Mathew Sigel, labels this a clear U-turn on crypto policy.
“U-Turn: Bolivia appears to back away from its crypto-for-fuel scheme,” Sigel quipped.
Disclaimer
In adherence to the Trust Project guidelines, BeInCrypto is committed to unbiased, transparent reporting. This news article aims to provide accurate, timely information. However, readers are advised to verify facts independently and consult with a professional before making any decisions based on this content. Please note that our Terms and Conditions, Privacy Policy, and Disclaimers have been updated.

The crypto market and broader economy are moving fast as global liquidity reached an all-time high in April 2025. Gold has already broken past $3,200, setting a new record. Meanwhile, Bitcoin is still 30% below its previous peak.
Amid this backdrop, analysts are taking a closer look at the link between Bitcoin and gold. Fresh data also shows strong corporate demand for Bitcoin, with record levels of buying in Q1 2025.
What Bitcoin’s Ties to Gold and Liquidity Signal for Its Price
According to Joe Consorti, Head of Growth at Theya, Bitcoin tends to follow gold’s lead with a lag of about 100 to 150 days. A chart shared by Consorti on X, based on Bloomberg data, illustrates this trend from 2019 to April 14, 2025.
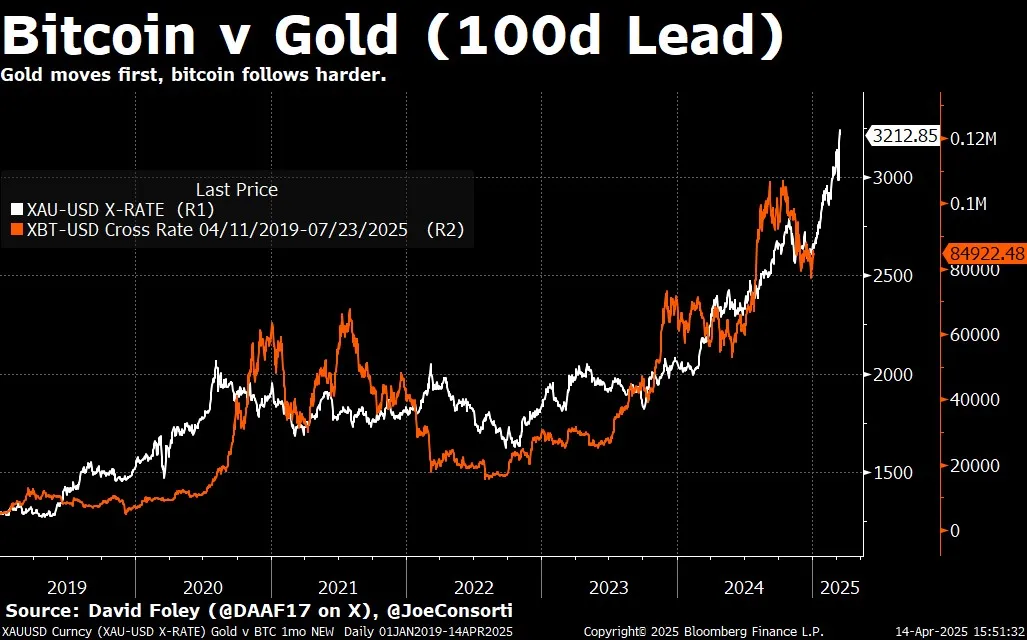
The chart shows gold (XAU/USD) in white and Bitcoin (XBT/USD) in orange. The data reveals that gold usually moves first during upswings, but Bitcoin often rallies harder afterward—especially when global liquidity is rising.
“When the printer roars to life, gold sniffs it out first, then Bitcoin follows harder,” Consorti said.
That 100-to-150-day lag is notable. It suggests Bitcoin could be set for a sharp move higher within the next 3 to 4 months. The recent surge in global liquidity also supports this view.
According to analyst Root, M2 money supply from major central banks—including the US Federal Reserve, European Central Bank (ECB), People’s Bank of China (PBoC), Bank of Japan (BoJ), Bank of England (BoE), Reserve Bank of Australia (RBA), Bank of Canada (BoC), and others—has hit a record high as of April 2025.
The sharp rise points to more cash flowing through the global economy.
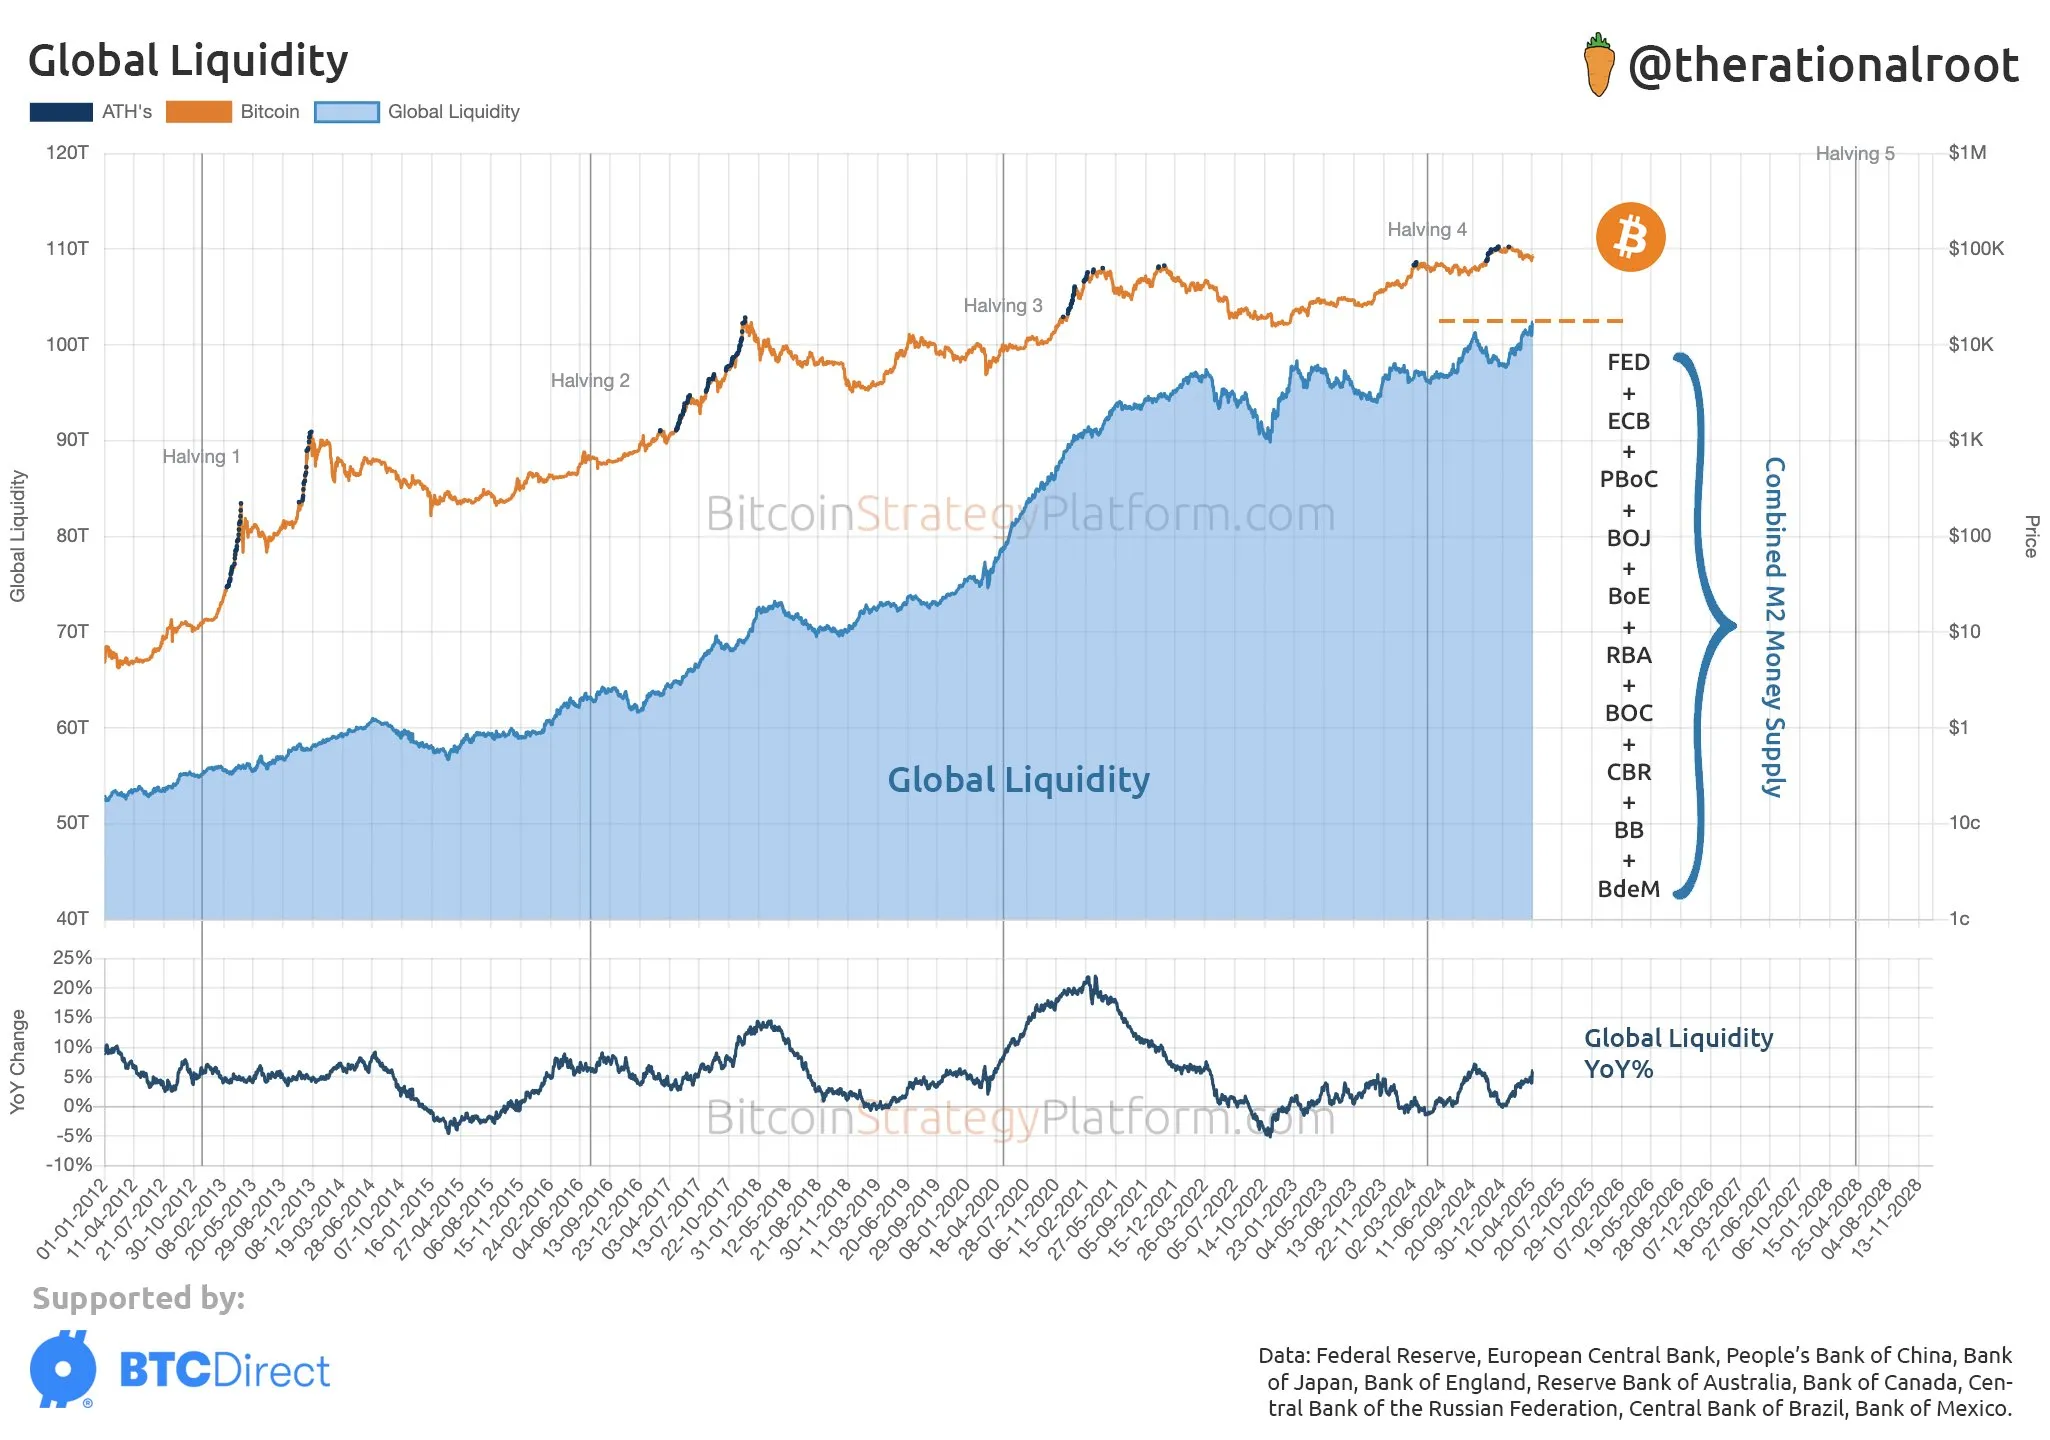
Historically, Bitcoin bull markets have often lined up with major increases in global liquidity, as more money in the system tends to push investors toward riskier assets like Bitcoin.
Why Bitcoin Might Outperform Gold and Stocks
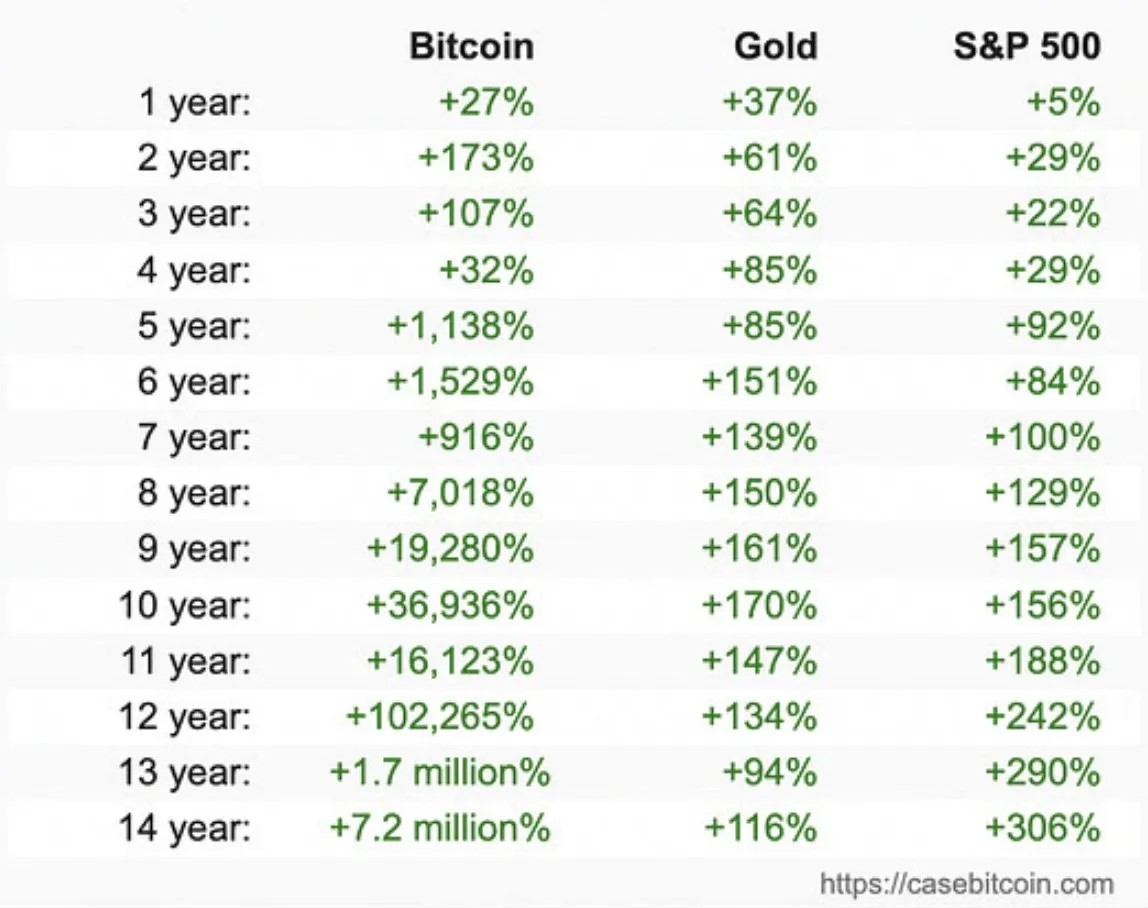
Matt Hougan, Chief Investment Officer at Bitwise Invest, states that Bitcoin is not just outperforming gold but is also surpassing the S&P 500 in the long run. This indicates that Bitcoin is becoming a stronger investment option despite its price volatility.
Data also supports this. A recent Bitwise report shows corporations bought over 95,400 BTC in Q1—about 0.5% of all Bitcoin in circulation. That makes it the largest quarter for corporate accumulation on record.
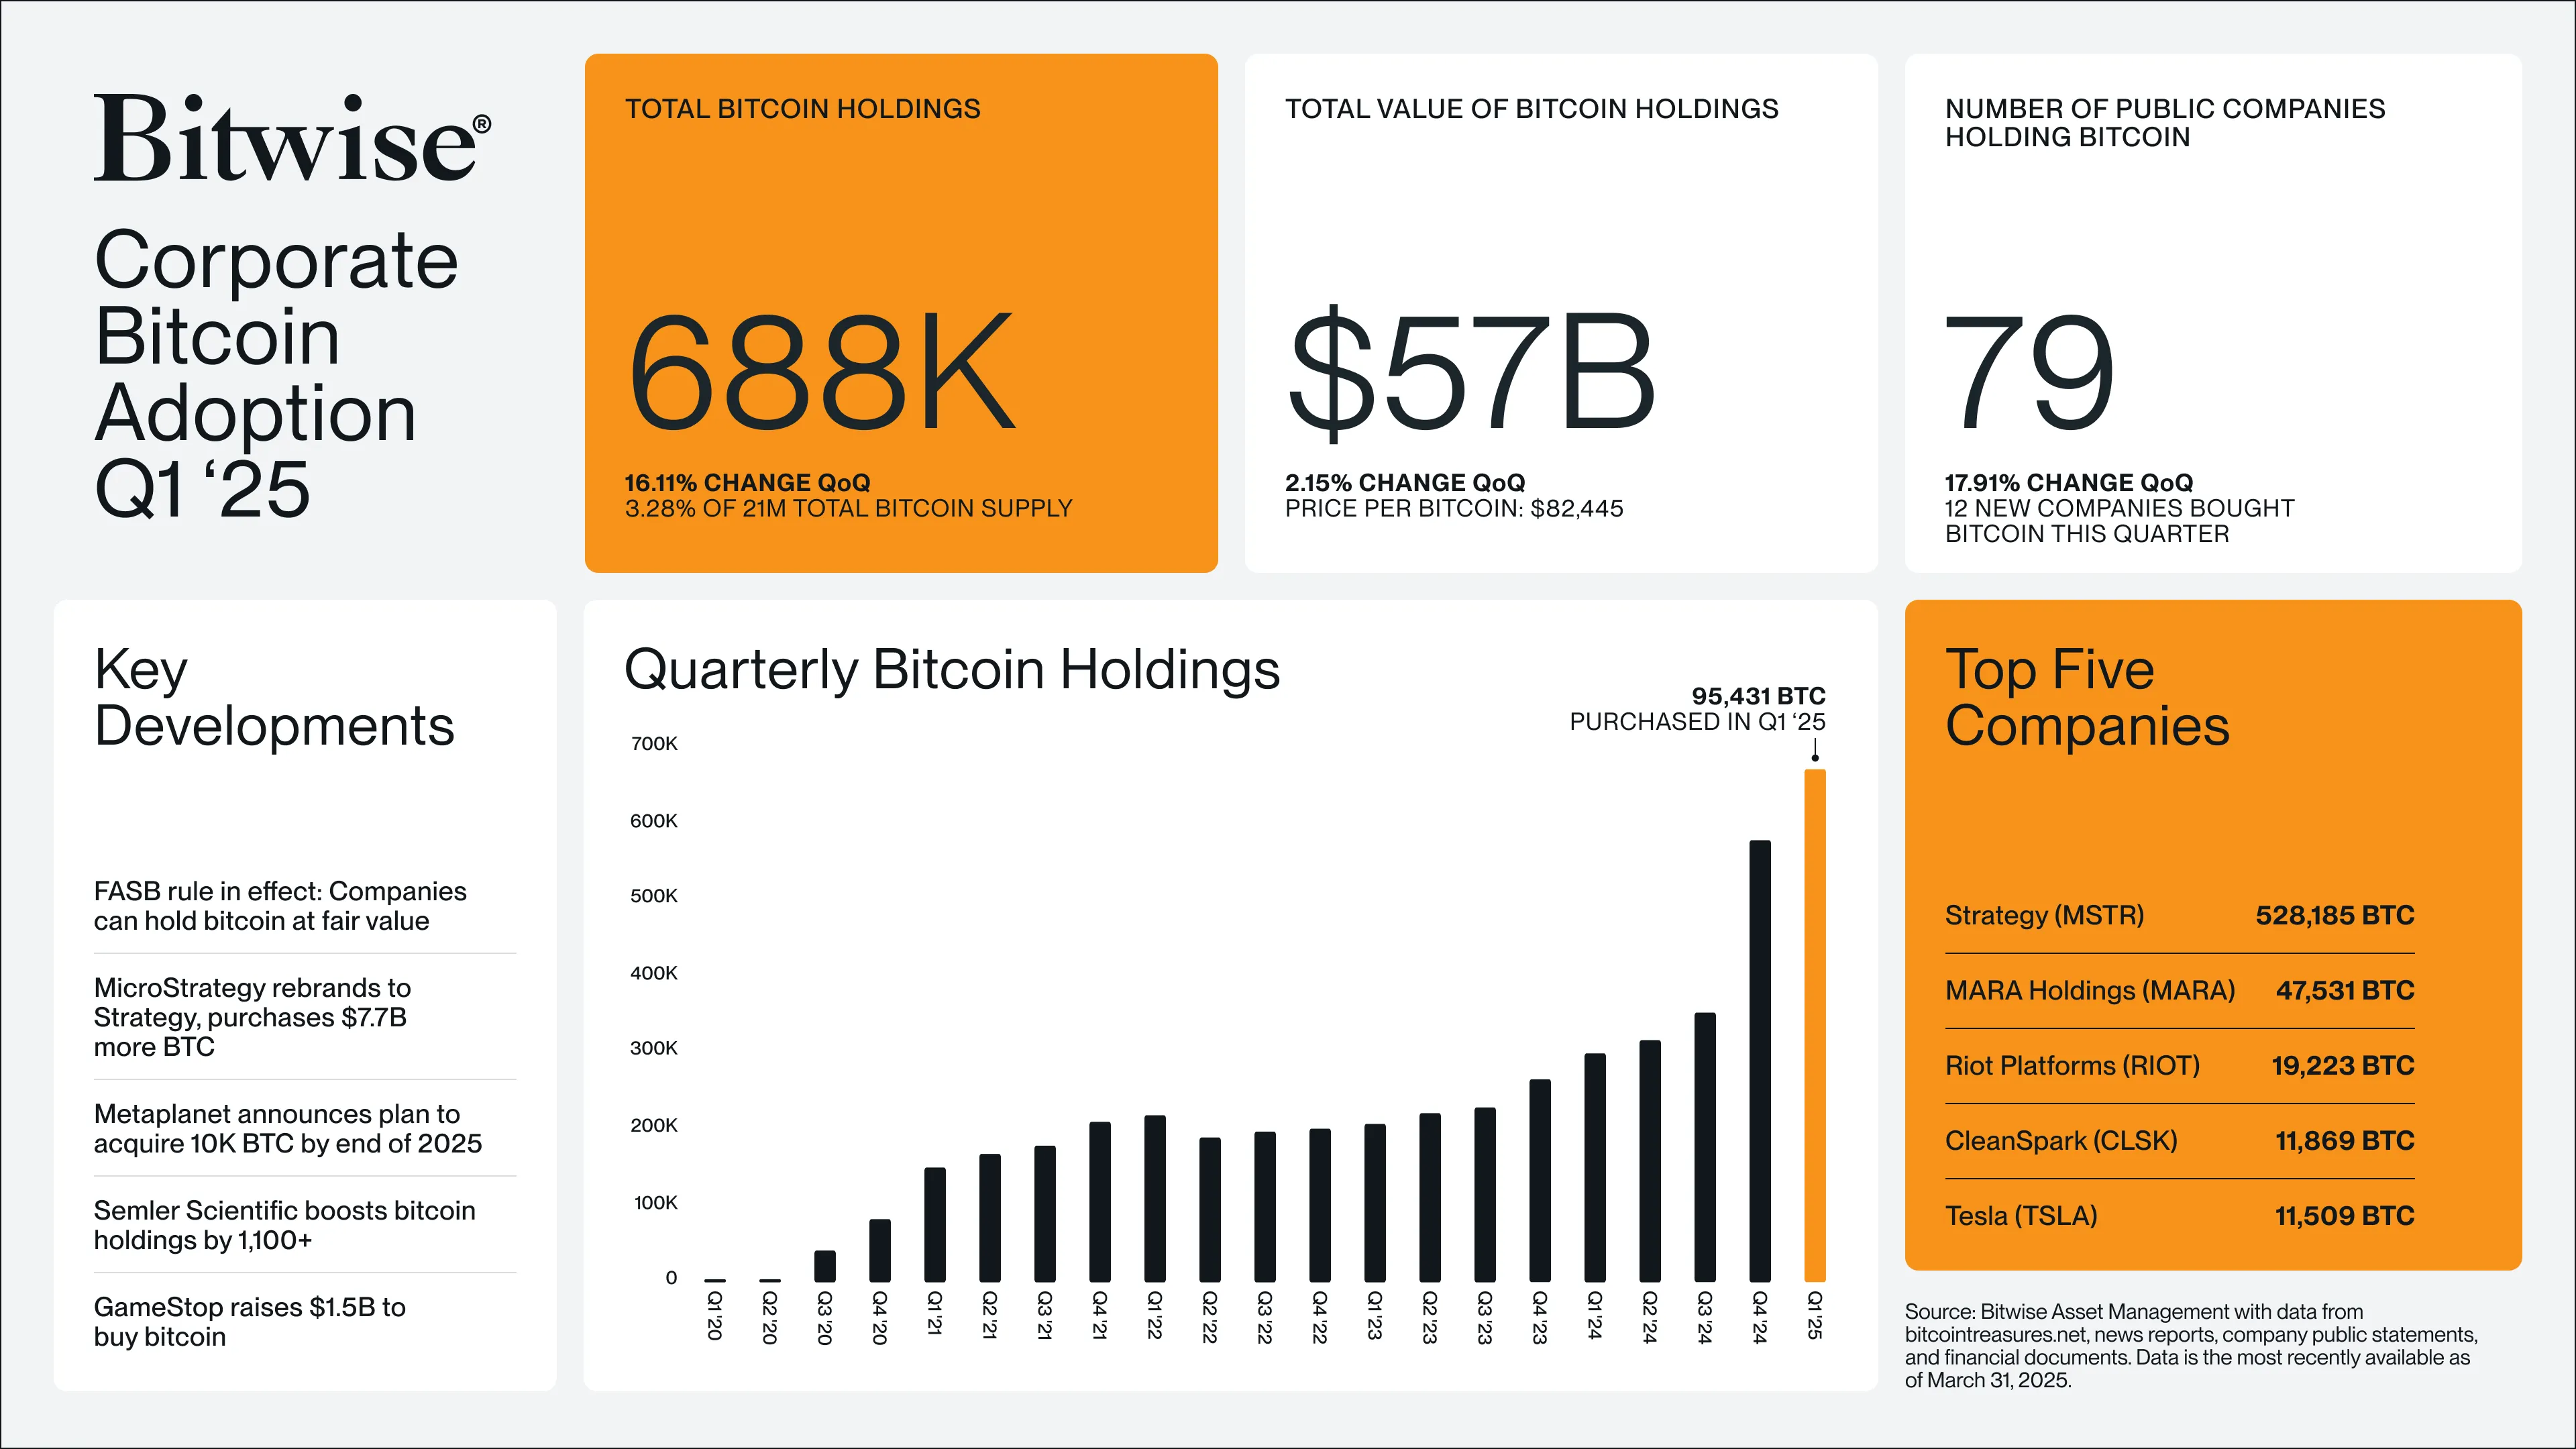
“People want to own Bitcoin. Corporations do too. 95,000 BTC purchased in Q1,” Bitwise CEO Hunter Horsley said.
With rising corporate demand and Bitcoin’s strong performance against traditional assets, the stage may be set for a major rally in summer 2025—driven by peak global liquidity and Bitcoin’s historic tendency to follow gold’s lead.
Disclaimer
In adherence to the Trust Project guidelines, BeInCrypto is committed to unbiased, transparent reporting. This news article aims to provide accurate, timely information. However, readers are advised to verify facts independently and consult with a professional before making any decisions based on this content. Please note that our Terms and Conditions, Privacy Policy, and Disclaimers have been updated.

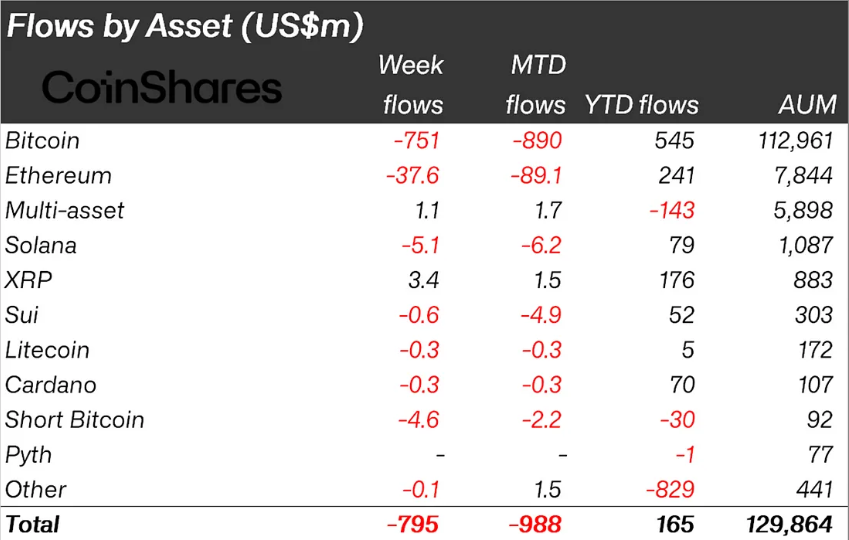
According to the latest CoinShares research, crypto outflows hit $795 million last week. This marks the third consecutive week of negative flows, as financial uncertainty continues to weigh heavy on investor sentiment.
This report aligns with the outlook for Bitcoin spot ETFs (exchange-traded funds), which saw $713 million in outflows last week, a 314% surge from the prior week’s $172.69 million.
Crypto Outflows Reached $795 Million Last Week
CoinShares’ researcher James Butterfill reveals that while Bitcoin led the outflows at $751 million, some altcoins, including XRP, Ondo Finance (ONDO), Algorand (ALGO, and Avalanche (AVAX), managed positive flows.
It suggests investors adjust their investment strategies, pivoting to altcoins as broader economic chaos bombards the Bitcoin (BTC) market.
“…recent tariff activity continues to weigh on sentiment towards the asset class,” wrote Butterfill.
This trend is not new, as altcoins have outperformed Bitcoin on flow metrics in the past. Two weeks ago, altcoins broke a five-week streak of negative flows, catapulting crypto inflows to $226 million.
Meanwhile, the influence of Trump’s tariffs on digital asset investment products has been consistent. In the week ending April 7, crypto outflows hit $240 million in the backdrop of Trump’s trade chaos.
Investor sentiment took a particularly sharp turn after President Donald Trump’s tariff pause announcement sidelined China, reigniting fears of a US-China trade war. This spooked markets across traditional and digital assets, along with China’s retaliatory move, exacerbates the sentiment.
Nevertheless, despite sidelining China, Trump’s temporary rollback of tariffs helped lift assets under management (AuM) by 8% to $130 billion, up from the lowest point seen since November 2024.
“… a late-week price rebound helped lift total AuM from their lowest point on April 8 (the lowest since early November 2024) to $130 billion, marking an 8% increase following President Trump’s temporary reversal of the economic calamitous tariffs,” Butterfill added.
Bitcoin Bleeds, ETF Flows Confirm Sentiment
As indicated, Bitcoin bore the brunt of last week’s bearish turn. Outflows surged in line with a 314% week-over-week increase in Bitcoin ETF outflows. The consistent bleed highlights that institutional interest is cooling, particularly among US-based ETF providers.
Short-Bitcoin products also suffered, with $4.6 million in outflows. This suggests traders may retreat to the sidelines entirely rather than taking leveraged bets on downside movement.
CoinShares emphasized that last week’s outflows spanned multiple regions and product providers. This signals that the bearish tone is not isolated to any one market. It aligns with broader risk-off behavior across equities and commodities in response to the volatile US trade stance.

Trump’s unpredictable tariff moves have reintroduced uncertainty into a fragile macro environment. Crypto markets, particularly institutional products, are responding with a broad withdrawal of capital.
Disclaimer
In adherence to the Trust Project guidelines, BeInCrypto is committed to unbiased, transparent reporting. This news article aims to provide accurate, timely information. However, readers are advised to verify facts independently and consult with a professional before making any decisions based on this content. Please note that our Terms and Conditions, Privacy Policy, and Disclaimers have been updated.

Could Tomorrow’s Canada Solana ETF Launch Push SOL Price to $200?

ETH Retail Traders Boost Demand Despite Institutional Outflows

Trump Family Plans Crypto Game Inspired by Monopoly

Whispers Of Insider Selling As Mantra DAO Relocates Nearly $27 Million In OM To Binance

Forget XRP At $3, Analyst Reveals How High Price Will Be In A Few Months
XRP Early Investors Continue To Sell As Price Holds Above $2

2.52 Million Altcoins Are Ruining Crypto’s Future

Animoca Brands Valuation Tanks 75% In Two Years, Here’s Why

Crypto exchange BingX hacked for $43 million

Are The Big Players Losing Interest?

Hong Kong’s Securities Association Tips Authorities On Crypto Self-Regulation

Coinbase cbBTC Set to go Live on Solana
2.52 Million Altcoins Are Ruining Crypto’s Future
Animoca Brands Valuation Tanks 75% In Two Years, Here’s Why
Crypto exchange BingX hacked for $43 million
Are The Big Players Losing Interest?
Hong Kong’s Securities Association Tips Authorities On Crypto Self-Regulation
Coinbase cbBTC Set to go Live on Solana
-

 Ethereum22 hours ago
Ethereum Price Threatened With Sharp Drop To $1,400, Here’s Why
-

 Market20 hours ago
Binance Futures Causes a Brief Crash For Story (IP) and ACT
-

 Market23 hours ago
3 Altcoins to Watch in the Third Week of April 2025
-

 Market21 hours ago
XRP Jumps 22% in 7 Days as Bullish Momentum Builds
-
 Market18 hours ago
Is The XRP Price Mirroring Bitcoin’s Macro Action? Analyst Maps Out How It Could Get To $71
-

 Market22 hours ago
Cardano (ADA) Eyes Rally as Golden Cross Signals Momentum
-
 Market19 hours ago
Ondo Finance (ONDO) Rises 3.5% Following MANTRA Crash
-

 Market15 hours ago
Bitcoin Price Eyes Bullish Continuation—Is $90K Within Reach?
