
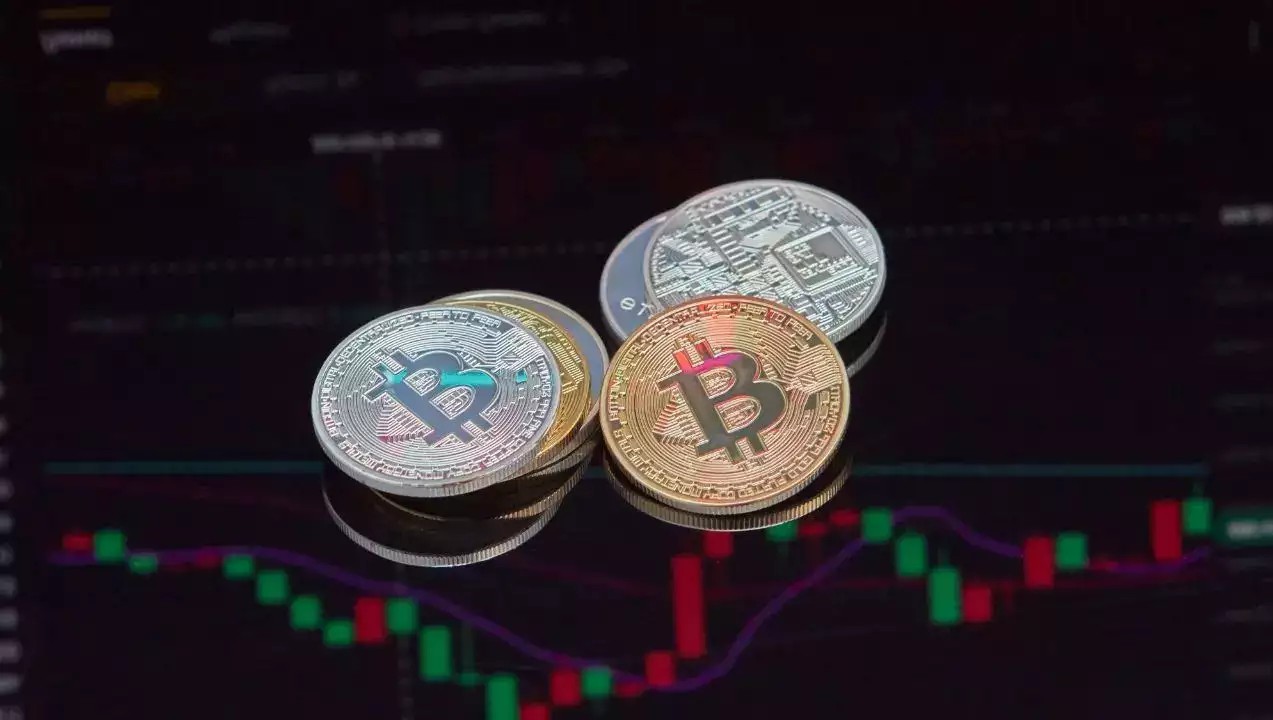
Bitcoin
Stock Market’s $1.05 Trillion Wipeout Puts To Test Bitcoin Stability

In a single day, $1.05 trillion was wiped out of the US stock market. This decline represents one of the largest of any single day in recent times and also reflects a mix of unsatisfactory economic data and huge struggles among major companies.
Investors are understandably rattled because this downturn brings up some seriously unsettling questions about the stability of this market.
Stock Market: Economic Data Drives The Decline
The Dow Jones Industrial Average plummeted more than 626 points right off the bat within the first seconds of the opening. At close, it shed more than 700 points and ended down over 2% at about 40,936.93.
This sell-off was catalyzed by weak manufacturing data, a fifth consecutive month of contraction. Investors were rattled by this news, and that eventually led to massive sell-offs across the board.
The S&P 500 also lost around 2.4% to close at approximately 5,530 points. Technology was worse hit in its period, especially Nvidia, the shares of which tumbled by 9.5%. This is the biggest one-day share fall for any American company, which erased an astonishing $279 billion off its market value.
Crude oil fell back to $72.66 a barrel, reflecting further concerns over global demand and adding to the market’s tribulations.
US Stock Market value lost $1.05 trillion today. Crypto remained relatively stable. pic.twitter.com/mO6xdCGkni
— MartyParty (@martypartymusic) September 3, 2024
Nasdaq, The Hardest Hit
The Nasdaq Composite was the weakest among the majors, falling nearly 3.5% to 17,136.30. That was its worst day since early August. Because the Nasdaq is overweight in technology stocks- even more so after the collapse of Nvidia- it sustained heavy losses.
As the tech stocks continue sliding, investors are left to guess just how much further that may last and what it could mean to the broader market.
Image: Daily Sabah
Impact On Cryptocurrencies
Curiously, as the stock market was going haywire, cryptocurrencies like Bitcoin and Ethereum somewhat remained resilient. Bitcoin shed 3% of its value, while Ethereum went below US$2,500.
History would also show that September has been the most trying month for stocks and cryptocurrencies. It usually sees increased volatility from traders who prepare for monthly economic reports and interest rate changes.
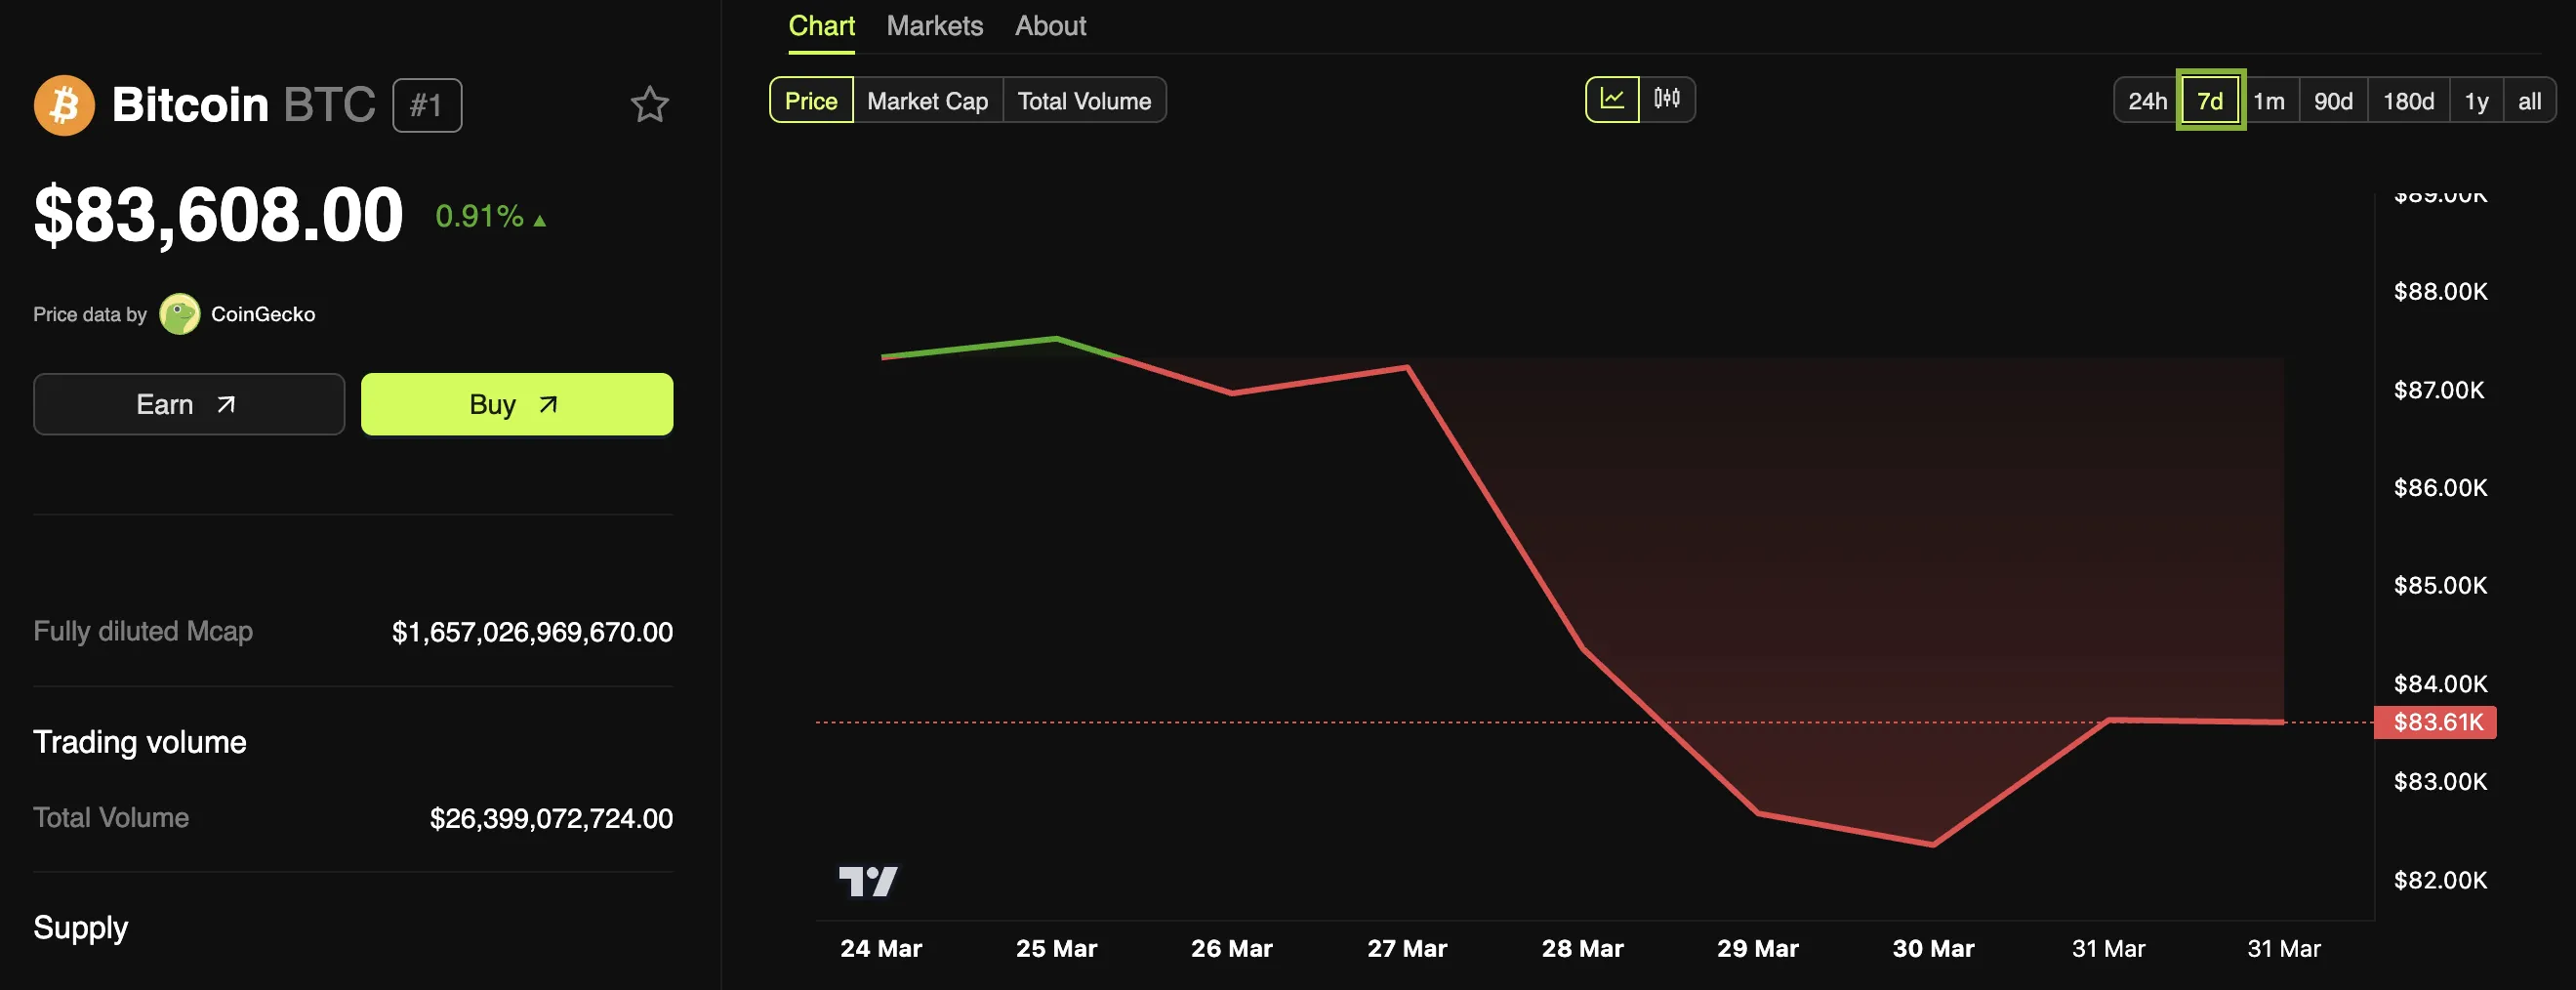
BTC market cap currently at $1.16 trillion. Chart: TradingView.com
Bitcoin Market Cap Steady
Despite the downturn these days, Bitcoin’s market capitalization is still faring healthy at around US$1.2 trillion, with a year-over-year return of 128%.
The short-term outlook is quite bleak, but some analysts cautiously say a recovery could be in the cards. They peg their optimism on the upcoming elections in the United States and the planned disbursal of $14.5 billion to FTX creditors.
However, everything depends on what is going to be reported about future economic data. In case weak reports continue, then more pain might be in store.
But what really emphasizes a higher magnitude of uncertainty is the $1.05 trillion loss the US stock market had to incur. As investors try to work their way through the ramifications brought about by weak economic data and major declines in key companies, all eyes are on the next set of reports and political affairs that come out.
Obviously, some feel a bottom, but ahead of them are challenges, and how long it will actually take for this sector to climb out of its hole is anybody’s guess.
Featured image from TipRanks, chart from TradingView


Michael Saylor, one of the most outspoken supporters of Bitcoin, is back and bolder than ever. In a recent statement, the former MicroStrategy CEO predicted that the alpha coin will potentially hit a $500 trillion market cap. Saylor’s bold prediction for the world’s top digital asset comes during the intensified push for a Strategic Bitcoin Reserve (SBR).
In his latest pro-crypto statement, Saylor argued that the digital asset will “demonetize gold”, then it will demonetize real estate, which he calculated as 10x more than gold. To summarize his argument, Saylor further states that Bitcoin will demonetize “all long-term store of value”.
Push For SBR Gains Ground
Saylor’s latest statement comes as Congress intensifies its efforts to build the country’s BTC holdings. United States President Donald Trump formalized the plans to build crypto holdings through an executive order to establish a strategic crypto reserve that will initially include $17 billion worth of BTC that the country currently controls.
Michael Saylor: Bitcoin Headed to $500 Trillion 🚀₿
– At Digital Asset Summit, MicroStrategy’s Saylor predicted:
• BTC will reach $500T market cap
• It will “demonetize gold, real estate & all long-term stores of value”
– Capital shift: “From physical to digital, from…— AFV GLOBAL (@afvglobal) March 28, 2025
According to the president, additional acquisitions of cryptocurrency are allowed, provided these are done through “budget-neutral” approaches. Senator Cynthia Lummis initially proposed in the Senate, through the Bitcoin Act, the plan to create a Bitcoin reserve. Under the proposal, the administration can purchase 1 million Bitcoin to complement the reserve.
Saylor Explains Crypto’s Role During Blockchain Summit
Saylor’s latest prediction on Bitcoin was made during his appearance at the DC Blockchain Summit. He was joined on stage by Jason Les, the CEO of Rito Platforms, and Lummis, the principal author of the Bitcoin Act.
During the program, Saylor was asked about America’s need for Bitcoin. Saylor answered with conviction, saying the rising importance of BTC is inevitable and will happen with the US’ participation. During his talk, he shared that Bitcoin, created by the enigmatic Satoshi Nakamoto, is unstoppable.
Image: Gemini Imagen
Saylor added that the premier digital asset is the next stage in money’s evolution, and it’s currently absorbing value from traditional assets like currency reserves and real estate.
Saylor Predicts Top Coin Will Reach $500 Trillion In Market Cap
During his talk, Saylor predicted that BTC will eventually grow from $2 billion to $20 billion, which can hit $200 billion and beyond. Finally, he thinks the asset can achieve a $500 trillion market capitalization, reflecting more than 29,000% increase from its current market capitalization of $1.67 trillion.
Saylor’s recent bold prediction aligns with his firm conviction and support for the asset. He argues that Bitcoin’s unique features, its decentralized nature and fixed supply, make it a perfect hedge against economic uncertainties like inflation.
Featured image from Gemini Imagen, chart from TradingView
Editorial Process for bitcoinist is centered on delivering thoroughly researched, accurate, and unbiased content. We uphold strict sourcing standards, and each page undergoes diligent review by our team of top technology experts and seasoned editors. This process ensures the integrity, relevance, and value of our content for our readers.
A top executive of Strategy, formerly MicroStrategy, posted a cryptic post on X, fueling speculation that the company might be positioning itself to make another Bitcoin acquisition soon.
Strategy Executive Chairman Michael Saylor suggested in an X post that the company would purchase additional Bitcoins to boost its current BTC holding of $42 billion.
Saylor To Buy More Bitcoin
In a typical Saylor fashion, the Strategy top honcho disclosed the company’s BTC investment portfolio tracker, an indicator that the company is planning an upcoming Bitcoin acquisition.
Needs even more Orange. pic.twitter.com/lV5qgUP6oY
— Michael Saylor⚡️ (@saylor) March 30, 2025
“Needs even more Orange,” Saylor said in the post, referring to the orange circles in the graph (below), which represents the company’s Bitcoin purchases since September 2020.
Once again, Saylor’s post intrigued the crypto community because many believe the graph conveys a message that Strategy will buy more BTC soon.

Strategy Stockpile: Over $40B BTC
According to Saylor, Strategy’s Bitcoin holding now stands at more than $42 billion. Despite the company’s already huge investment in BTC, it seems the company will continue to increase its holdings, believing in the value of crypto.
Strategy has made great strides in building its BTC reserve from its initial Bitcoin purchase of 21,454 coins worth $250 million in August 2020.
On March 17, the company announced its latest acquisition of 130 Bitcoins for about $10.7 million in cash, with an average price of around $82,981 per coin.
Meanwhile, Onchain Lens reported on Sunday that Strategy moved a considerable number of its coins to new addresses.
“Strategy (formerly MicroStrategy) transferred 7,383.25 $BTC worth $612.92M to three new addresses on March 30,” Onchain Lens said in a post.
Analysts believe the company is influencing the crypto market to strengthen its position, as its chairman has consistently urged others never to sell their Bitcoin.
Strategy (formerly #MicroStrategy) has transferred 7,383.25 $BTC worth $612.92M into 3 new addresses.https://t.co/8KVn8hYNDL pic.twitter.com/g92HZCvoLp
— Onchain Lens (@OnchainLens) March 30, 2025
Fueling BTC Adoption
Many market observers argued that Saylor’s BTC investment strategy might have driven crypto adoption. Ironically, Saylor was pessimistic about Bitcoin’s future in 2013, predicting that the flagship crypto would fail.
However, in 2020, Saylor became one of Bitcoin’s staunch advocates and has now been preaching the merits of the firstborn crypto, urging companies to acquire Bitcoin.
For example, Visa planned to let its customers spend digital assets directly at 70 million merchants. At the same time, financial institutions such as JPMorgan and Morgan Stanley have begun offering crypto investments to wealthy clients and institutional investors.
Featured image from Times Now, chart from TradingView
Editorial Process for bitcoinist is centered on delivering thoroughly researched, accurate, and unbiased content. We uphold strict sourcing standards, and each page undergoes diligent review by our team of top technology experts and seasoned editors. This process ensures the integrity, relevance, and value of our content for our readers.

Michael Saylor announced that Strategy purchased nearly $2 billion worth of Bitcoin. This is a massive leap over last week’s purchase, which was already quite substantial.
Nonetheless, the firm was only able to make this acquisition thanks to major stock offerings. Bitcoin’s price has been sinking over the last few weeks, and this could mature into a potential liquidation crisis.
Strategy Maintains Bitcoin Purchases
Since Strategy (formerly MicroStrategy) began acquiring Bitcoin, it’s become one of the world’s largest BTC holders. This plan has totally reoriented the company around its massive acquisitions, inspiring other firms to take up the same plan.
Today, the firm’s Chair, Michael Saylor, announced another purchase, much larger than the last few.
“Strategy has acquired 22,048 BTC for ~$1.92 billion at ~$86,969 per bitcoin and has achieved BTC Yield of 11.0% YTD 2025. As of 3/30/2025, Strategy holds 528,185 BTC acquired for ~$35.63 billion at ~$67,458 per bitcoin,” Saylor claimed via social media.
Strategy’s latest Bitcoin acquisition, worth just shy of $2 billion, is a major commitment. In February, the firm made a similar $2 billion purchase, and it was followed by a tiny $10 million buy and a $500 million one. The $500 million purchase, which took place on March 24, only happened thanks to a huge new stock offering. This move further cements Strategy’s faith in BTC.
By making these billion-dollar buys, Strategy is able to buttress the entire market’s confidence in Bitcoin. However, investors should be aware of a few potential cracks.
First of all, Bitcoin’s performance is a little subpar at the moment. Despite hitting an all-time high recently, Bitcoin is having its worst quarter since 2019, and there is not much forward momentum.
This could cause a unique problem for the company. Since Strategy is a cornerstone of market confidence, it is unable to offload its assets without jeopardizing Bitcoin’s price.
The firm’s debts are growing at a fast rate, and this could have dangerous implications if Bitcoin keeps falling. Strategy could be forced to liquidate, even if that seems unlikely now.
Still, it’s important to remember that these are only possible scenarios. Strategy has maintained its consistent Bitcoin investments for nearly five years, and it’s paid off tremendously well. However, if it keeps taking on billions in fresh debt obligations, this faith will turn into a gamble with very high stakes.
Disclaimer
In adherence to the Trust Project guidelines, BeInCrypto is committed to unbiased, transparent reporting. This news article aims to provide accurate, timely information. However, readers are advised to verify facts independently and consult with a professional before making any decisions based on this content. Please note that our Terms and Conditions, Privacy Policy, and Disclaimers have been updated.

Hill Rejects Interest-Bearing Stablecoins Despite Armstrong’s Wish

How Did UPCX Lose $70 Million in a UPC Hack?

Ethereum Struggles to Break Out as Bear Trend Fades

XRP Price to $27? Expert Predicts Exact Timeline for the Next Massive Surge

Binance Megadrop Launches KernelDAO
Wintermute Sells ACT Tokens Due To Binance Limit Changes

2.52 Million Altcoins Are Ruining Crypto’s Future

Animoca Brands Valuation Tanks 75% In Two Years, Here’s Why

Crypto exchange BingX hacked for $43 million

Are The Big Players Losing Interest?

Hong Kong’s Securities Association Tips Authorities On Crypto Self-Regulation

Coinbase cbBTC Set to go Live on Solana
2.52 Million Altcoins Are Ruining Crypto’s Future
Animoca Brands Valuation Tanks 75% In Two Years, Here’s Why
Crypto exchange BingX hacked for $43 million
Are The Big Players Losing Interest?
Hong Kong’s Securities Association Tips Authorities On Crypto Self-Regulation
Coinbase cbBTC Set to go Live on Solana
-

 Market24 hours ago
BlackRock’s Larry Fink Thinks Crypto Could Harm The Dollar
-

 Market23 hours ago
Coinbase Tries to Resume Lawsuit Against the FDIC
-
 Altcoin23 hours ago
Charles Hoskinson Reveals How Cardano Will Boost Bitcoin’s Adoption
-

 Market22 hours ago
Hedera (HBAR) Bears Dominate, HBAR Eyes Key $0.15 Level
-

 Market21 hours ago
This is Why PumpSwap Brings Pump.fun To the Next Level
-

 Market20 hours ago
Cardano (ADA) Whales Hit 2-Year Low as Key Support Retested
-

 Altcoin24 hours ago
Ethereum Bitcoin Ratio Drops to Record Low, What Next for ETH?
-

 Bitcoin10 hours ago
Big Bitcoin Buy Coming? Saylor Drops a Hint as Strategy Shifts