
Bitcoin
New Grayscale Bitcoin ETF Debuts with 0.15% Fee
Grayscale Investments has launched a new Bitcoin exchange-traded fund (ETF) with the lowest fee structure in the United States. The Grayscale Bitcoin Mini Trust, known by the ticker “BTC,” started trading on Wednesday on NYSE Arca.
It has a competitive fee of 0.15%, the lowest amongst all spot Bitcoin ETFs.
Grayscale Bitcoin Mini Trust Debuts on NYSE Arca
This strategic launch of the mini-trust format provides a fresh investment avenue for Bitcoin ETF investors. This new trust aims to distribute shares to existing Grayscale Bitcoin Trust (GBTC) shareholders by reallocating a portion of Bitcoin from the older fund to the mini version.
“Grayscale converted 10% of their Bitcoin ETF AUM into their new Bitcoin Mini Trust according to onchain flows,” analyst Hildobby said.
Read more: How To Trade a Bitcoin ETF: A Step-by-Step Approach
Furthermore, Grayscale has adopted this mini-fund approach for its Ethereum offering as well. In fact, this month, the US Securities and Exchange Commission (SEC) approved the Grayscale Ethereum Mini Trust (ETH), which will also soon start trading on NYSE Arca.
Both the mini versions of the Bitcoin and Ethereum products now trade under a more competitive fee structure. This approach is designed to attract investors who prioritize investment efficiency.
This move comes as the Grayscale Bitcoin Trust has experienced significant shifts, including a notable $19 billion outflow since its transition to an ETF. The outflows were mainly due to GBTC’s high fees. It charged 1.5% in fees, around 10 times higher than its competitors.
Consequently, BlackRock’s iShares Bitcoin Trust overtook GBTC to become the largest Bitcoin ETF.
“The timing is also excellent for investors. We have a Federal Reserve that is about to cut rates. Crypto has become an important topic in the US presidential election,” Zach Pandl, head of research at Grayscale, said.
Read more: Crypto ETN vs. Crypto ETF: What Is the Difference?

The US Bitcoin ETFs have grown swiftly since their inception in January. So far, they have witnessed $17.69 billion in net inflows. This influx highlights growing confidence in crypto as a viable investment class.
Disclaimer
In adherence to the Trust Project guidelines, BeInCrypto is committed to unbiased, transparent reporting. This news article aims to provide accurate, timely information. However, readers are advised to verify facts independently and consult with a professional before making any decisions based on this content. Please note that our Terms and Conditions, Privacy Policy, and Disclaimers have been updated.


The Bitcoin price seemed to be breaking out of its consolidation range early on in the week, rising to as high as $88,500 on Monday, March 24. However, the flagship cryptocurrency appears to be back to ground zero, retracing to around $84,000 on Friday, March 28.
This recent price correction came following the release of inflation data in the United States. With the latest inflation data suggesting delayed rate cuts by the US Federal Reserve, risk assets — including cryptocurrencies — experienced significant downward pressure to close the week.
Here’s How BTC Price Could Fall To $62,000
The story gets a little grim for the world’s largest cryptocurrency after popular crypto analyst Crypto Capo put forward a bearish projection for the Bitcoin price in their latest post on the X platform. According to the crypto trader, the price of BTC could be on its way to a new low in this cycle.
Crypto Capo highlighted in their analysis of the BTC 12-hour chart that the $84,000 – $85,000 is pivotal for the premier cryptocurrency’s future trajectory. The online pundit noted that the Bitcoin price action could go one of two ways over the next few weeks.
In the first scenario, Crypto Capo expects the price of Bitcoin to enjoy a short-lived bullish burst to within the $95,000 – $100,000 range. This initial price run-up would be a bull trap for investors, according to the analyst. For context, a bull trap is a pattern that lures long traders (bulls) into the market by an initial upward surge followed by a quick reversal.
Fittingly, Crypto Capo predicts that Bitcoin will experience a capitulation event that will see its value plummet to the next main support. As seen in the chart below, this next major support lies within the $62,000 – $69,000 bracket, containing the April and November all-time high prices.
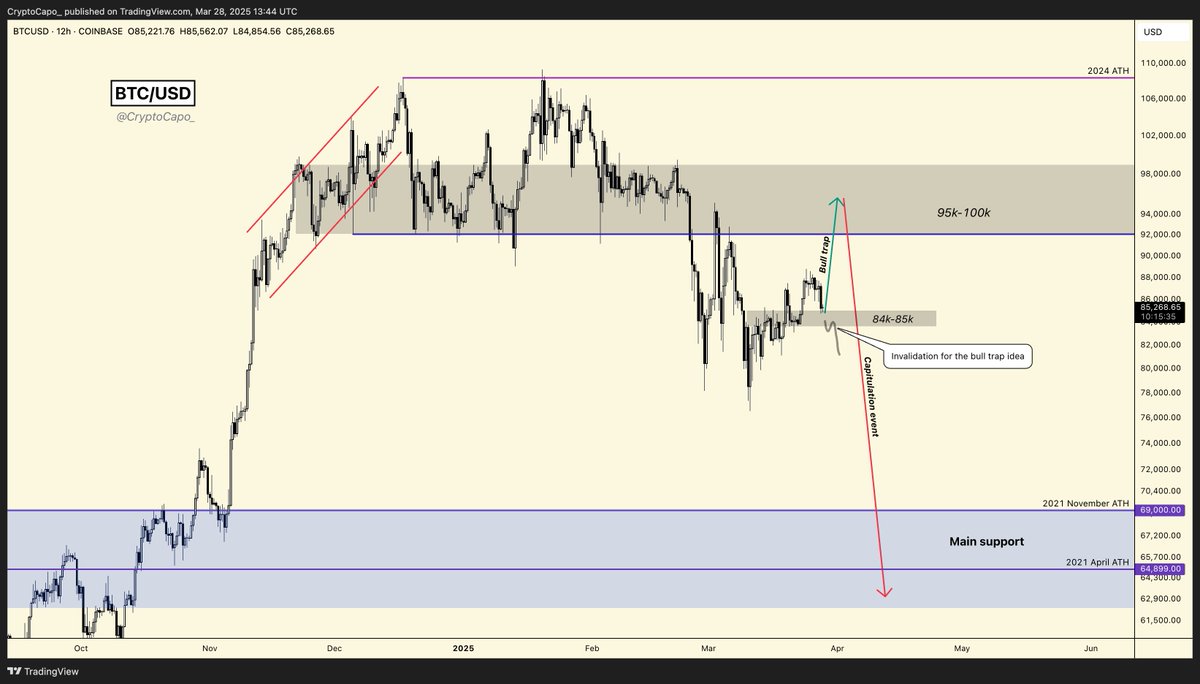
Source: @CryptoCapo_ on X
In the alternate scenario, Crypto Capo highlighted how the first bull trap idea could be invalidated. According to the trader, if the Bitcoin price successfully closes beneath the $84,000 – $85,000 range, it could fall to the $62,000 – $69,000 bracket.
Bitcoin Price At A Glance
As of this writing, the price of Bitcoin is moving around the $83,300 level, reflecting a 3% decline in the past 24 hours. This single correction event has wiped out the premier coin’s early-week profit, with CoinGecko data showing no significant gain or loss in the last seven days.
The price of BTC slides beneath $84,000 on the daily timeframe | Source: BTCUSDT chart on TradingView
Featured image created by DALL-E, chart from TradingView
Editorial Process for bitcoinist is centered on delivering thoroughly researched, accurate, and unbiased content. We uphold strict sourcing standards, and each page undergoes diligent review by our team of top technology experts and seasoned editors. This process ensures the integrity, relevance, and value of our content for our readers.
El Salvador’s President Nayib Bukele has hinted at an upcoming visit to US President Donald Trump at the White House. The move has fueled speculation about closer cooperation between the two pro-Bitcoin leaders.
Although no official agenda has been released, if confirmed, the meeting would mark Bukele as the first Western Hemisphere leader to visit Trump at the White House during his current term.
Can Bitcoin Improve Diplomatic Relationship Between US and El Salvador?
On March 28, Bukele reacted to a report claiming that Trump plans to invite him to Washington.
Responding on social media, Bukele confirmed his willingness to visit and jokingly noted that he would bring “several cans of Diet Coke” — a nod to Trump’s well-known beverage of choice.
The two leaders have enjoyed a friendly relationship since Trump’s return to office. They reportedly spoke after the inauguration, and Trump later thanked Bukele publicly, commending his “understanding of this horrible situation” regarding US border issues.
Meanwhile, the possible visit follows El Salvador’s acceptance of deported Venezuelan gang members from the US.
These individuals were held at the country’s high-security Terrorism Confinement Center. The facility was recently visited by US Homeland Secretary Kristi Noem.
President Bukele’s administration has earned international praise — and criticism — for its tough stance on crime. His crackdown on gangs has transformed El Salvador from one of the most violent nations in the world to one of the safest in Latin America.
Meanwhile, speculation is growing within the crypto community that Bitcoin may emerge as a significant topic during the leaders’ discussions. Both Bukele and Trump have openly supported Bitcoin, though their approaches differ slightly.
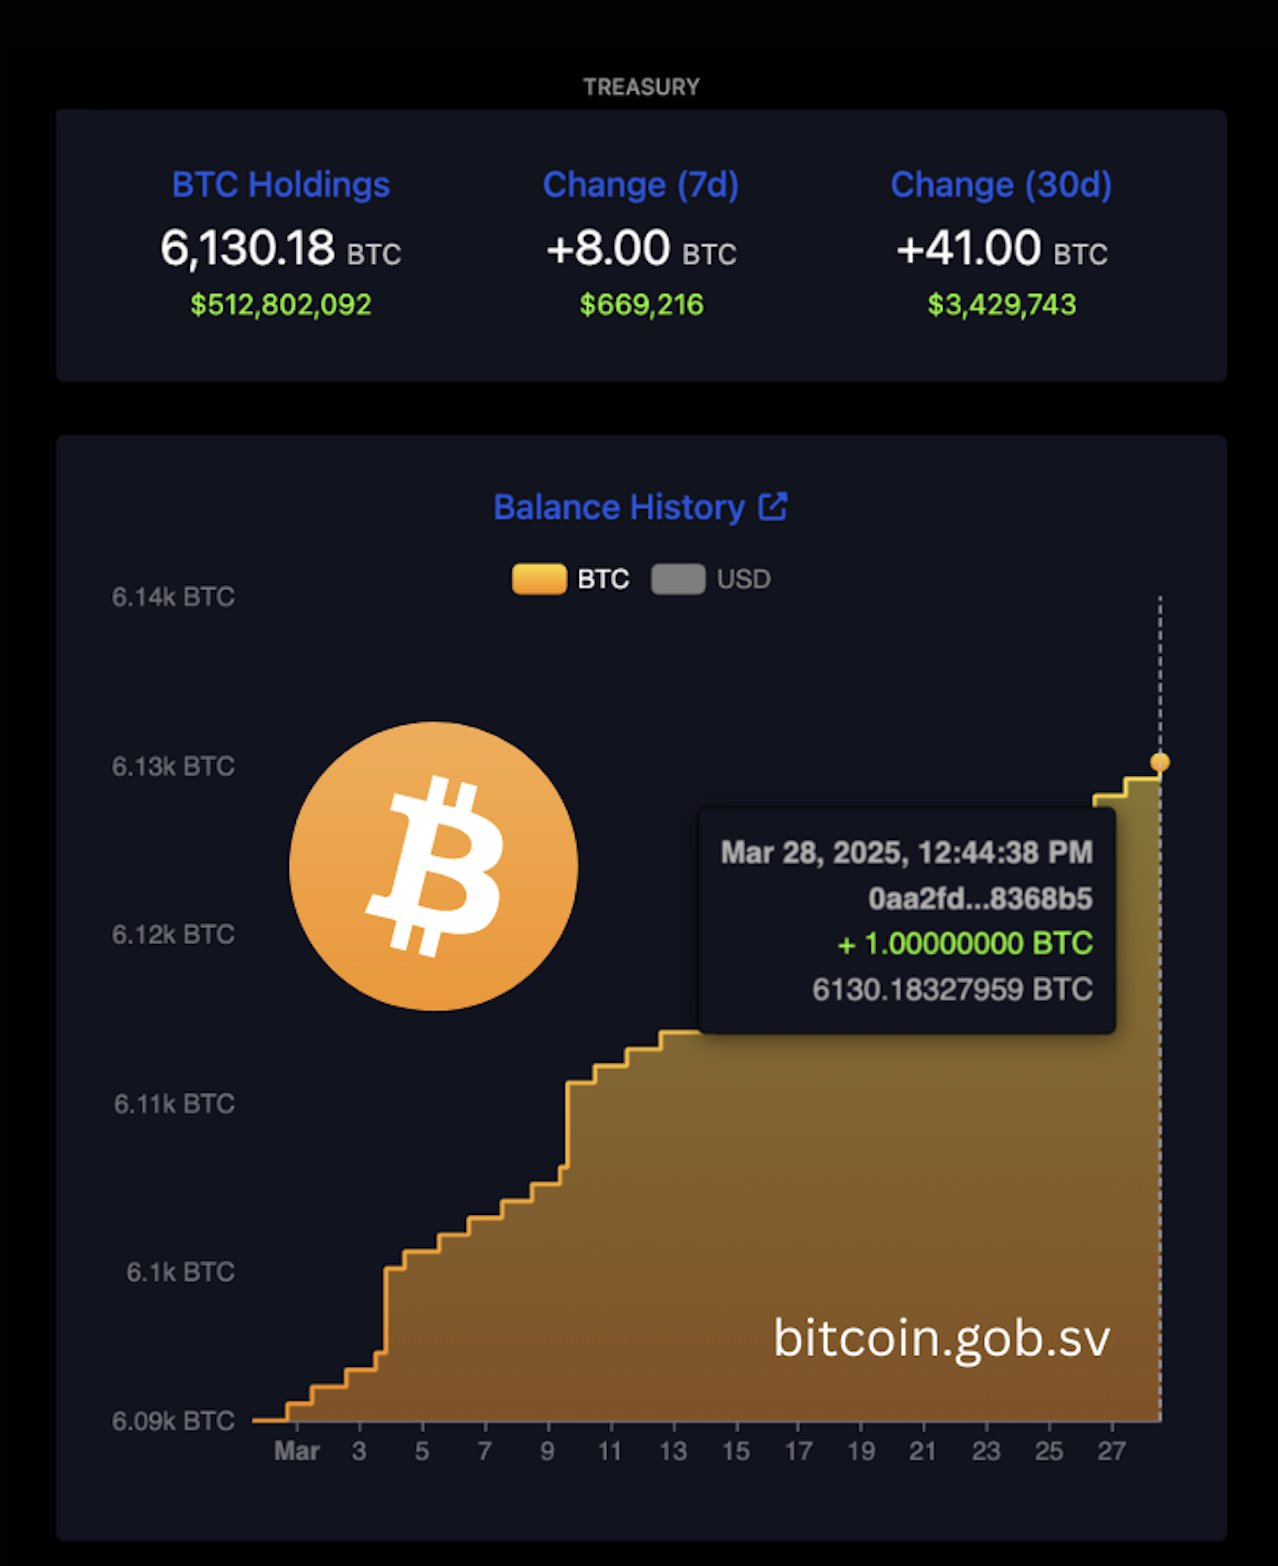
Bukele’s stance on Bitcoin is notably proactive. In 2021, he spearheaded the creation of the world’s first national Bitcoin reserve, which has since grown to 6,130.18 BTC—worth over $512 million.
Moreover, his pro-Bitcoin initiatives have attracted substantial foreign investments, including partnerships with prominent crypto companies like Tether.
President Trump also recently became more supportive of the top crypto asset, reversing previous skepticism.
Earlier this month, Trump authorized the establishment of a US National Bitcoin Reserve, with the federal government holding initial holdings of around 200,000 BTC.
Disclaimer
In adherence to the Trust Project guidelines, BeInCrypto is committed to unbiased, transparent reporting. This news article aims to provide accurate, timely information. However, readers are advised to verify facts independently and consult with a professional before making any decisions based on this content. Please note that our Terms and Conditions, Privacy Policy, and Disclaimers have been updated.
In the March 27, 2025 analysis, titled “Where is Bitcoin headed next? A Signal hidden in Real-Time Data,” Truflation highlights a recurring phenomenon: each time its inflation index experiences a pronounced downtrend that later pauses or reverses, Bitcoin has tended to surge soon afterward.
Where Is Bitcoin Headed Next?
Truflation’s research points to a backdrop shaped by the aftermath of COVID-19, when central banks worldwide slashed interest rates to almost zero and funneled liquidity into the economy. That period of easy money overlapped with Bitcoin’s run to all-time highs in 2021. By 2022 and 2023, however, persistent inflation took hold, prompting the US Federal Reserve to reverse course. Interest rate hikes and quantitative tightening became the primary tools for fighting price pressures, with the Federal Reserve explicitly aiming to bring consumer price inflation down to 2%.
According to the Truflation report, real-time inflation readings reached as low as 2% in June 2023. The official Consumer Price Index (CPI), published by the Bureau of Labor Statistics, mirrored that pattern about a month and a half later, bottoming out at 3% in July 2023. Yet from mid-2023 onward, Truflation’s index did not simply keep dropping in a straight line. Instead, it oscillated between higher and lower bounds, demonstrating a cyclical pattern of disinflation that would then stabilize or reverse course. Truflation now believes that each of these cyclical “inflection points” closely correlates with subsequent upswings in Bitcoin’s price.
The report references four distinct periods from September 2023 to September 2024 when Truflation’s index trended downward and then either flattened or rebounded. In each of those cases, Bitcoin’s price rose soon after. Truflation suggests that a fifth such event may now be unfolding: the inflation index dropped steeply in early 2025, hitting around 1.30%—a level not seen in several months—before rebounding to 1.80%. This situation is reminiscent of previous disinflation troughs that, based on Truflation’s data, presaged a new wave of Bitcoin buying.
“When Truflation’s disinflation trend pauses or reverses, Bitcoin tends to rally shortly after. This pattern has repeated a few times already — and if history rhymes, it may be unfolding once again soon,’” the analysis states.
The underlying reason, Truflation explains, revolves around Bitcoin’s forward-looking nature and its sensitivity to changes in liquidity conditions. Strong disinflation usually prompts speculation that the Federal Reserve may be done raising rates and could soon turn dovish. While steep and unrelenting disinflation can trigger fears of recession, a slowdown or pause in that disinflation trend often reassures markets that the economy is not sliding into an economic downturn.
This “soft landing” scenario emboldens risk-on sentiment. Traders and investors who believe that inflation has been subdued enough to delay additional tightening—or to accelerate rate cuts—frequently channel their optimism into assets like Bitcoin.
The report acknowledges that no single piece of data, including Truflation’s own, holds absolute sway over an asset as complex and widely traded as Bitcoin. However, it emphasizes that real-time inflation expectations reverberate throughout global markets, influencing equities, commodities, and foreign exchange trading, in addition to crypto. By anticipating shifts in those expectations, some investors may find themselves ahead of the curve when official CPI reports and central bank pronouncements finally confirm or contradict the evolving trend.
“Truflation doesn’t influence Bitcoin in a vacuum. No single data source ever does. But inflation expectations ripple across a wide range of markets — from equities to commodities — and especially into bond yields and forex markets,” the analysis concludes.
At press time, BTC traded at $84,461.

Featured image created with DALL.E, chart from TradingView.com
Editorial Process for bitcoinist is centered on delivering thoroughly researched, accurate, and unbiased content. We uphold strict sourcing standards, and each page undergoes diligent review by our team of top technology experts and seasoned editors. This process ensures the integrity, relevance, and value of our content for our readers.

Ethereum Drops As Two Whales Face $235 Million Liquidation Risk

Dark Web Criminals Are Selling Binance and Gemini User Data

Bitcoin Price Could Surge To $95,000 — But Analyst Sounds ‘Bull Trap’ Alarm

Ethereum Breakdown, Analyst Eyes $1,130–$1,200 Price Target
Did XRP Price Just Hit $21K? Live TV Display Error Goes Viral

El Salvador’s Nayib Bukele Open to White House Visit

2.52 Million Altcoins Are Ruining Crypto’s Future

Animoca Brands Valuation Tanks 75% In Two Years, Here’s Why

Crypto exchange BingX hacked for $43 million

Are The Big Players Losing Interest?

Hong Kong’s Securities Association Tips Authorities On Crypto Self-Regulation

Coinbase cbBTC Set to go Live on Solana
2.52 Million Altcoins Are Ruining Crypto’s Future
Animoca Brands Valuation Tanks 75% In Two Years, Here’s Why
Crypto exchange BingX hacked for $43 million
Are The Big Players Losing Interest?
Hong Kong’s Securities Association Tips Authorities On Crypto Self-Regulation
Coinbase cbBTC Set to go Live on Solana
-

 Regulation21 hours ago
FDIC Revises Crypto Guidelines Allowing Banks To Enter Digital Assets
-
 Regulation24 hours ago
AVAX Price Eyes Rally To $44 As Grayscale Files For Avalanche ETF
-

 Market16 hours ago
Why Did MUBARAK Drop 40% Despite Binance Listing?
-

 Altcoin21 hours ago
Shiba Inu Price Set To Repeat History? Falling Wedge Pattern Shows A Rally
-

 Altcoin16 hours ago
Analyst Reveals Bullishness On Ethereum Price At This Point, Can It Hit $4,000 Again?
-
 Regulation20 hours ago
Sonic Labs To Abandon Plans For Algorithmic USD Stablecoin, Here’s Why
-

 Market19 hours ago
Coinbase Users Lost $46 Million to Crypto Scams in March
-

 Altcoin19 hours ago
PiDaoSwap, Trump Media, & Grayscale